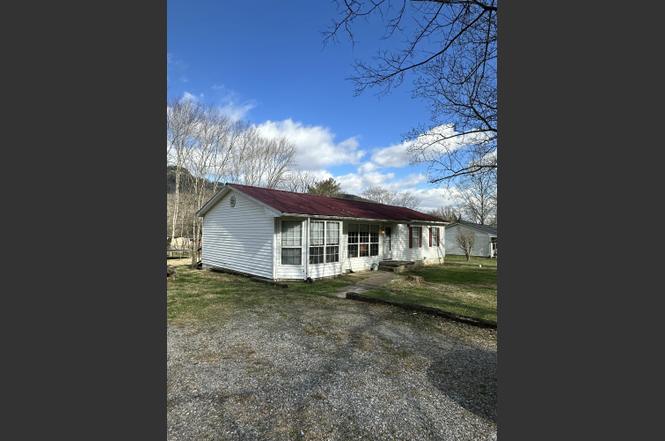
804 Castleview Cir · Jasper, TN
Flood risk 1/10 · Minimal
- FEMA flood zone
- X (unshaded)
- Chance of flooding over 30 yrs
- 0.0%
- Est. flood insurance / yr
- $473 – $860
Fire risk 4/10 · Minor
- Est. fire insurance / yr
- $949 – $1,763
Heat risk 5/10 · Moderate
- Hot days now (above 106°F)
- 9 days/yr
- Hot days in 30 yrs
- 24 days/yr
Wind risk 4/10 · Minor
- Chance of severe wind over 30 yrs
- 10.0%
Air-quality risk 3/10 · Minor
- Unhealthy air days now
- 2 days/yr
- Unhealthy air days in 30 yrs
- 2 days/yr
Risk factors via First Street. Map © Google.
Why this score? — see what drove the C+ grade
The composite is a weighted blend of 9 inputs, each scored 0–100. Each bar is that input's sub-score; the figure is the points it added to the 100-point composite (weight × sub-score).
- Cash flow +25.7/30.0
- ARV discount +13.2/15.0
- DSCR +8.6/10.0
- 1% rule +6.8/10.0
- Livability +3.0/5.0
- Rent growth +2.5/5.0
- Condition / age +2.5/5.0
- Schools +2.1/10.0
- Appreciation +0.0/10.0
$195,000
🖨 Deal sheet 📄 Offer letter ✓ Due diligence
Listing remarks
Great starter home located in Jasper Tennessee! This 4 bedroom, 1 bath features living room, kitchen, & dinning room that leads out to back deck. Level yard with fenced dog pen, fire pit and view of Castlerock. Home to be ''Sold As Is''.
Key facts
- Level yard
- Fenced dog pen
- Kitchen
Tags
Neighborhood map
What this means for you Summary
Snapshot
- This is a 4-bed/1.0-bath single-family listed at $195k.
Deal economics
- At list price, monthly cash flow is $469 ($6k/yr) — positive.
- The deal already cash-flows at list — no discount required.
- Meets the 1% rule at list price ($2k rent vs $195k).
- Recommended offer: $177k (9.0% below list) — sets the bar for market timing.
- Cap rate 9.2% vs local median 1.7% in Jasper — top-decile yield for the area; either an underpriced asset or a hidden risk that comps aren't pricing in. Stress-test before assuming the spread holds.
Location & tenants
- Location reads 59/100 on livability (#287 in TN) — a working-class tenant base; expect higher turnover. Strengths: cost of living A+, crime A-, housing B; Watch: amenities F, commute F, employment D-.
- Marion County (town): math 24% / reading 25% proficiency, ranked #89 of 139 in TN (top 64%) — low school quality limits family demand, transient renter base, plan for 1-2y turnover.
- Zoned schools: Jasper Elementary School (math 36% / reading 33%, grade F, #319 of 952 statewide, top 37%, 629 students, 0% FRL); Jasper Middle School (math 20% / reading 20%, grade F, #198 of 333 statewide, top 61%, 491 students, 0% FRL); Marion Co High School (math 8% / reading 42%, grade F, #125 of 332 statewide, top 38%, 491 students, 0% FRL) — zoned schools average 0% FRL vs 57% district-wide (57 pts lower); this property's tenant base skews higher-income than the district average.
- Market conditions: 417 active listings in the ZIP; 1 comparable units currently listed for rent nearby; 225 units permitted in Marion County in 2024 (0 in 5+ unit buildings).
Forward outlook
- Local home prices are declining (-3.0%/yr); year-one equity from $1k of loan paydown is wiped out by about $6k of value loss. Plan a longer hold.
Negotiation context
- It's been on market 91 days — a 9% lower offer ($177k) is reasonable based on typical stale-listing flexibility.
Risks & watch-outs
- Climate carrying-cost: extreme-heat days projected 9→24/yr by 2055 (HVAC capex compounding) — expect insurance premiums to compound above CPI over the hold.
Questions for the listing agent
- It's been on market 91 days. Have you received any prior offers? Is the seller open to a 9% concession, seller financing, or rate buy-down credit?
- Built in 1964 — when were the roof, HVAC, electrical panel, plumbing, and water heater last replaced?
- Why hasn't it sold? Are there any deal-killer items the seller is aware of (foundation, flood, title, zoning, code violations)?
- Is there a deadline driving the sale (1031 exchange, divorce, estate, relocation)? That informs how much negotiation room exists.
- Schools are F-rated, which usually means shorter tenancies and higher turnover. Who's the typical renter profile here, and what's been the actual vacancy rate?
- What's the average days-on-market for RENTAL listings here right now (not sales)? A rising rental-DOM trend means longer vacancies and softer asking-rent achievability than the comps imply.
- What's the recent tenant-quality profile in this submarket — average credit score on applications, eviction rate, late-payment / NSF rate, and stable-employment percentage? A property-management company in the area should have these aggregated.
- How much new for-sale + rental construction is in the pipeline within 1–3 miles? Heavy new supply typically softens prices + rents 12–24 months out; constrained supply supports both.
Investment metrics
- 1% rule
- 1.18% ✓
- Cap rate
- 9.18%
- Cash-on-cash
- 10.32%
- DSCR
- 1.46
- GRM
- 7.1
CMA / ARV
- ARV (on-the-fly)
- $223,488
- Comps found
- 9
Show comp detail 9 sales within ~0.75 mi
| Address | Dist | Beds/Ba | Sqft | Sold | Price | $/sf | Match |
|---|---|---|---|---|---|---|---|
| 803 Pryor Cove Rd | 0.06mi | 3/1.5 (-1) | 1,118 (-4%) | 16mo | $240,000 | $215 | 70 |
| 800 Pryor Cove Rd | 0.11mi | 3/1.0 (-1) | 1,279 (+10%) | 13mo | $246,000 | $192 | 62 |
| 909 Hickory St | 0.15mi | 3/2.0 (-1) | 1,304 (+12%) | 3mo | $270,500 | $207 | 62 |
| 102 Danny Dr | 0.38mi | 3/1.5 (-1) | 1,072 (-8%) | 4mo | $220,000 | $205 | 58 |
| 205 Danny Dr | 0.41mi | 3/2.0 (-1) | 1,296 (+11%) | 3mo | $230,000 | $177 | 50 |
| 1020 Highland Ave | 0.67mi | 3/1.0 (-1) | 1,200 (+3%) | 15mo | $230,000 | $192 | 46 |
| 403 Mary Lee Dr | 0.36mi | 3/2.0 (-1) | 1,328 (+14%) | 13mo | $239,000 | $180 | 40 |
| 1114 Highland Ave | 0.65mi | 3/1.5 (-1) | 1,290 (+11%) | 14mo | $226,600 | $176 | 33 |
| 1120 Dennis Ave | 0.73mi | 4/2.0 | 1,326 (+14%) | 11mo | $240,000 | $181 | 29 |
Match score weights: distance 35% · size 25% · config 20% · recency 20%. Top-matched comps best support the ARV.
Projected returns pro-forma
-3.0% appreciation · 3.0% rent growth · sell at horizon
- IRR
- -0.8%
- Equity multiple
- 0.97×
- Total profit
- $-1,667
- Equity at exit
- $29,075
- IRR
- 8.9%
- Equity multiple
- 1.68×
- Total profit
- $37,185
- Equity at exit
- $16,860
Cash invested: $54,600 (down + closing). Projections, not guarantees.
Landlord ↔ Tenant lean methodology
- Overall (STATE)
- 87 Strongly Landlord-Friendly
- State Tennessee
- 87 Strongly Landlord-Friendly · R+13
- County
- — inherits STATE
- City
- — inherits STATE
ZIP-level market 37347
- Home prices YoY
- -8.4%
- Active inventory
- 417
- Price-to-rent
- 7.1×
Monthly cashflow live
- Estimated rent
- $2,300 medium interval (Pro) →
- Mortgage (P&I)
- −$1,023
- Tax est. 1.5%
- −$244 /mo · $2,925/yr
- Insurance
- −$81
- HOA
- −$0
- Vacancy / Maint / Mgmt
- −$483
- Net cashflow
- $469
Break-even live
UW: 25.0% down · 7.5% · 30yr · 1.5% tax · 5.0% vac · 8.0% maint · 8.0% mgmt
Financing live
Cash to close
- Down payment
- $48,750
- Closing costs
- $5,850
- Reserves months
- —
- Total cash needed
- —
Loan-product check · same deal, 3 products live
Conventional
25% down · 7.5% · 30yr
- Down + closing
- —
- Monthly P&I
- —
- Monthly cashflow
- —
- DSCR
- —
- Eligible?
- —
Personal DTI + credit; lowest rate.
DSCR
20% down · 8.5% · 30yr
- Down + closing
- —
- Monthly P&I
- —
- Monthly cashflow
- —
- DSCR
- —
- Eligible?
- —
No personal income docs; deal must DSCR.
Hard money
10% down · 12.0% · 12mo
- Down + closing
- —
- Monthly P&I
- —
- Monthly cashflow
- —
- DSCR
- —
- Eligible?
- —
Short-term bridge; refi at stabilization.
Rent comps 1 comps
| Address | Beds | Baths | Sqft | Rent | $/sqft | DOM | Units | Dist |
|---|---|---|---|---|---|---|---|---|
| 410 Marshall Hall Rd Jasper, TN | 3.0 | 2.0 | 1344 | $2,300 | $1.71 | 23d | 1 | 0.56mi |
Listing history 6 events
-
2026-04-18status Pending
-
2026-04-09price $195,000
-
2026-01-18$205,000 Active
-
2023-03-08soldstatus $182,000
-
2022-04-04soldstatus $64,000
-
1999-07-21soldstatus $33,500
ⓘ Source: listings_history table (triggers on properties + properties_extension) + one-shot
backfill from property_details.listing_events for pre-trigger history.
Climate risk First Street
- Flood 1/10 Low FEMA zone X (unshaded) · 0% chance over 30 yrs
- Wildfire 4/10 Moderate
- Heat 5/10 Major 9 d/yr ≥106°F today · 24 d/yr by 30 yrs out
- Wind 4/10 Moderate 10% chance of damaging wind over 30 yrs
- Air quality 3/10 Moderate 2 unhealthy d/yr today · 2 by 30 yrs out
Nearby sold comps map
Loading sold comps map…
Walkable amenities ~0.75 mi
Loading nearby amenities…
Taxation est. · year 1
- Rental income
- $27,600
- − Mortgage interest
- −$10,923
- − Property taxes
- −$2,925
- − Insurance
- −$975
- − Repairs & maintenance
- −$2,208
- − Management
- −$2,208
- − Depreciation
- −$5,673
- Taxable income
- $2,688
- Est. tax owed @ 24.0%
- −$645
- After-tax cash flow
- $4,988/yr
For passive investors: Depreciation is non-cash, so a rental often shows a tax loss while cash-flowing — sheltering income. Rental losses are passive: they offset passive income freely, and up to $25,000/yr can offset ordinary (W-2) income if you actively participate and your MAGI is under $100k (phasing out to $0 by $150k); unused losses carry forward. On sale, claimed depreciation is recaptured at up to 25%, and gains may owe capital-gains tax (a 1031 exchange can defer both). Figures are a year-1 estimate at your 24.0% rate — not tax advice; consult a CPA.
Schools (NCES district)
- District
- Marion County
- NCES district ID
- 4702640
- Math proficiency
- 24% ▼ -2.00%
- Reading proficiency
- 25% ▼ -3.00%
- Median HH income
- $41,941
- Composite
- 20.88/100
- National rank
- #8494
- State rank
- #89 of 139 in TN
Livability — Jasper
- Score
- 59/100
- State rank
- #287
- US rank
- #20173
Category grades
Schools grade is shown separately in the Schools card above.
Census & demographics
- Census place
- Jasper, TN
- City population
- 8,555
- Population (ZIP)
- 8,555
Population outlook (Marion County) Hauer SSP2
- Today (2025)
- 28,889 people
- By 2030
- 28,915 · +0.1%
- By 2040
- 28,662 · -0.8%
- By 2050
- 28,053 · -2.9%
- By 2075
- 26,855 · -7.0%
- By 2100
- 24,404 · -15.5%
Race, ethnicity, and origin ACS 2023
- Neighborhood character
- Predominantly White (83%)
- Race & ethnicity
- White 83% Two or more races 7% Black 5% Hispanic / Latino 4%
- Common ancestry
- Serbian 3% Slovak 2% Italian 1%
- Foreign-born
- 2% · Canada, South Korea
- Languages at home
- 97% English-only · Spanish 2%
Political lean MEDSL · Marion
- 2024 margin
- Solid R (+55.7) · D 21.7% · R 77.4%
- 2008→2024 swing
- -34.3pp toward R · 2008: -21.4pp · 2024: -55.7pp
- All cycles
- 2024: R+55.7 2020: R+50.8 2016: R+44.8 2012: R+22.3 2008: R+21.4
Not yet ingested
- Civics
- —
Market trends
- HPI YoY
- ▼ -27.40%
- Current HPI
- 300.261
- Rent YoY
- —
- Metro
- —
- State GDP YoY
- ▲ 2.78%
- F500 in state
- 22
Industry mix (Fortune 500 HQ in TN)
| Industry | F500 HQs | Revenue |
|---|---|---|
| Healthcare | 3 | $91B |
|
||
| Retail | 3 | $72B |
|
||
| Transportation / Logistics | 1 | $88B |
|
||
| Paper / Packaging | 1 | $19B |
|
||
| Insurance | 1 | $13B |
|
||
| Energy | 1 | $12B |
|
||
Price history
+482.1% since first listed6 events — show timeline
- 2026-04-18 Pending — GCAR
- 2026-04-09 Price Changed $195,000 GCAR
- 2026-01-18 Listed $205,000 GCAR
- 2023-03-08 Sold (Public Records) $182,000 Public Records
- 2022-04-04 Sold (Public Records) $64,000 Public Records
- 1999-07-21 Sold (Public Records) $33,500 Public Records
Property tax history
+0.1%/yrLatest (2025): $328 · +0.0% YoY. Source: county tax records.
Cash-flow waterfall
monthlySold comps — $/sqft
last 12 mo · ≤1 miLoading sold comps…