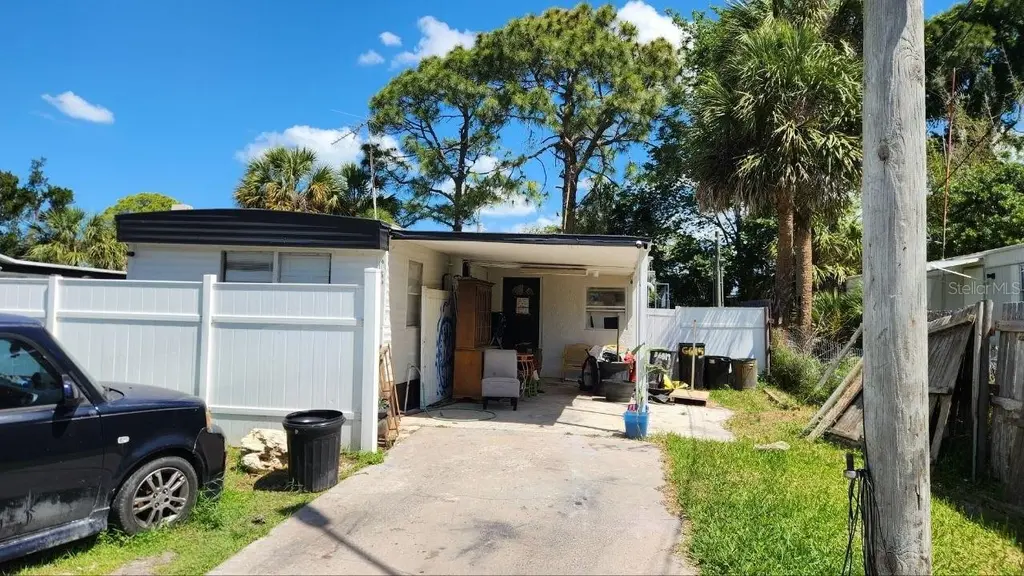
6519 Margaret Dr · Bayonet Point, FL
Flood risk 10/10 · Severe
- FEMA flood zone
- AE
- Chance of flooding over 30 yrs
- 0.99%
- Est. flood insurance / yr
- $1,737 – $8,500
Fire risk 4/10 · Minor
- Est. fire insurance / yr
- $947 – $1,759
Heat risk 10/10 · Severe
- Hot days now (above 114°F)
- 7 days/yr
- Hot days in 30 yrs
- 22 days/yr
Wind risk 10/10 · Severe
- Chance of severe wind over 30 yrs
- 99.0%
Air-quality risk 2/10 · Minimal
- Unhealthy air days now
- 1 days/yr
- Unhealthy air days in 30 yrs
- 3 days/yr
Risk factors via First Street. Map © Google.
Why this score? — see what drove the C+ grade
The composite is a weighted blend of 9 inputs, each scored 0–100. Each bar is that input's sub-score; the figure is the points it added to the 100-point composite (weight × sub-score).
- Cash flow +30.0/30.0
- 1% rule +10.0/10.0
- DSCR +10.0/10.0
- Schools +4.3/10.0
- Livability +3.5/5.0
- Rent growth +2.8/5.0
- Condition / age +2.5/5.0
- ARV discount +0.0/15.0
- Appreciation +0.0/10.0
$72,999
🖨 Deal sheet 📄 Offer letter ✓ Due diligence
Listing remarks
Welcome to 6519 Margaret Dr in Port Richey, Florida — a beautifully remodeled mobile home offering modern updates and excellent value. This home has been thoughtfully upgraded with refreshed finishes and a move-in-ready interior, making it a great option for a primary residence, vacation home, or investment property. Conveniently located near local shopping, dining, and Gulf Coast attractions. Cash only sale. More photos coming soon — schedule your showing today and be among the first to view this updated property!
Key facts
- 5,500 sq ft lot
- Parking
- Built 1969
Property features AI
Finance
- Other: Lot is approximately 0.13 acre (paved road access)
- Financial info: No lease restrictions reported
- HOA & community: Not in an association; Located in a senior community
Exterior
- Parking: Has carport (1 space)
- Security: No security features listed
- Utilities: Public water; Septic tank; Electricity available
- Home design: Residential mobile home (single wide); One story; Faces south
- Construction: Metal siding; Other roof; Other foundation; Built on a single level
- Exterior features: Outdoor lighting
Interior
- Kitchen: No appliances listed
- Bedrooms: 2 bedrooms
- Flooring: Other flooring
- Bathrooms: 1 full bathroom; 1 half bathroom
- Heating & cooling: No heating; Mini-split cooling unit(s)
- Interior features: No notable interior features listed
- Laundry & utility: Laundry: Other
Neighborhood map
What this means for you Summary
Snapshot
- This is a 2-bed/2.0-bath manufactured listed at $73k.
Deal economics
- At list price, monthly cash flow is $130 ($2k/yr) — positive.
- The deal already cash-flows at list — no discount required.
- Meets the 1% rule at list price ($1k rent vs $73k).
- Recommended offer: $71k (3.0% below list) — sets the bar for market timing.
- Cap rate 15.4% vs local median 5.3% in Bayonet Point — top-decile yield for the area; either an underpriced asset or a hidden risk that comps aren't pricing in. Stress-test before assuming the spread holds.
Location & tenants
- Location reads 69/100 on livability (#485 in FL) — a middle-class / working-renter tenant base. Strengths: cost of living A+, housing A+, health & safety A+; Watch: crime D+, amenities D+, schools F.
- Pasco (suburban): math 50% / reading 52% proficiency, ranked #32 of 73 in FL (top 44%) — acceptable for families but not a draw, mixed tenant base, ~2y average lease.
- Market conditions: Rents rising (+1.3%/yr); 577 active listings in the ZIP; 4 comparable units currently listed for rent nearby; rentals at typical pace (median 25d on market — plan ~3-4 weeks tenant-placement turnaround); 6,765 units permitted in Pasco County in 2024 (1,250 in 5+ unit buildings).
- This rent runs 33% of the median local income ($47k/yr) — at the standard rent-burdened threshold; future hikes will face affordability resistance.
Forward outlook
- Local home prices are declining (-3.0%/yr); year-one equity from $504 of loan paydown is wiped out by about $2k of value loss. Plan a longer hold.
- Pasco County population projected at +29% by 2050 — long-run rental-demand tailwind backs the buy-and-hold thesis.
Negotiation context
- It's been on market 51 days — a 3% lower offer ($71k) is reasonable based on typical stale-listing flexibility.
- 6 sale attempts since 20y ago with the ask held roughly flat each time — persistent listings suggest the price (not the market) is what's stuck; bring a comps-based counter.
Risks & watch-outs
- Watch-outs: flood insurance adds $427/mo.
- Climate carrying-cost: in FEMA flood zone AE (mandatory federal flood insurance); severe wind risk, 99% chance of damaging wind over 30y; extreme-heat days projected 7→22/yr by 2055 (HVAC capex compounding) — expect insurance premiums to compound above CPI over the hold.
Questions for the listing agent
- It's been on market 51 days. Have you received any prior offers? Is the seller open to a 3% concession, seller financing, or rate buy-down credit?
- Built in 1969 — when were the roof, HVAC, electrical panel, plumbing, and water heater last replaced?
- What's the actual annual flood-insurance premium (NFIP or private), and is the property in a SFHA with mandatory coverage?
- Is there a deadline driving the sale (1031 exchange, divorce, estate, relocation)? That informs how much negotiation room exists.
- Schools are F-rated, which usually means shorter tenancies and higher turnover. Who's the typical renter profile here, and what's been the actual vacancy rate?
- Crime grade is D in this area — have there been break-ins, vandalism, or insurance claims at this property in the last 3 years? What carrier currently insures it and at what premium?
- What's the average days-on-market for RENTAL listings here right now (not sales)? A rising rental-DOM trend means longer vacancies and softer asking-rent achievability than the comps imply.
- What's the recent tenant-quality profile in this submarket — average credit score on applications, eviction rate, late-payment / NSF rate, and stable-employment percentage? A property-management company in the area should have these aggregated.
- How much new for-sale + rental construction is in the pipeline within 1–3 miles? Heavy new supply typically softens prices + rents 12–24 months out; constrained supply supports both.
Investment metrics
- 1% rule
- 1.80% ✓
- Cap rate
- 15.44%
- Cash-on-cash
- 32.67%
- DSCR
- 2.45
- GRM
- 4.6
CMA / ARV
- ARV (on-the-fly)
- $53,760
- Comps found
- 4
Show comp detail 4 sales within ~0.75 mi
| Address | Dist | Beds/Ba | Sqft | Sold | Price | $/sf | Match |
|---|---|---|---|---|---|---|---|
| 6515 Margaret Dr | 0.01mi | 2/1.0 | 672 (0%) | 8mo | $50,000 | $74 | 88 |
| 6506 Cathy Dr | 0.11mi | 2/1.0 | 689 (+2%) | 14mo | $55,000 | $80 | 75 |
| 7215 Lofty Dr | 0.70mi | 2/1.5 | 672 (0%) | 7mo | $94,900 | $141 | 60 |
| 6612 Roosevelt Dr | 0.67mi | 1/1.0 (-1) | 576 (-14%) | 11mo | $17,000 | $30 | 26 |
Match score weights: distance 35% · size 25% · config 20% · recency 20%. Top-matched comps best support the ARV.
Projected returns pro-forma
-3.0% appreciation · 1.28% rent growth · sell at horizon
- IRR
- -7.5%
- Equity multiple
- 0.73×
- Total profit
- $-5,528
- Equity at exit
- $10,884
- IRR
- -1.6%
- Equity multiple
- 0.90×
- Total profit
- $-1,946
- Equity at exit
- $6,312
Cash invested: $20,440 (down + closing). Projections, not guarantees.
Landlord ↔ Tenant lean methodology
- Overall (STATE)
- 87 Strongly Landlord-Friendly
- State Florida
- 87 Strongly Landlord-Friendly · R+3
- County
- — inherits STATE
- City
- — inherits STATE
ZIP-level market 34668
- Home prices YoY
- -17.4%
- Rents YoY
- 1.3%
- Active inventory
- 577
- Price-to-rent
- 4.6×
Monthly cashflow live
- Estimated rent
- $1,316 medium interval (Pro) →
- Mortgage (P&I)
- −$383
- Tax from tax record
- −$70 /mo · $837/yr
- Insurance
- −$30
- Flood insurance flood zone
- −$427 /mo · $5,118/yr
- HOA
- −$0
- Vacancy / Maint / Mgmt
- −$276
- Net cashflow
- $130
Break-even live
UW: 25.0% down · 7.5% · 30yr · 1.5% tax · 5.0% vac · 8.0% maint · 8.0% mgmt
Financing live
Cash to close
- Down payment
- $18,250
- Closing costs
- $2,190
- Reserves months
- —
- Total cash needed
- —
Loan-product check · same deal, 3 products live
Conventional
25% down · 7.5% · 30yr
- Down + closing
- —
- Monthly P&I
- —
- Monthly cashflow
- —
- DSCR
- —
- Eligible?
- —
Personal DTI + credit; lowest rate.
DSCR
20% down · 8.5% · 30yr
- Down + closing
- —
- Monthly P&I
- —
- Monthly cashflow
- —
- DSCR
- —
- Eligible?
- —
No personal income docs; deal must DSCR.
Hard money
10% down · 12.0% · 12mo
- Down + closing
- —
- Monthly P&I
- —
- Monthly cashflow
- —
- DSCR
- —
- Eligible?
- —
Short-term bridge; refi at stabilization.
Rent comps 4 comps
| Address | Beds | Baths | Sqft | Rent | $/sqft | DOM | Units | Dist |
|---|---|---|---|---|---|---|---|---|
| 11430 Rohrman Rd Port Richey, FL | 1.0 | 1.0 | 700 | $1,000 | $1.43 | 5d | 1 | 0.14mi |
| 7213 Seward Dr Port Richey, FL | 2.0 | 1.0 | 700 | $1,500 | $2.14 | 24d | 1 | 0.75mi |
| 7110 Tudor Ln Port Richey, FL | 1.0 | 1.0 | 676 | $1,310 | $1.94 | 2d | 1 | 0.93mi |
| 7110 Tudor Ln Port Richey, FL | 1.0 | 1.0 | 676 | $1,310 | $1.94 | 24d | 1 | 0.93mi |
Listing history 24 events
-
2026-06-18days on market $72,999 Active 51 DOM
-
2026-06-17days on market $72,999 Active 50 DOM
-
2026-06-16days on market $72,999 Active 49 DOM
-
2026-06-15days on market $72,999 Active 48 DOM
-
2026-06-13pricedays on market $72,999 Active 46 DOM
-
2026-06-09days on market $75,000 Active 42 DOM
-
2026-06-08days on market $75,000 Active 41 DOM
-
2026-06-07days on market $75,000 Active 40 DOM
-
2026-06-04days on market $75,000 Active 37 DOM
-
2026-06-03days on market $75,000 Active 36 DOM
-
2026-06-02days on market $75,000 Active 35 DOM
-
2026-06-01days on market $75,000 Active 34 DOM
-
2026-05-31days on market $75,000 Active 33 DOM
-
2026-04-29$75,000 Active
-
2024-09-19historical
-
2024-08-14status Active
-
2024-08-07status Pending
-
2024-05-12$199,999 Active
-
2023-11-01soldstatus $75,000
-
2023-10-27$75,000
-
2007-04-20soldstatus $31,500
-
2007-02-15$36,900
-
2006-07-06soldstatus $12,500
-
2006-05-05$19,900
ⓘ Source: listings_history table (triggers on properties + properties_extension) + one-shot
backfill from property_details.listing_events for pre-trigger history.
Tax reassessment forecast FL · Resets to sale price
- Current annual tax
- $837 · $70/mo
- Projected year-2 tax
- $837 · $70/mo
- Expected delta
- $0/yr ($0/mo · 0.0%)
ⓘ Screening estimate from a state-policy table — verify with the county assessor before closing.
Climate risk First Street
- Flood 10/10 Extreme FEMA zone AE · 99% chance over 30 yrs
- Wildfire 4/10 Moderate
- Heat 10/10 Extreme 7 d/yr ≥114°F today · 22 d/yr by 30 yrs out
- Wind 10/10 Extreme 99% chance of damaging wind over 30 yrs
- Air quality 2/10 Low 1 unhealthy d/yr today · 3 by 30 yrs out
Nearby sold comps map
Loading sold comps map…
Walkable amenities ~0.75 mi
Loading nearby amenities…
Taxation est. · year 1
- Rental income
- $15,788
- − Mortgage interest
- −$4,089
- − Property taxes
- −$837
- − Insurance
- −$5,483
- − Repairs & maintenance
- −$1,263
- − Management
- −$1,263
- − Depreciation
- −$2,124
- Taxable income
- $729
- Est. tax owed @ 24.0%
- −$175
- After-tax cash flow
- $1,383/yr
For passive investors: Depreciation is non-cash, so a rental often shows a tax loss while cash-flowing — sheltering income. Rental losses are passive: they offset passive income freely, and up to $25,000/yr can offset ordinary (W-2) income if you actively participate and your MAGI is under $100k (phasing out to $0 by $150k); unused losses carry forward. On sale, claimed depreciation is recaptured at up to 25%, and gains may owe capital-gains tax (a 1031 exchange can defer both). Figures are a year-1 estimate at your 24.0% rate — not tax advice; consult a CPA.
Schools (NCES district)
- District
- Pasco
- NCES district ID
- 1201530
- Math proficiency
- 50% ▼ -10.00%
- Reading proficiency
- 52% ▼ -5.00%
- Median HH income
- $45,039
- Composite
- 43.14/100
- National rank
- #3074
- State rank
- #32 of 73 in FL
Livability — Bayonet Point
- Score
- 69/100
- State rank
- #485
- US rank
- #8934
Category grades
Schools grade is shown separately in the Schools card above.
Census & demographics
- County
- Pasco County · 524,098 people
- Metro
- Tampa-St. Petersburg-Clearwater, FL
- Population (ZIP)
- 49,442
- Household income
- $47,401
- Rent vs Own
- Severe rent burden
- 2699.0
Population outlook (Pasco County) Hauer SSP2
- Today (2025)
- 570,045 people
- By 2030
- 605,844 · +6.3%
- By 2040
- 674,806 · +18.4%
- By 2050
- 736,022 · +29.1%
- By 2075
- 862,900 · +51.4%
- By 2100
- 906,364 · +59.0%
Race, ethnicity, and origin ACS 2023
- Neighborhood character
- Predominantly White (70%)
- Race & ethnicity
- White 70% Hispanic / Latino 23% Two or more races 14% Black 4%
- Hispanic origin (detail)
- Mexican 3% Puerto Rican 10% Cuban 5% Dominican 1%
- Common ancestry
- Romanian 3% Lithuanian 3% Slovak 2%
- Foreign-born
- 11% · Canada, Jamaica
- Languages at home
- 82% English-only · Spanish 14% Other Indo-European 1% French/Haitian/Cajun 1%
Political lean MEDSL · Pasco
- 2024 margin
- Strong R (+25.2) · D 36.9% · R 62.1% · Other 1.0%
- 2008→2024 swing
- -21.6pp toward R · 2008: -3.6pp · 2024: -25.2pp
- All cycles
- 2024: R+25.2 2020: R+20.1 2016: R+21.6 2012: R+6.7 2008: R+3.6
Not yet ingested
- Civics
- —
Market trends
- HPI YoY
- ▼ -75.64%
- Current HPI
- 359.7163
- Rent YoY
- ▲ 1.28%
- Metro
- Tampa-St. Petersburg-Clearwater, FL
- State GDP YoY
- ▲ 3.28%
- F500 in state
- 36
Industry mix (Fortune 500 HQ in FL)
| Industry | F500 HQs | Revenue |
|---|---|---|
| Industrial Technology | 2 | $29B |
|
||
| Insurance | 2 | $17B |
|
||
| Retail | 1 | $60B |
|
||
| Technology Distribution | 1 | $58B |
|
||
| Homebuilding | 1 | $35B |
|
||
| Technology Manufacturing | 1 | $35B |
|
||
Price history
+276.9% since first listed11 events — show timeline
- 2026-04-29 Listed $75,000 Stellar MLS as Distributed by MLS Grid
- 2024-09-19 Listing Removed — Stellar MLS as Distributed by MLS Grid
- 2024-08-14 Relisted — Stellar MLS as Distributed by MLS Grid
- 2024-08-07 Pending — Stellar MLS as Distributed by MLS Grid
- 2024-05-12 Listed $199,999 Stellar MLS as Distributed by MLS Grid
- 2023-11-01 Sold (Public Records) $75,000 Public Records
- 2023-10-27 Listed $75,000 Stellar MLS as Distributed by MLS Grid
- 2007-04-20 Sold (MLS) $31,500 Stellar MLS as Distributed by MLS Grid
- 2007-02-15 Listed $36,900 Stellar MLS as Distributed by MLS Grid
- 2006-07-06 Sold (MLS) $12,500 Stellar MLS as Distributed by MLS Grid
- 2006-05-05 Listed $19,900 Stellar MLS as Distributed by MLS Grid
Property tax history
+14.5%/yrLatest (2025): $837 · +1.1% YoY. Source: county tax records.
Cash-flow waterfall
monthlySold comps — $/sqft
last 12 mo · ≤1 miLoading sold comps…