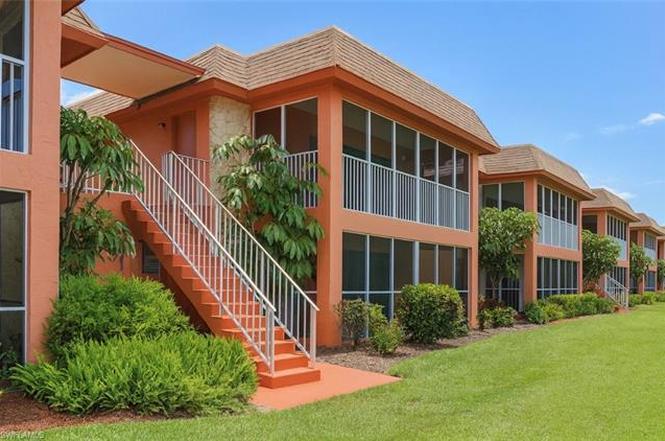
1400 Pompei Ln #77 · Naples, FL
Flood risk 5/10 · Moderate
- FEMA flood zone
- AH
- Chance of flooding over 30 yrs
- 0.23%
- Est. flood insurance / yr
- $1,142 – $2,507
Fire risk 1/10 · Minimal
- Est. fire insurance / yr
- $947 – $1,759
Heat risk 10/10 · Severe
- Hot days now (above 107°F)
- 7 days/yr
- Hot days in 30 yrs
- 28 days/yr
Wind risk 10/10 · Severe
- Chance of severe wind over 30 yrs
- 99.0%
Air-quality risk 2/10 · Minimal
- Unhealthy air days now
- 2 days/yr
- Unhealthy air days in 30 yrs
- 2 days/yr
Risk factors via First Street. Map © Google.
Why this score? — see what drove the C grade
The composite is a weighted blend of 9 inputs, each scored 0–100. Each bar is that input's sub-score; the figure is the points it added to the 100-point composite (weight × sub-score).
- Cash flow +20.4/30.0
- 1% rule +8.8/10.0
- ARV discount +7.5/15.0
- DSCR +6.5/10.0
- Rent growth +5.0/5.0
- Schools +5.0/10.0
- Livability +4.0/5.0
- Condition / age +2.5/5.0
- Appreciation +0.0/10.0
$247,000
🖨 Deal sheet (PDF) 📄 Offer letter ✓ Due diligence
Listing remarks MLS
Beautifully updated!! Gorgeous new kitchen including European cabinets, Granite and Stainless Appliances. Fully renovated baths including tile, vanities and fixtures. Excellent location close to shopping, restaurants and beaches. Many new renovations in the community include exterior paint and added heat system for pool for year round enjoyment!! Schedule your private viewing today! NO DOGS ALLOWED!!!!
Key facts
- Large center island
- Walk-in closet
- Gourmet kitchen
Tags
Property features AI
Finance
- HOA & community: Mandatory homeowners association; Quarterly condo fee of $2,500; Professional management; Community pool; Tennis court; Bike storage; Community type: Condo/Hotel, Non-gated; Maintenance covers insurance, irrigation water, lawn/land maintenance, legal/accounting, manager, exterior pest control, repairs, reserves, sewer, street lights, street maintenance, trash removal, water; Total annual recurring HOA fees listed as $10,000; Total one-time fees listed as $150
Exterior
- Parking: 2 assigned parking spaces; Guest parking available
- Utilities: Central water; Central sewer; Cable available
- Home design: Residential low-rise (1–3 stories); Built in 1974; Concrete block construction; Rear exposure faces west; Unit in Sorrento Villas development
- Construction: Concrete block construction; Shingle roof; Stucco finish; Built in 1974; Corner unit
- Exterior features: Stucco exterior; Shingle roof; Single hung windows; Landscaped area view; Pool/club view; Central irrigation; Zero lot line; Corner building
Interior
- Kitchen: Cooktop; Range; Self-cleaning oven; Microwave; Dishwasher; Garbage disposal; Refrigerator
- Bedrooms: 2 bedrooms
- Flooring: Tile
- Bathrooms: 2 full bathrooms; Master bathroom with shower (no tub)
- Heating & cooling: Central electric heat; Central electric cooling; Ceiling fans
- Interior features: Built-in cabinets; Cable prewire; Smoke detectors; Window coverings; Eat-in kitchen; Great room floor plan; Screened lanai/porch; Guest bath; Guest room; Laundry in residence; Storage
- Laundry & utility: Washer; Dryer
Neighborhood map
What this means for you Summary
Snapshot
- This is a 2-bed/2.0-bath condo listed at $247k.
Deal economics
- At list price, monthly cash flow is $169 ($2k/yr) — positive.
- The deal already cash-flows at list — no discount required.
- Meets the 1% rule at list price ($3k rent vs $247k).
Location & tenants
- Location reads 80/100 on livability (#126 in FL, #1,903 nationally) — a professional / high-income tenant draw. Strengths: crime A+, amenities A+, employment A+; Watch: commute D+, cost of living F.
- Collier (suburban): math 60% / reading 56% proficiency, ranked #16 of 73 in FL (top 22%) — acceptable for families but not a draw, mixed tenant base, ~2y average lease.
- Zoned schools: Sea Gate Elementary School (math 86% / reading 81%, grade A+, #60 of 2,144 statewide, top 3%, 703 students, 26% FRL); Naples High School (math 47% / reading 52%, grade D, #179 of 667 statewide, top 29%, 1,719 students, 39% FRL) — zoned schools average 32% FRL vs 55% district-wide (23 pts lower); this property's tenant base skews higher-income than the district average.
- Market conditions: Rents rising fast (+14.6%/yr); 480 active listings in the ZIP; 32 comparable units currently listed for rent nearby; rentals at typical pace (median 15d on market — plan ~3-4 weeks tenant-placement turnaround); high-income renter base; 3,520 units permitted in Collier County in 2024 (959 in 5+ unit buildings).
- This rent runs 35% of the median local income ($117k/yr) — at the standard rent-burdened threshold; future hikes will face affordability resistance.
Forward outlook
- Local home prices are declining (-3.0%/yr); year-one equity from $2k of loan paydown is wiped out by about $7k of value loss. Plan a longer hold.
- Collier County population projected at +30% by 2050 — long-run rental-demand tailwind backs the buy-and-hold thesis.
- At projected returns (-3.0% appreciation + 8.0% rent growth), your $69k cash investment doubles in ~9 years — after that, you're playing with house money.
Negotiation context
- Only 10 days on market — expect competitive offers; lowballing is unlikely to land.
- 10 sale attempts since 14y ago with the ask held roughly flat each time — persistent listings suggest the price (not the market) is what's stuck; bring a comps-based counter.
- Current owner paid $97k; list at $247k implies a 155% gain — meaningful room to come down on a strong offer.
Risks & watch-outs
- Watch-outs: flood insurance adds $152/mo; HOA is 24% of rent.
- Climate carrying-cost: in FEMA flood zone AH (mandatory federal flood insurance); severe wind risk, 99% chance of damaging wind over 30y; extreme-heat days projected 7→28/yr by 2055 (HVAC capex compounding) — expect insurance premiums to compound above CPI over the hold.
Questions for the listing agent
- Built in 1974 — when were the roof, HVAC, electrical panel, plumbing, and water heater last replaced?
- What's the actual annual flood-insurance premium (NFIP or private), and is the property in a SFHA with mandatory coverage?
- What does the HOA fee cover, when was the last increase, and are there any pending special assessments or reserve-fund shortfalls?
- Any open or pending special assessments — roof, HVAC, plumbing, elevator, façade? What's the per-unit balance and payoff schedule, and is the seller paying it off at close or rolling it to the buyer?
- Is there a deadline driving the sale (1031 exchange, divorce, estate, relocation)? That informs how much negotiation room exists.
- Schools are B-rated — typically a magnet for longer-tenancy family renters. What's the average tenant stay here, and is there a school-zone premium baked into asking?
- What's the average days-on-market for RENTAL listings here right now (not sales)? A rising rental-DOM trend means longer vacancies and softer asking-rent achievability than the comps imply.
- What's the recent tenant-quality profile in this submarket — average credit score on applications, eviction rate, late-payment / NSF rate, and stable-employment percentage? A property-management company in the area should have these aggregated.
- How much new apartment / multifamily construction is in the pipeline within 1–3 miles? Heavy new supply (>2% of stock underway) typically softens rents 12–24 months out; light construction supports rent growth.
Investment metrics
- 1% rule
- 1.38% ✓
- Cap rate
- 7.85%
- Cash-on-cash
- 5.56%
- DSCR
- 1.25
- GRM
- 6.0
CMA / ARV
No comps found within radius.
Projected returns pro-forma
-3.0% appreciation · 8.0% rent growth · sell at horizon
- IRR
- -3.8%
- Equity multiple
- 0.85×
- Total profit
- $-10,658
- Equity at exit
- $36,829
- IRR
- 12.4%
- Equity multiple
- 2.29×
- Total profit
- $89,060
- Equity at exit
- $21,356
Cash invested: $69,160 (down + closing). Projections, not guarantees.
Landlord ↔ Tenant lean methodology
- Overall (STATE)
- 87 Strongly Landlord-Friendly
- State Florida
- 87 Strongly Landlord-Friendly · R+3
- County
- — inherits STATE
- City
- — inherits STATE
ZIP-level market 34103
- Rents YoY
- 14.6%
- Active inventory
- 480
- Price-to-rent
- 6.0×
Monthly cashflow live
- Estimated rent
- $3,419 high interval (Pro) →
- Mortgage (P&I)
- −$1,295
- Tax from tax record
- −$149 /mo · $1,792/yr
- Insurance
- −$103
- Flood insurance flood zone
- −$152 /mo · $1,824/yr
- HOA
- −$833
- Vacancy / Maint / Mgmt
- −$718
- Net cashflow
- $169
Break-even live
Sensitivity live
| Price | -10% $308 | -5% $239 | +0% $169 | +5% $99 | +10% $29 |
|---|---|---|---|---|---|
| Rent | -10% $-102 | -5% $34 | +0% $169 | +5% $304 | +10% $439 |
| Rate | -1.0pp $293 | -0.5pp $231 | base $169 | +0.5pp $105 | +1.0pp $39 |
UW: 25.0% down · 7.5% · 30yr · 1.5% tax · 5.0% vac · 8.0% maint · 8.0% mgmt
Financing live
Cash to close
- Down payment
- $61,750
- Closing costs
- $7,410
- Reserves months
- —
- Total cash needed
- —
Loan-product check · same deal, 3 products live
Conventional
25% down · 7.5% · 30yr
- Down + closing
- —
- Monthly P&I
- —
- Monthly cashflow
- —
- DSCR
- —
- Eligible?
- —
Personal DTI + credit; lowest rate.
DSCR
20% down · 8.5% · 30yr
- Down + closing
- —
- Monthly P&I
- —
- Monthly cashflow
- —
- DSCR
- —
- Eligible?
- —
No personal income docs; deal must DSCR.
Hard money
10% down · 12.0% · 12mo
- Down + closing
- —
- Monthly P&I
- —
- Monthly cashflow
- —
- DSCR
- —
- Eligible?
- —
Short-term bridge; refi at stabilization.
Rent comps 32 comps
| Address | Beds | Baths | Sqft | Rent | $/sqft | DOM | Units | Dist |
|---|---|---|---|---|---|---|---|---|
| 1400 Pompei Ln Unit S-21 Naples, FL | 2.0 | 2.0 | 1025 | $3,000 | $2.93 | 24d | 1 | 0.05mi |
| 1400 Pompei Ln Unit O-21 Naples, FL | 2.0 | 2.0 | 1025 | $2,200 | $2.15 | 24d | 1 | 0.05mi |
| 1400 Pompei Ln Naples, FL | 2.0 | 2.0 | 1012 | $1,888 | $1.86 | 24d | 2 | 0.06mi |
| 1100 Pine Ridge Rd Naples, FL | 1.0 | 1.0 | 868 | $2,125 | $2.45 | 15d | 3 | 0.34mi |
| 5934 Premier Way Naples, FL | 1.0–3.0 | 1.0–3.0 | 1350 | $3,618 | $2.68 | 15d | 29 | 0.43mi |
| 4525 Fluvia Ave Naples, FL | 2.0 | 1.0 | 1050 | $5,500 | $5.24 | 24d | 1 | 0.44mi |
| 4523 Fluvia Ave Naples, FL | 2.0 | 1.0 | 1050 | $5,500 | $5.24 | 24d | 1 | 0.44mi |
| 1085 Forest Lakes Dr Unit 8202 Naples, FL | 2.0 | 2.0 | 1086 | $2,800 | $2.58 | 15d | 1 | 0.69mi |
| 1085 Forest Lakes Dr Unit 8305 Naples, FL | 1.0 | 1.0 | 766 | $3,000 | $3.92 | 15d | 1 | 0.69mi |
| 1085 Forest Lakes Dr Unit 8106 Naples, FL | 2.0 | 2.0 | 1000 | $1,900 | $1.90 | 15d | 1 | 0.69mi |
| 1086 Forest Lakes Dr Unit 9303 Naples, FL | 2.0 | 2.0 | 1000 | $2,395 | $2.40 | 15d | 1 | 0.70mi |
| 287 Quail Forest Blvd #117 Naples, FL | 2.0 | 2.0 | 993 | $1,995 | $2.01 | 22d | 1 | 0.78mi |
| 287 Quail Forest Blvd #117 Naples, FL | 2.0 | 2.0 | 993 | $1,695 | $1.71 | 15d | 1 | 0.78mi |
| 260 Quail Forest Blvd Naples, FL | 1.0–2.0 | 1.0–2.0 | 875 | $2,533 | $2.89 | 15d | 22 | 0.82mi |
| 170 Turtle Lake Ct Naples, FL | 2.0 | 2.0 | 842 | $2,975 | $3.53 | 15d | 1 | 0.90mi |
| 180 Turtle Lake Ct #102 Naples, FL | 2.0 | 2.0 | 842 | $1,850 | $2.20 | 22d | 1 | 0.90mi |
| 100 Forest Lakes Blvd Naples, FL | 1.0–2.0 | 2.0 | 842 | $3,500 | $4.16 | 15d | 3 | 0.90mi |
| 600 Neapolitan Way Naples, FL | 1.0–2.0 | 2.0 | 832 | $5,200 | $6.25 | 24d | 2 | 0.90mi |
| 150 Turtle Lake Ct #307 Naples, FL | 1.0 | 1.0 | 638 | $1,500 | $2.35 | 24d | 1 | 0.93mi |
| 190 Turtle Lake Ct Unit 6 Naples, FL | 2.0 | 2.0 | 842 | $2,100 | $2.49 | 15d | 1 | 0.94mi |
| 200 Turtle Lake Ct #109 Naples, FL | 2.0 | 2.0 | 842 | $1,295 | $1.54 | 24d | 1 | 0.95mi |
| 225 Turtle Lake Ct Naples, FL | 1.0–2.0 | 1.0–2.0 | 740 | $1,900 | $2.57 | 24d | 2 | 0.96mi |
| 175 Turtle Lake Ct Naples, FL | 1.0–2.0 | 1.0–2.0 | 740 | $1,650 | $2.23 | 15d | 2 | 0.97mi |
| 200 Forest Lakes Blvd #111 Naples, FL | 2.0 | 2.0 | 842 | $3,100 | $3.68 | 15d | 1 | 1.05mi |
| 499 Forest Lakes Blvd #105 Naples, FL | 2.0 | 2.0 | 919 | $1,950 | $2.12 | 15d | 1 | 1.07mi |
| 300 Forest Lakes Blvd Naples, FL | 2.0 | 2.0 | 842 | $2,700 | $3.21 | 24d | 2 | 1.12mi |
| 400 Forest Lakes Blvd Naples, FL | 2.0 | 2.0 | 842 | $2,350 | $2.79 | 22d | 4 | 1.20mi |
| 501 Forest Lakes Blvd #111 Naples, FL | 2.0 | 2.0 | 919 | $2,300 | $2.50 | 15d | 1 | 1.20mi |
| 1545 Oyster Catcher Pt Unit A Naples, FL | 2.0 | 2.0 | 1124 | $2,200 | $1.96 | 15d | 1 | 1.26mi |
| 301 Ridge Dr Naples, FL | 2.0 | 2.0 | 900 | $6,000 | $6.67 | 24d | 1 | 1.29mi |
| 1554 Oyster Catcher Pt Unit C Naples, FL | 2.0 | 2.0 | 1124 | $2,900 | $2.58 | 24d | 1 | 1.29mi |
| 788 Park Shore Dr Naples, FL | 1.0–2.0 | 1.5–2.0 | 931 | $5,500 | $5.90 | 14d | 3 | 1.33mi |
HOA detail condo
- Monthly dues
- $833 · $9,996/yr
- Likely covers
- pool
- Assessments
- None detected in remarks — confirm with the listing agent.
Listing history 7 events
-
2026-06-21days on market $247,000 Active 10 DOM
-
2026-06-18days on market $247,000 Active 7 DOM
-
2026-06-17days on market $247,000 Active 6 DOM
-
2026-06-16days on market $247,000 Active 5 DOM
-
2026-06-15days on market $247,000 Active 4 DOM
-
2026-06-14remarks 699-char remark
-
2026-06-14$247,000 Active 2 DOM
ⓘ Source: listings_history table (triggers on properties + properties_extension) + one-shot
backfill from property_details.listing_events for pre-trigger history.
Tax reassessment forecast FL · Resets to sale price
- Current annual tax
- $1,792 · $149/mo
- Projected year-2 tax
- $2,050 · $171/mo
- Expected delta
- +$258/yr (+$22/mo · 14.4%)
ⓘ Screening estimate from a state-policy table — verify with the county assessor before closing.
Climate risk First Street
- Flood 5/10 Major FEMA zone AH · 23% chance over 30 yrs
- Wildfire 1/10 Low
- Heat 10/10 Extreme 7 d/yr ≥107°F today · 28 d/yr by 30 yrs out
- Wind 10/10 Extreme 99% chance of damaging wind over 30 yrs
- Air quality 2/10 Low 2 unhealthy d/yr today · 2 by 30 yrs out
Nearby sold comps map
Loading sold comps map…
Walkable amenities ~0.75 mi
Loading nearby amenities…
Taxation est. · year 1
- Rental income
- $41,031
- − Mortgage interest
- −$13,836
- − Property taxes
- −$1,792
- − Insurance
- −$3,060
- − Repairs & maintenance
- −$3,282
- − Management
- −$3,282
- − HOA
- −$9,996
- − Depreciation
- −$7,185
- Taxable loss
- −$1,403
- Est. tax savings @ 24.0%
- +$337
- After-tax cash flow
- $2,360/yr
For passive investors: Depreciation is non-cash, so a rental often shows a tax loss while cash-flowing — sheltering income. Rental losses are passive: they offset passive income freely, and up to $25,000/yr can offset ordinary (W-2) income if you actively participate and your MAGI is under $100k (phasing out to $0 by $150k); unused losses carry forward. On sale, claimed depreciation is recaptured at up to 25%, and gains may owe capital-gains tax (a 1031 exchange can defer both). Figures are a year-1 estimate at your 24.0% rate — not tax advice; consult a CPA.
Schools (NCES district)
- District
- Collier
- NCES district ID
- 1200330
- Math proficiency
- 60% ▼ -4.00%
- Reading proficiency
- 56% ▼ -2.00%
- Median HH income
- $58,275
- Composite
- 50.23/100
- National rank
- #1892
- State rank
- #16 of 73 in FL
Livability — Naples
- Score
- 80/100
- State rank
- #126
- US rank
- #1903
Category grades
Schools grade is shown separately in the Schools card above.
Census & demographics
- County
- Collier County · 396,295 people
- City population
- 344,941
- Metro
- Naples-Marco Island, FL
- Population (ZIP)
- 11,299
- Household income
- $116,875
- Rent vs Own
- Severe rent burden
- 311.0
Population outlook (Collier County) Hauer SSP2
- Today (2025)
- 420,858 people
- By 2030
- 450,054 · +6.9%
- By 2040
- 502,232 · +19.3%
- By 2050
- 544,932 · +29.5%
- By 2075
- 627,203 · +49.0%
- By 2100
- 659,015 · +56.6%
Race, ethnicity, and origin ACS 2023
- Neighborhood character
- Predominantly White (87%)
- Race & ethnicity
- White 87% Hispanic / Latino 10% Two or more races 8% Asian 1%
- Hispanic origin (detail)
- Common ancestry
- Romanian 4% Lithuanian 2% Portuguese 2%
- Foreign-born
- 13% · Canada
- Languages at home
- 87% English-only · Spanish 9% Other Indo-European 2% German/W. Germanic 1%
Political lean MEDSL · Collier
- 2024 margin
- Solid R (+33.1) · D 33.1% · R 66.2%
- 2008→2024 swing
- -10.6pp toward R · 2008: -22.5pp · 2024: -33.1pp
- All cycles
- 2024: R+33.1 2020: R+24.7 2016: R+26.0 2012: R+30.1 2008: R+22.5
Not yet ingested
- Civics
- —
Market trends
- HPI YoY
- ▼ -327.53%
- Current HPI
- 315.1396
- Rent YoY
- ▲ 14.55%
- Metro
- Naples-Marco Island, FL
- State GDP YoY
- ▲ 3.28%
- F500 in state
- 36
Industry mix (Fortune 500 HQ in FL)
| Industry | F500 HQs | Revenue |
|---|---|---|
| Industrial Technology | 2 | $29B |
|
||
| Insurance | 2 | $17B |
|
||
| Retail | 1 | $60B |
|
||
| Technology Distribution | 1 | $58B |
|
||
| Homebuilding | 1 | $35B |
|
||
| Technology Manufacturing | 1 | $35B |
|
||
Price history
+414.6% since first listed28 events — show timeline
- 2026-06-11 Listed $247,000 NAPLESMLS
- 2025-08-28 Listing Removed — NAPLESMLS
- 2025-08-10 Rental Removed $1,650 APPFOLIO
- 2025-08-01 Listed for Rent $1,650 APPFOLIO
- 2025-08-01 Rental Removed $1,650 NAPLESMLS
- 2025-07-30 Listed $247,000 NAPLESMLS
- 2025-07-16 Rental Removed $1,650 APPFOLIO
- 2025-07-16 Price Changed $1,650 NAPLESMLS
- 2025-07-16 Listed for Rent $1,700 APPFOLIO
- 2025-06-14 Price Changed $1,700 NAPLESMLS
- 2025-05-21 Price Changed $1,750 NAPLESMLS
- 2025-05-21 Rental Removed $1,800 APPFOLIO
- 2025-05-20 Listed for Rent $1,800 APPFOLIO
- 2025-05-13 Price Changed $1,800 NAPLESMLS
- 2025-05-13 Rental Removed $1,800 APPFOLIO
- 2025-05-08 Listed for Rent $1,800 APPFOLIO
- 2025-03-21 Listed for Rent $1,850 NAPLESMLS
- 2025-03-21 Rental Removed $1,850 APPFOLIO
- 2025-03-21 Price Changed $1,850 APPFOLIO
- 2025-03-07 Listed for Rent $1,900 APPFOLIO
- 2024-03-14 Rental Removed $2,000 APPFOLIO
- 2024-01-18 Price Changed $2,000 APPFOLIO
- 2023-12-07 Listed for Rent $2,100 APPFOLIO
- 2012-06-19 Sold (Public Records) $97,000 Public Records
- 2012-06-15 Sold (MLS) $97,000 NAPLESMLS
- 2012-03-08 Listed $98,777 NAPLESMLS
- 2012-01-03 Sold (Public Records) $35,000 Public Records
- 1983-07-01 Sold (Public Records) $48,000 Public Records
Property tax history
+6.3%/yrLatest (2025): $1,792 · +4.3% YoY. Source: county tax records.
Cash-flow waterfall
monthlySold comps — $/sqft
last 12 mo · ≤1 miLoading sold comps…