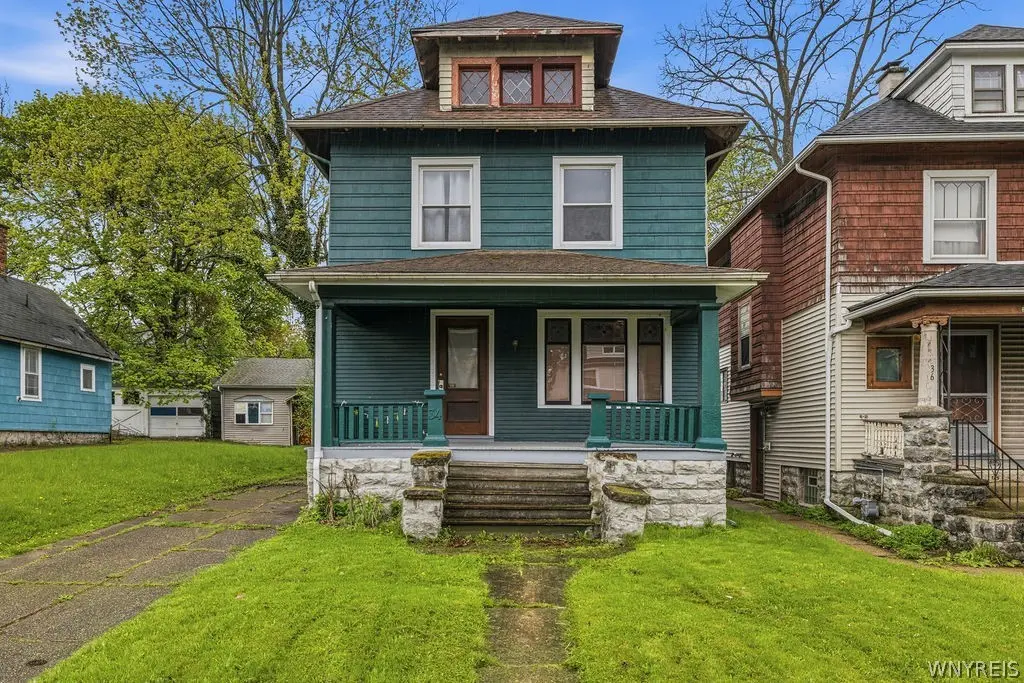
34 Englewood Ave · Buffalo, NY
Flood risk 1/10 · Minimal
- FEMA flood zone
- X (unshaded)
- Chance of flooding over 30 yrs
- 0.0%
- Est. flood insurance / yr
- $473 – $860
Fire risk 1/10 · Minimal
- Est. fire insurance / yr
- $691 – $1,283
Heat risk 3/10 · Minor
- Hot days now (above 92°F)
- 7 days/yr
- Hot days in 30 yrs
- 15 days/yr
Wind risk 1/10 · Minimal
- Chance of severe wind over 30 yrs
- —
Air-quality risk 3/10 · Minor
- Unhealthy air days now
- 2 days/yr
- Unhealthy air days in 30 yrs
- 3 days/yr
Risk factors via First Street. Map © Google.
Why this score? — see what drove the C grade
The composite is a weighted blend of 9 inputs, each scored 0–100. Each bar is that input's sub-score; the figure is the points it added to the 100-point composite (weight × sub-score).
- Cash flow +20.4/30.0
- ARV discount +15.0/15.0
- DSCR +6.5/10.0
- 1% rule +4.1/10.0
- Rent growth +4.0/5.0
- Livability +3.9/5.0
- Schools +3.3/10.0
- Condition / age +2.5/5.0
- Appreciation +0.0/10.0
$209,000
🖨 Deal sheet 📄 Offer letter ✓ Due diligence
Listing remarks
This five bedroom two and a half bath property offers a rare combination of size, functionality, and location, with the added convenience of a 2.5 bath layout that comfortably supports a full house of occupants. Currently operating as a high performing student rental, it is hard to imagine a more strategic setting, positioned directly across from the college and within the first block to the main street, making it one of the most desirable spots for students who value true walkability to campus, shops, and daily essentials. The home features generously sized bedrooms, off street parking, and exceptional storage options including a full attic, basement, and garage, giving tenants the space t
Key facts
- Off street parking
- Garage
- Basement
Tags
Property features AI
Exterior
- Parking: Detached garage; One garage space
- Utilities: Electricity connected; Public water connected; Sewer connected
- Home design: Two-story home; Resale property; Existing construction
- Construction: Frame construction; Stone foundation
- Exterior features: Concrete driveway; Open porch
Interior
- Kitchen: Electric oven; Electric range; Refrigerator
- Bedrooms: One main-level bedroom
- Flooring: Hardwood; Tile; Varies
- Bathrooms: Two full bathrooms; One half bathroom; Two main-level bathrooms
- Heating & cooling: Gas forced-air heating; Heating present
- Interior features: Living/dining room; Bedroom on main level; Full basement
- Laundry & utility: Gas water heater
Neighborhood map
What this means for you Summary
Snapshot
- This is a 4-bed/1.0-bath single-family listed at $209k.
Deal economics
- At list price, monthly cash flow is $270 ($3k/yr) — positive.
- The deal already cash-flows at list — no discount required.
- To meet the 1% rule (rent ≥ 1% of price), the offer needs to be $191k (8.6% below list).
- Recommended offer: $191k (8.6% below list) — sets the bar for 1% rule.
Location & tenants
- Location reads 77/100 on livability (#195 in NY, #3,011 nationally) — a middle-class / working-renter tenant base. Strengths: commute A+, housing A+, health & safety A+; Watch: crime F, employment D-.
- Buffalo City School District (urban): math 41% / reading 40% proficiency, ranked #535 of 590 in NY (top 91%) — families likely to look elsewhere, expect single-tenant / working-renter base with shorter leases; 75% free/reduced lunch — lower-income household profile, screen leases tightly.
- Market conditions: Rents rising fast (+5.8%/yr); 90 active listings in the ZIP; 20 comparable units currently listed for rent nearby; rentals at typical pace (median 15d on market — plan ~3-4 weeks tenant-placement turnaround); 1,244 units permitted in Erie County in 2024 (563 in 5+ unit buildings).
- This rent runs 39% of the median local income ($58k/yr) — at the standard rent-burdened threshold; future hikes will face affordability resistance.
Forward outlook
- Local home prices are declining (-3.0%/yr); year-one equity from $1k of loan paydown is wiped out by about $6k of value loss. Plan a longer hold.
Negotiation context
- It's been on market 17 days — a 2% lower offer ($206k) is reasonable based on typical stale-listing flexibility.
- 2 sale attempts with the ask held roughly flat each time — persistent listings suggest the price (not the market) is what's stuck; bring a comps-based counter.
Risks & watch-outs
- Watch-outs: built in 1910 — expect roof / HVAC / electrical / plumbing capex.
Questions for the listing agent
- Built in 1910 — when were the roof, HVAC, electrical panel, plumbing, and water heater last replaced?
- Is there a deadline driving the sale (1031 exchange, divorce, estate, relocation)? That informs how much negotiation room exists.
- Crime grade is F in this area — have there been break-ins, vandalism, or insurance claims at this property in the last 3 years? What carrier currently insures it and at what premium?
- What's the average days-on-market for RENTAL listings here right now (not sales)? A rising rental-DOM trend means longer vacancies and softer asking-rent achievability than the comps imply.
- What's the recent tenant-quality profile in this submarket — average credit score on applications, eviction rate, late-payment / NSF rate, and stable-employment percentage? A property-management company in the area should have these aggregated.
- How much new for-sale + rental construction is in the pipeline within 1–3 miles? Heavy new supply typically softens prices + rents 12–24 months out; constrained supply supports both.
Investment metrics
- 1% rule
- 0.91% ✗
- Cap rate
- 7.84%
- Cash-on-cash
- 5.54%
- DSCR
- 1.25
- GRM
- 9.1
CMA / ARV
- ARV (median comp)
- $271,374
- List price
- $209,000
- Delta
- -22.98%
- Verdict
- UNDERPRICED
- Comps
- 20 within 1.0 mi
Show comp detail 12 sales within ~0.75 mi
| Address | Dist | Beds/Ba | Sqft | Sold | Price | $/sf | Match |
|---|---|---|---|---|---|---|---|
| 71 Merrimac St | 0.12mi | 3/1.0 (-1) | 1,404 (-2%) | 5mo | $129,999 | $93 | 83 |
| 142 Englewood Ave | 0.20mi | 5/1.5 (+1) | 1,504 (+6%) | 4mo | $215,000 | $143 | 71 |
| 133 Allenhurst Rd | 0.44mi | 3/1.5 (-1) | 1,410 (-1%) | 1mo | $332,800 | $236 | 70 |
| 73 Springville Ave | 0.70mi | 4/2.0 | 1,425 (-0%) | 4mo | $235,000 | $165 | 60 |
| 32 Wellington Ave | 0.65mi | 3/1.5 (-1) | 1,482 (+4%) | 1mo | $272,000 | $184 | 55 |
| 32 Parkside Ct | 0.52mi | 3/1.5 (-1) | 1,292 (-9%) | 1mo | $350,000 | $271 | 52 |
| 41 Fairfield Ave | 0.72mi | 3/1.5 (-1) | 1,384 (-3%) | 4mo | $197,500 | $143 | 51 |
| 176 Lasalle Ave | 0.51mi | 4/2.0 | 1,601 (+12%) | 2mo | $270,000 | $169 | 50 |
| 253 Winspear Ave | 0.51mi | 4/2.0 | 1,584 (+11%) | 6mo | $315,100 | $199 | 49 |
| 58 Grandview Ave | 0.45mi | 3/1.0 (-1) | 1,638 (+15%) | 0mo | $251,000 | $153 | 49 |
| 29 Parkhurst Blvd | 0.55mi | 3/1.5 (-1) | 1,289 (-10%) | 6mo | $165,000 | $128 | 47 |
| 347 Lisbon Ave | 0.65mi | 3/1.5 (-1) | 1,558 (+9%) | 3mo | $180,000 | $116 | 44 |
Match score weights: distance 35% · size 25% · config 20% · recency 20%. Top-matched comps best support the ARV.
Projected returns pro-forma
-3.0% appreciation · 5.81% rent growth · sell at horizon
- IRR
- -5.0%
- Equity multiple
- 0.81×
- Total profit
- $-11,200
- Equity at exit
- $31,163
- IRR
- 7.4%
- Equity multiple
- 1.62×
- Total profit
- $36,144
- Equity at exit
- $18,071
Cash invested: $58,520 (down + closing). Projections, not guarantees.
Landlord ↔ Tenant lean methodology
- Overall (STATE)
- 15 Strongly Tenant-Friendly
- State New York
- 15 Strongly Tenant-Friendly · D+10
- County
- — inherits STATE
- City
- — inherits STATE
ZIP-level market 14214
- Rents YoY
- 5.8%
- Active inventory
- 90
- Price-to-rent
- 9.1×
Monthly cashflow live
- Estimated rent
- $1,909 high interval (Pro) →
- Mortgage (P&I)
- −$1,096
- Tax from tax record
- −$55 /mo · $660/yr
- Insurance
- −$87
- HOA
- −$0
- Vacancy / Maint / Mgmt
- −$401
- Net cashflow
- $270
Break-even live
UW: 25.0% down · 7.5% · 30yr · 1.5% tax · 5.0% vac · 8.0% maint · 8.0% mgmt
Financing live
Cash to close
- Down payment
- $52,250
- Closing costs
- $6,270
- Reserves months
- —
- Total cash needed
- —
Loan-product check · same deal, 3 products live
Conventional
25% down · 7.5% · 30yr
- Down + closing
- —
- Monthly P&I
- —
- Monthly cashflow
- —
- DSCR
- —
- Eligible?
- —
Personal DTI + credit; lowest rate.
DSCR
20% down · 8.5% · 30yr
- Down + closing
- —
- Monthly P&I
- —
- Monthly cashflow
- —
- DSCR
- —
- Eligible?
- —
No personal income docs; deal must DSCR.
Hard money
10% down · 12.0% · 12mo
- Down + closing
- —
- Monthly P&I
- —
- Monthly cashflow
- —
- DSCR
- —
- Eligible?
- —
Short-term bridge; refi at stabilization.
Rent comps 20 comps
| Address | Beds | Baths | Sqft | Rent | $/sqft | DOM | Units | Dist |
|---|---|---|---|---|---|---|---|---|
| 60 Englewood Ave Buffalo, NY | 4.0 | 1.0 | 1400 | $1,650 | $1.18 | 1d | 1 | 0.08mi |
| 65 Northrup Pl Buffalo, NY | 5.0 | 2.0 | 1467 | $2,500 | $1.70 | 14d | 1 | 0.23mi |
| 222 Lisbon Ave Unit Upper Buffalo, NY | 3.0 | 1.0 | 1400 | $1,400 | $1.00 | 44d | 1 | 0.43mi |
| 222 Lisbon Ave Buffalo, NY | 4.0 | 1.0 | 1300 | $1,400 | $1.08 | 23d | 1 | 0.43mi |
| 265 Lisbon Ave Unit 2 Buffalo, NY | 3.0 | 1.0 | 1200 | $1,400 | $1.17 | 44d | 1 | 0.51mi |
| 263 Minnesota Ave Unit Upper Buffalo, NY | 3.0 | 1.0 | 1242 | $1,500 | $1.21 | 14d | 1 | 0.54mi |
| 89 Lasalle Ave Buffalo, NY | 1.0–4.0 | 1.0–4.0 | 1024 | $2,997 | $2.93 | 1d | 10 | 0.54mi |
| 163 Carmel Rd Buffalo, NY | 3.0 | 1.0 | 1400 | $1,800 | $1.29 | 3d | 1 | 0.63mi |
| 33 Tillotson Pl Buffalo, NY | 3.0 | 1.0 | 1143 | $2,095 | $1.83 | 14d | 1 | 0.69mi |
| 91 Springville Ave Buffalo, NY | 4.0 | 2.0 | 1660 | $2,350 | $1.42 | 23d | 1 | 0.74mi |
| 348 Capen Blvd Buffalo, NY | 3.0 | 1.5 | 1424 | $2,200 | $1.54 | 1d | 1 | 0.91mi |
| 524 University Ave Buffalo, NY | 3.0 | 1.0 | 1840 | $1,600 | $0.87 | 1d | 1 | 0.95mi |
| 140 Parkridge Ave Buffalo, NY | 3.0 | 1.0 | 990 | $1,500 | $1.52 | 44d | 1 | 1.00mi |
| 189 Westminster Ave Buffalo, NY | 4.0 | 1.5 | 1065 | $1,595 | $1.50 | 10d | 1 | 1.21mi |
| 414 Taunton Pl Unit Lowet Buffalo, NY | 3.0 | 1.0 | 1232 | $1,700 | $1.38 | 14d | 1 | 1.22mi |
| 76 Vernon Pl Unit Lower Buffalo, NY | 3.0 | 1.0 | 1190 | $1,445 | $1.21 | 14d | 1 | 1.29mi |
| 76 Vernon Pl Unit Upper Buffalo, NY | 3.0 | 1.0 | 1190 | $1,595 | $1.34 | 14d | 1 | 1.29mi |
| 151 Lamson Rd Buffalo, NY | 4.0 | 2.0 | 1382 | $2,350 | $1.70 | 17d | 1 | 1.32mi |
| 97 Davidson Ave Buffalo, NY | 3.0 | 1.0 | 925 | $1,495 | $1.62 | 1d | 1 | 1.34mi |
| 307 Sterling Ave Buffalo, NY | 3.0 | 1.0 | 1632 | $1,800 | $1.10 | 3d | 1 | 1.41mi |
Listing history 13 events
-
2026-06-18days on market $209,000 Active 17 DOM
-
2026-06-17days on market $209,000 Active 16 DOM
-
2026-06-16days on market $209,000 Active 15 DOM
-
2026-06-15days on market $209,000 Active 14 DOM
-
2026-06-13days on market $209,000 Active 12 DOM
-
2026-06-13days on market $209,000 Active 11 DOM
-
2026-06-10days on market $209,000 Active 9 DOM
-
2026-06-09days on market $209,000 Active 8 DOM
-
2026-06-08days on market $209,000 Active 7 DOM
-
2026-06-07days on market $209,000 Active 6 DOM
-
2026-06-03days on market $209,000 Active 2 DOM
-
2026-06-02days on market $209,000 Active 1 DOM
-
2026-05-04$209,000 Active 1211-char remark
ⓘ Source: listings_history table (triggers on properties + properties_extension) + one-shot
backfill from property_details.listing_events for pre-trigger history.
Tax reassessment forecast NY · Partial reset (capped growth)
- Current annual tax
- $660 · $55/mo
- Projected year-2 tax
- $2,096 · $175/mo
- Expected delta
- +$1,436/yr (+$120/mo · 217.4%)
ⓘ Screening estimate from a state-policy table — verify with the county assessor before closing.
Climate risk First Street
- Flood 1/10 Low FEMA zone X (unshaded) · 0% chance over 30 yrs
- Wildfire 1/10 Low
- Heat 3/10 Moderate 7 d/yr ≥92°F today · 15 d/yr by 30 yrs out
- Wind 1/10 Low
- Air quality 3/10 Moderate 2 unhealthy d/yr today · 3 by 30 yrs out
Nearby sold comps map
Loading sold comps map…
Walkable amenities ~0.75 mi
Loading nearby amenities…
Taxation est. · year 1
- Rental income
- $22,913
- − Mortgage interest
- −$11,707
- − Property taxes
- −$660
- − Insurance
- −$1,045
- − Repairs & maintenance
- −$1,833
- − Management
- −$1,833
- − Depreciation
- −$6,080
- Taxable loss
- −$246
- Est. tax savings @ 24.0%
- +$59
- After-tax cash flow
- $3,303/yr
For passive investors: Depreciation is non-cash, so a rental often shows a tax loss while cash-flowing — sheltering income. Rental losses are passive: they offset passive income freely, and up to $25,000/yr can offset ordinary (W-2) income if you actively participate and your MAGI is under $100k (phasing out to $0 by $150k); unused losses carry forward. On sale, claimed depreciation is recaptured at up to 25%, and gains may owe capital-gains tax (a 1031 exchange can defer both). Figures are a year-1 estimate at your 24.0% rate — not tax advice; consult a CPA.
Schools (NCES district)
- District
- Buffalo City School District
- NCES district ID
- 3605850
- Math proficiency
- 41% ▲ 11.00%
- Reading proficiency
- 40% ▲ 7.00%
- Median HH income
- $31,665
- Composite
- 33.17/100
- National rank
- #5544
- State rank
- #535 of 590 in NY
Livability — Buffalo
- Score
- 77/100
- State rank
- #195
- US rank
- #3011
Category grades
Schools grade is shown separately in the Schools card above.
Census & demographics
- Census place
- Buffalo, NY
- County
- Erie County · 714,559 people
- City population
- 440,021
- Metro
- Buffalo-Cheektowaga, NY
- Population (ZIP)
- 21,314
- Household income
- $58,228
- Rent vs Own
- Severe rent burden
- 1820.0
Population outlook (Erie County) Hauer SSP2
- Today (2025)
- 933,037 people
- By 2030
- 935,181 · +0.2%
- By 2040
- 928,531 · -0.5%
- By 2050
- 905,725 · -2.9%
- By 2075
- 834,037 · -10.6%
- By 2100
- 708,033 · -24.1%
Race, ethnicity, and origin ACS 2023
- Neighborhood character
- Diverse neighborhood (Simpson 0.67)
- Race & ethnicity
- White 47% Black 31% Asian 11% Hispanic / Latino 7% Two or more races 6%
- Hispanic origin (detail)
- Puerto Rican 3%
- Common ancestry
- Romanian 5% Lithuanian 2% Scotch-Irish 1%
- Foreign-born
- 14% · Canada, China
- Languages at home
- 81% English-only · Other Indo-European 7% Spanish 4% Other Asian/Pacific 1%
Political lean MEDSL · Erie
- 2024 margin
- Lean D (+9.7) · D 54.8% · R 45.2%
- 2008→2024 swing
- -7.9pp toward R · 2008: 17.5pp · 2024: 9.7pp
- All cycles
- 2024: D+9.7 2020: D+14.7 2016: D+4.8 2012: D+15.6 2008: D+17.5
Not yet ingested
- Civics
- —
Market trends
- HPI YoY
- ▼ -282.52%
- Current HPI
- 373.377
- Rent YoY
- ▲ 5.81%
- Metro
- Buffalo-Cheektowaga, NY
- State GDP YoY
- ▲ 2.60%
- F500 in state
- 92
Industry mix (Fortune 500 HQ in NY)
| Industry | F500 HQs | Revenue |
|---|---|---|
| Financial Services | 10 | $950B |
|
||
| Consumer Goods | 9 | $162B |
|
||
| Insurance | 4 | $225B |
|
||
| Telecommunications | 2 | $144B |
|
||
| Pharmaceuticals | 2 | $112B |
|
||
| Media / Entertainment | 2 | $69B |
|
||
Price history
+0.0% since first listed3 events — show timeline
- 2026-06-01 Listed $209,000 WNYREIS
- 2026-05-30 Listing Removed — WNYREIS
- 2026-05-04 Listed $209,000 WNYREIS
Property tax history
+8.0%/yrLatest (2025): $660 · +2.5% YoY. Source: county tax records.
Cash-flow waterfall
monthlySold comps — $/sqft
last 12 mo · ≤1 miLoading sold comps…