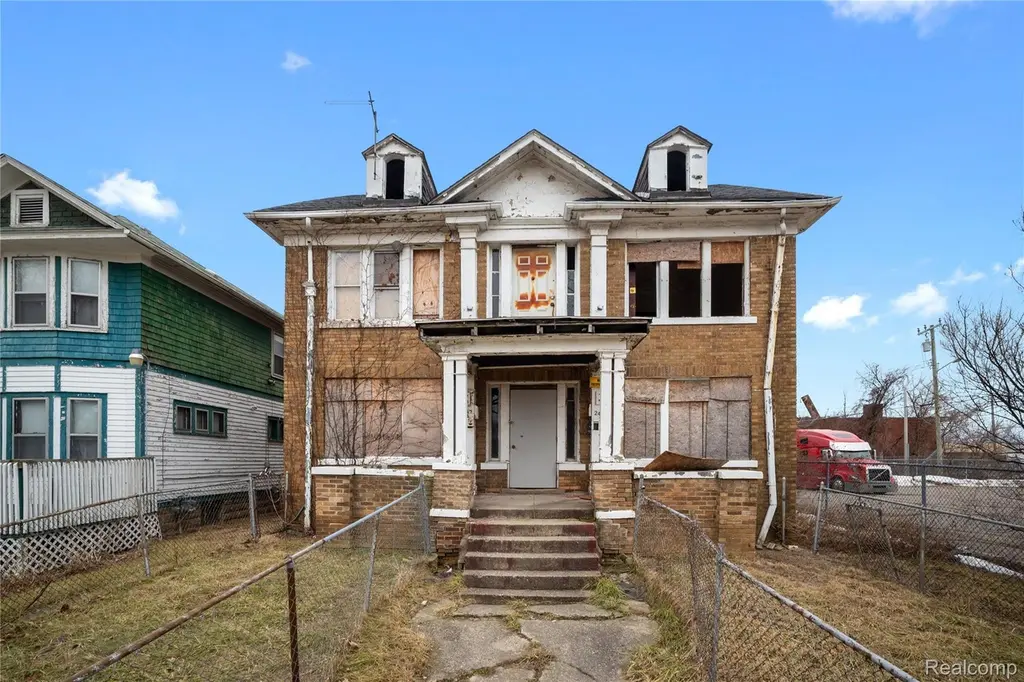
247 Midland St · Highland Park, MI
Flood risk 1/10 · Minimal
- FEMA flood zone
- X (unshaded)
- Chance of flooding over 30 yrs
- 0.0%
- Est. flood insurance / yr
- $473 – $860
Fire risk 1/10 · Minimal
- Est. fire insurance / yr
- $784 – $1,456
Heat risk 3/10 · Minor
- Hot days now (above 97°F)
- 7 days/yr
- Hot days in 30 yrs
- 15 days/yr
Wind risk 2/10 · Minimal
- Chance of severe wind over 30 yrs
- —
Air-quality risk 4/10 · Minor
- Unhealthy air days now
- 4 days/yr
- Unhealthy air days in 30 yrs
- 6 days/yr
Risk factors via First Street. Map © Google.
Why this score? — see what drove the B+ grade
The composite is a weighted blend of 9 inputs, each scored 0–100. Each bar is that input's sub-score; the figure is the points it added to the 100-point composite (weight × sub-score).
- Cash flow +30.0/30.0
- ARV discount +15.0/15.0
- 1% rule +10.0/10.0
- DSCR +10.0/10.0
- Schools +5.0/10.0
- Livability +3.7/5.0
- Rent growth +2.5/5.0
- Condition / age +2.5/5.0
- Appreciation +0.0/10.0
$40,000
🖨 Deal sheet 📄 Offer letter ✓ Due diligence
Listing remarks MLS
Investor special with strong potential. Property features four units - two upper and two lower - with identical floor plans, totaling 3,840 SQFT plus a full basement. Conveniently located near Woodward Ave and M-8 for easy access to major roads and amenities. Schedule a showing today! BTVAI
Key facts
- Four units
- Full basement
- 5,227 sq ft lot
Tags
Neighborhood map
What this means for you Summary
Snapshot
- This is a 8-bed/4.0-bath single-family listed at $40k.
Deal economics
- At list price, monthly cash flow is $1k ($12k/yr) — positive.
- The deal already cash-flows at list — no discount required.
- Meets the 1% rule at list price ($2k rent vs $40k).
- Recommended offer: $36k (9.0% below list) — sets the bar for market timing.
- Cap rate 36.7% vs local median 14.2% in Highland Park — top-decile yield for the area; either an underpriced asset or a hidden risk that comps aren't pricing in. Stress-test before assuming the spread holds.
Location & tenants
- Location reads 73/100 on livability (#214 in MI) — a middle-class / working-renter tenant base. Strengths: commute A+, cost of living A+, housing A+; Watch: schools F, crime F, employment F.
- Market conditions: 216 active listings in the ZIP; lower-income renter base — watch delinquency; 2,639 units permitted in Wayne County in 2024 (1,216 in 5+ unit buildings).
- At $1,634/mo this rent would consume 51% of the median local household income ($38k/yr) (locally 1192% of renters already pay >50% of income on rent) — very limited rent-growth headroom before tenants either downsize or default.
Forward outlook
- Local home prices are declining (-3.0%/yr); year-one equity from $277 of loan paydown is wiped out by about $1k of value loss. Plan a longer hold.
- Wayne County population projected at -17% by 2050 — secular population decline; favor cash flow + early exit over multi-decade hold.
- At projected returns (-3.0% appreciation + 3.0% rent growth), your $11k cash investment doubles in ~1 year — after that, you're playing with house money.
Negotiation context
- It's been on market 114 days — a 9% lower offer ($36k) is reasonable based on typical stale-listing flexibility.
- 12 sale attempts since 4y ago; this cycle's ask has dropped $35k (47%) from the opening price — seller is motivated, your offer sets the floor, not the list.
Risks & watch-outs
- Watch-outs: built in 1925 — expect roof / HVAC / electrical / plumbing capex.
Questions for the listing agent
- It's been on market 114 days. Have you received any prior offers? Is the seller open to a 9% concession, seller financing, or rate buy-down credit?
- Built in 1925 — when were the roof, HVAC, electrical panel, plumbing, and water heater last replaced?
- Why hasn't it sold? Are there any deal-killer items the seller is aware of (foundation, flood, title, zoning, code violations)?
- Is there a deadline driving the sale (1031 exchange, divorce, estate, relocation)? That informs how much negotiation room exists.
- Schools are F-rated, which usually means shorter tenancies and higher turnover. Who's the typical renter profile here, and what's been the actual vacancy rate?
- Crime grade is F in this area — have there been break-ins, vandalism, or insurance claims at this property in the last 3 years? What carrier currently insures it and at what premium?
- What's the average days-on-market for RENTAL listings here right now (not sales)? A rising rental-DOM trend means longer vacancies and softer asking-rent achievability than the comps imply.
- What's the recent tenant-quality profile in this submarket — average credit score on applications, eviction rate, late-payment / NSF rate, and stable-employment percentage? A property-management company in the area should have these aggregated.
- How much new for-sale + rental construction is in the pipeline within 1–3 miles? Heavy new supply typically softens prices + rents 12–24 months out; constrained supply supports both.
Investment metrics
- 1% rule
- 4.09% ✓
- Cap rate
- 36.73%
- Cash-on-cash
- 108.71%
- DSCR
- 5.84
- GRM
- 2.0
CMA / ARV
- ARV (median comp)
- $73,553
- List price
- $40,000
- Delta
- -45.62%
- Verdict
- UNDERPRICED
- Comps
- 9 within 1.0 mi
Projected returns pro-forma
-3.0% appreciation · 3.0% rent growth · sell at horizon
- IRR
- —
- Equity multiple
- 6.19×
- Total profit
- $58,167
- Equity at exit
- $5,964
- IRR
- —
- Equity multiple
- 12.96×
- Total profit
- $133,965
- Equity at exit
- $3,458
Cash invested: $11,200 (down + closing). Projections, not guarantees.
Landlord ↔ Tenant lean methodology
- Overall (STATE)
- 62 Landlord-Friendly
- State Michigan
- 62 Landlord-Friendly · EVEN
- County
- — inherits STATE
- City
- — inherits STATE
ZIP-level market 48203
- Home prices YoY
- -23.3%
- Active inventory
- 216
- Price-to-rent
- 2.0×
Monthly cashflow live
- Estimated rent
- $1,634 medium interval (Pro) →
- Mortgage (P&I)
- −$210
- Tax est. 1.5%
- −$50 /mo · $600/yr
- Insurance
- −$17
- HOA
- −$0
- Vacancy / Maint / Mgmt
- −$343
- Net cashflow
- $1,015
Break-even live
UW: 25.0% down · 7.5% · 30yr · 1.5% tax · 5.0% vac · 8.0% maint · 8.0% mgmt
Financing live
Cash to close
- Down payment
- $10,000
- Closing costs
- $1,200
- Reserves months
- —
- Total cash needed
- —
Loan-product check · same deal, 3 products live
Conventional
25% down · 7.5% · 30yr
- Down + closing
- —
- Monthly P&I
- —
- Monthly cashflow
- —
- DSCR
- —
- Eligible?
- —
Personal DTI + credit; lowest rate.
DSCR
20% down · 8.5% · 30yr
- Down + closing
- —
- Monthly P&I
- —
- Monthly cashflow
- —
- DSCR
- —
- Eligible?
- —
No personal income docs; deal must DSCR.
Hard money
10% down · 12.0% · 12mo
- Down + closing
- —
- Monthly P&I
- —
- Monthly cashflow
- —
- DSCR
- —
- Eligible?
- —
Short-term bridge; refi at stabilization.
Listing history 50 events
-
2026-06-18days on market $40,000 Active 114 DOM
-
2026-06-17days on market $40,000 Active 113 DOM
-
2026-06-16days on market $40,000 Active 112 DOM
-
2026-06-15days on market $40,000 Active 111 DOM
-
2026-06-13days on market $40,000 Active 109 DOM
-
2026-06-09days on market $40,000 Active 105 DOM
-
2026-06-08days on market $40,000 Active 104 DOM
-
2026-06-07days on market $40,000 Active 103 DOM
-
2026-06-04days on market $40,000 Active 100 DOM
-
2026-06-03days on market $40,000 Active 99 DOM
-
2026-06-02pricedays on market $40,000 Active 98 DOM
-
2026-06-01days on market $49,900 Active 97 DOM
-
2026-05-31days on market $49,900 Active 96 DOM
-
2026-05-08price $49,900 291-char remark
Show marketing remark (291 chars)
Investor special with strong potential. Property features four units - two upper and two lower - with identical floor plans, totaling 3,840 SQFT plus a full basement. Conveniently located near Woodward Ave and M-8 for easy access to major roads and amenities. Schedule a showing today! BTVAI
-
2026-05-07price $49,900 291-char remark
Show marketing remark (291 chars)
Investor special with strong potential. Property features four units - two upper and two lower - with identical floor plans, totaling 3,840 SQFT plus a full basement. Conveniently located near Woodward Ave and M-8 for easy access to major roads and amenities. Schedule a showing today! BTVAI
-
2026-04-25price $54,900 291-char remark
Show marketing remark (291 chars)
Investor special with strong potential. Property features four units - two upper and two lower - with identical floor plans, totaling 3,840 SQFT plus a full basement. Conveniently located near Woodward Ave and M-8 for easy access to major roads and amenities. Schedule a showing today! BTVAI
-
2026-04-02price $64,900 291-char remark
Show marketing remark (291 chars)
Investor special with strong potential. Property features four units - two upper and two lower - with identical floor plans, totaling 3,840 SQFT plus a full basement. Conveniently located near Woodward Ave and M-8 for easy access to major roads and amenities. Schedule a showing today! BTVAI
-
2026-04-01price $64,900 291-char remark
Show marketing remark (291 chars)
Investor special with strong potential. Property features four units - two upper and two lower - with identical floor plans, totaling 3,840 SQFT plus a full basement. Conveniently located near Woodward Ave and M-8 for easy access to major roads and amenities. Schedule a showing today! BTVAI
-
2026-02-24$74,900 Active 291-char remark
Show marketing remark (291 chars)
Investor special with strong potential. Property features four units - two upper and two lower - with identical floor plans, totaling 3,840 SQFT plus a full basement. Conveniently located near Woodward Ave and M-8 for easy access to major roads and amenities. Schedule a showing today! BTVAI
-
2025-12-27historical
-
2025-12-27historical
-
2025-09-06price $80,000
-
2025-09-05price $80,000
-
2025-07-01price $100,000
-
2025-06-30price $90,000
-
2025-06-30price $90,000
-
2025-05-12price $100,000
-
2025-05-12price $100,000
-
2025-01-03$120,000 Active
-
2025-01-03$120,000 Active
-
2023-10-10soldstatus $45,300 Sold
-
2023-10-10soldstatus $45,300 Closed
-
2023-09-26status Pending
-
2023-09-26status Pending
-
2023-07-13historical
-
2023-07-13$48,000 Active
-
2023-07-13$48,000 Active
-
2023-07-13historical
-
2023-06-22price $58,000
-
2023-06-22$50,000 Active
-
2023-06-22historical
-
2023-06-22$58,000 Active
-
2023-06-22historical
-
2023-05-19historical
-
2023-05-19$74,000 Active
-
2023-05-19$74,000 Active
-
2023-05-19historical
-
2022-11-16$94,000 Active
ⓘ Source: listings_history table (triggers on properties + properties_extension) + one-shot
backfill from property_details.listing_events for pre-trigger history.
Climate risk First Street
- Flood 1/10 Low FEMA zone X (unshaded) · 0% chance over 30 yrs
- Wildfire 1/10 Low
- Heat 3/10 Moderate 7 d/yr ≥97°F today · 15 d/yr by 30 yrs out
- Wind 2/10 Low
- Air quality 4/10 Moderate 4 unhealthy d/yr today · 6 by 30 yrs out
Nearby sold comps map
Loading sold comps map…
Walkable amenities ~0.75 mi
Loading nearby amenities…
Taxation est. · year 1
- Rental income
- $19,611
- − Mortgage interest
- −$2,241
- − Property taxes
- −$600
- − Insurance
- −$200
- − Repairs & maintenance
- −$1,569
- − Management
- −$1,569
- − Depreciation
- −$1,164
- Taxable income
- $12,269
- Est. tax owed @ 24.0%
- −$2,945
- After-tax cash flow
- $9,231/yr
For passive investors: Depreciation is non-cash, so a rental often shows a tax loss while cash-flowing — sheltering income. Rental losses are passive: they offset passive income freely, and up to $25,000/yr can offset ordinary (W-2) income if you actively participate and your MAGI is under $100k (phasing out to $0 by $150k); unused losses carry forward. On sale, claimed depreciation is recaptured at up to 25%, and gains may owe capital-gains tax (a 1031 exchange can defer both). Figures are a year-1 estimate at your 24.0% rate — not tax advice; consult a CPA.
Schools (NCES district)
No district data.
Livability — Highland Park
- Score
- 73/100
- State rank
- #214
- US rank
- #5271
Category grades
Schools grade is shown separately in the Schools card above.
Census & demographics
- Census place
- Highland Park, MI
- County
- Wayne County · 1,562,939 people
- Metro
- Detroit-Warren-Dearborn, MI
- Population (ZIP)
- 20,049
- Household income
- $38,404
- Rent vs Own
- Severe rent burden
- 1192.0
Population outlook (Wayne County) Hauer SSP2
- Today (2025)
- 1,675,273 people
- By 2030
- 1,620,300 · -3.3%
- By 2040
- 1,502,341 · -10.3%
- By 2050
- 1,384,039 · -17.4%
- By 2075
- 1,124,592 · -32.9%
- By 2100
- 881,193 · -47.4%
Race, ethnicity, and origin ACS 2023
- Neighborhood character
- Predominantly Black (85%)
- Race & ethnicity
- Black 85% White 8% Two or more races 5% Hispanic / Latino 2%
- Common ancestry
- Lithuanian 1%
- Foreign-born
- 2% · Canada
- Languages at home
- 95% English-only · Spanish 3% French/Haitian/Cajun 1%
Political lean MEDSL · Wayne
- 2024 margin
- Strong D (+29.0) · D 62.7% · R 33.7% · Other 3.6%
- 2008→2024 swing
- -20.5pp toward R · 2008: 49.5pp · 2024: 29.0pp
- All cycles
- 2024: D+29.0 2020: D+38.1 2016: D+37.3 2012: D+46.9 2008: D+49.5
Not yet ingested
- Civics
- —
Market trends
- HPI YoY
- ▼ -90.13%
- Current HPI
- 297.0176
- Rent YoY
- —
- Metro
- Detroit-Warren-Dearborn, MI
- State GDP YoY
- ▲ 1.37%
- F500 in state
- 28
Industry mix (Fortune 500 HQ in MI)
| Industry | F500 HQs | Revenue |
|---|---|---|
| Automotive Parts | 3 | $48B |
|
||
| Automotive | 2 | $372B |
|
||
| Chemicals | 1 | $45B |
|
||
| Automotive Retail | 1 | $29B |
|
||
| Healthcare / Medical Devices | 1 | $23B |
|
||
| Automotive Technology | 1 | $20B |
|
||
Price history
-46.9% since first listed38 events — show timeline
- 2026-05-08 Price Changed $49,900 MiRealSource-MiMLS
- 2026-05-07 Price Changed $49,900 REALCOMP
- 2026-04-25 Price Changed $54,900 MiRealSource-MiMLS
- 2026-04-25 Price Changed $54,900 REALCOMP
- 2026-04-02 Price Changed $64,900 MiRealSource-MiMLS
- 2026-04-01 Price Changed $64,900 REALCOMP
- 2026-02-24 Listed $74,900 REALCOMP
- 2026-02-24 Listed $74,900 MiRealSource-MiMLS
- 2025-12-27 Listing Removed — REALCOMP
- 2025-12-27 Listing Removed — MiRealSource-MiMLS
- 2025-09-06 Price Changed $80,000 MiRealSource-MiMLS
- 2025-09-05 Price Changed $80,000 REALCOMP
- 2025-07-01 Price Changed $100,000 MiRealSource-MiMLS
- 2025-06-30 Price Changed $90,000 MiRealSource-MiMLS
- 2025-06-30 Price Changed $90,000 REALCOMP
- 2025-05-12 Price Changed $100,000 MiRealSource-MiMLS
- 2025-05-12 Price Changed $100,000 REALCOMP
- 2025-01-03 Listed $120,000 REALCOMP
- 2025-01-03 Listed $120,000 MiRealSource-MiMLS
- 2023-10-10 Sold (MLS) $45,300 MiRealSource-MiMLS
- 2023-10-10 Sold (MLS) $45,300 REALCOMP
- 2023-09-26 Pending — MiRealSource-MiMLS
- 2023-09-26 Pending — REALCOMP
- 2023-07-13 Listing Removed — MiRealSource-MiMLS
- 2023-07-13 Listed $48,000 MiRealSource-MiMLS
- 2023-07-13 Listed $48,000 REALCOMP
- 2023-07-13 Listing Removed — REALCOMP
- 2023-06-22 Price Changed $58,000 REALCOMP
- 2023-06-22 Listing Removed — MiRealSource-MiMLS
- 2023-06-22 Listed $58,000 MiRealSource-MiMLS
- 2023-06-22 Listing Removed — REALCOMP
- 2023-06-22 Listed $50,000 REALCOMP
- 2023-05-19 Listing Removed — MiRealSource-MiMLS
- 2023-05-19 Listed $74,000 MiRealSource-MiMLS
- 2023-05-19 Listed $74,000 REALCOMP
- 2023-05-19 Listing Removed — REALCOMP
- 2022-11-16 Listed $94,000 MiRealSource-MiMLS
- 2022-11-16 Listed $94,000 REALCOMP
Property tax history
+4.7%/yrLatest (2025): $5,194 · -18.5% YoY. Source: county tax records.
Cash-flow waterfall
monthlySold comps — $/sqft
last 12 mo · ≤1 miLoading sold comps…