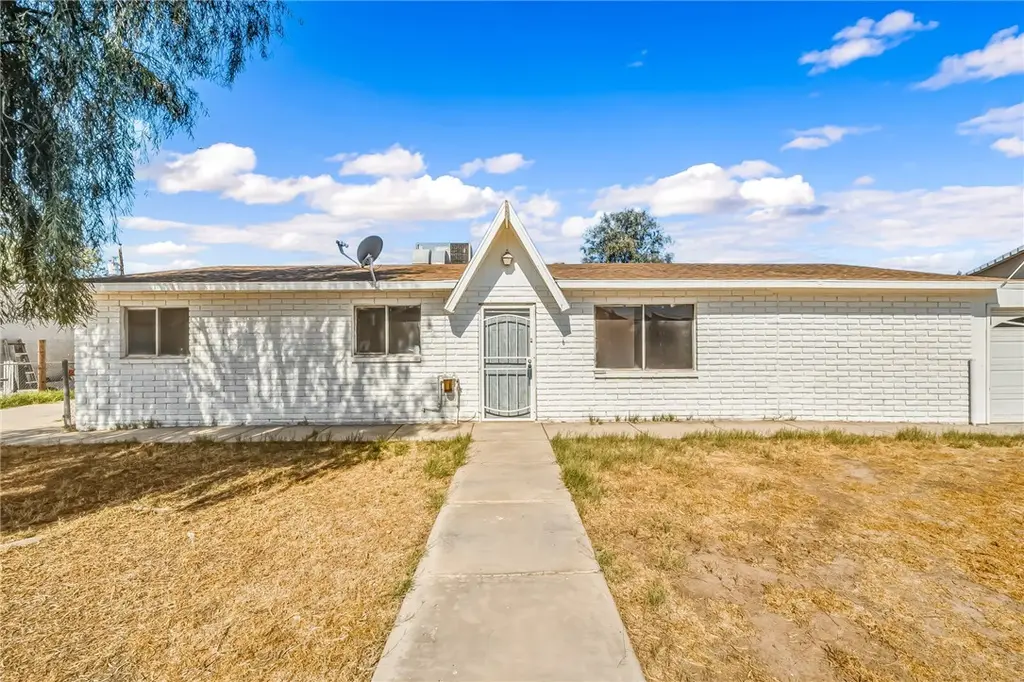
10285 S Hamilton Dr · Arizona Village, AZ
Flood risk 3/10 · Minor
- FEMA flood zone
- X (shaded)
- Chance of flooding over 30 yrs
- 0.18%
- Est. flood insurance / yr
- $507 – $1,088
Fire risk 5/10 · Moderate
- Est. fire insurance / yr
- $610 – $1,132
Heat risk 9/10 · Severe
- Hot days now (above 117°F)
- 7 days/yr
- Hot days in 30 yrs
- 16 days/yr
Wind risk 1/10 · Minimal
- Chance of severe wind over 30 yrs
- —
Air-quality risk 1/10 · Minimal
- Unhealthy air days now
- 0 days/yr
- Unhealthy air days in 30 yrs
- 0 days/yr
Risk factors via First Street. Map © Google.
Why this score? — see what drove the B- grade
The composite is a weighted blend of 9 inputs, each scored 0–100. Each bar is that input's sub-score; the figure is the points it added to the 100-point composite (weight × sub-score).
- Cash flow +21.4/30.0
- ARV discount +15.0/15.0
- Appreciation +10.0/10.0
- DSCR +6.8/10.0
- 1% rule +4.5/10.0
- Livability +2.8/5.0
- Rent growth +2.5/5.0
- Condition / age +2.5/5.0
- Schools +1.3/10.0
$160,000
🖨 Deal sheet 📄 Offer letter ✓ Due diligence
Listing remarks MLS
Older home ready for a make over. Large detached garage with bathroom.
Key facts
- Rv parking
- Primary suite
- Detached garage
Tags
Property features AI
Exterior
- Parking: Attached garage; Detached garage; Drive-through access; RV access/parking; 4 garage spaces
- Utilities: Public water; Septic tank sewer; 220-volt electrical service
- Home design: Single-family residence; One story; Entry with 36" door
- Construction: Shingle roof
- Exterior features: Enclosed patio; Patio; Back yard fencing; Unimproved road frontage; R1 single-family residential zoning; Lot roughly 0.21 acres (approx. 90 x 100)
Interior
- Kitchen: Electric oven; Electric range
- Flooring: Marble; Tile
- Bathrooms: 3 full bathrooms
- Heating & cooling: Central heating (electric); Central air conditioning; Ceiling fans
- Interior features: Ceiling fans; Laminate counters; Accessible full bath
- Laundry & utility: Water heater
Neighborhood map
What this means for you Summary
Snapshot
- This is a 3-bed/3.0-bath single-family listed at $160k.
Deal economics
- At list price, monthly cash flow is $237 ($3k/yr) — positive.
- The deal already cash-flows at list — no discount required.
- To meet the 1% rule (rent ≥ 1% of price), the offer needs to be $152k (4.8% below list).
- Recommended offer: $152k (4.8% below list) — sets the bar for 1% rule.
Location & tenants
- Location reads 56/100 on livability (#252 in AZ) — a working-class tenant base; expect higher turnover. Strengths: cost of living A+, crime A; Watch: health & safety C-, schools F, amenities F.
- Colorado River Union High School District (4381) (town): math 13% / reading 17% proficiency, ranked #213 of 249 in AZ (top 86%) — low school quality limits family demand, transient renter base, plan for 1-2y turnover.
- Market conditions: 217 active listings in the ZIP; 4 comparable units currently listed for rent nearby; rentals leasing fast (median 14d on market — plan ~1-2 weeks tenant-placement turnaround); 2,543 units permitted in Mohave County in 2024 (33 in 5+ unit buildings).
Forward outlook
- In year one you build about $17k of equity ($1k loan paydown + $16k appreciation (10.0% local appreciation)).
- Mohave County population projected to shrink 6% by 2050 — rents likely to lag national; underwrite the cash flow, not the appreciation.
- At projected returns (10.0% appreciation + 3.0% rent growth), your $45k cash investment doubles in ~3 years — after that, you're playing with house money.
- By year 3, paydown + projected appreciation supports a ~$43k cash-out refi (75% LTV) — recoverable capital for the next deal without selling this one.
Negotiation context
- It's been on market 58 days — a 3% lower offer ($155k) is reasonable based on typical stale-listing flexibility.
- 2 sale attempts since 5y ago with the ask held roughly flat each time — persistent listings suggest the price (not the market) is what's stuck; bring a comps-based counter.
- Current owner paid $125k; 28% above their basis — modest negotiation headroom, anchor on the comps not their cost.
Risks & watch-outs
- Climate carrying-cost: moderate wildfire risk; extreme-heat days projected 7→16/yr by 2055 (HVAC capex compounding) — expect insurance premiums to compound above CPI over the hold.
Questions for the listing agent
- It's been on market 58 days. Have you received any prior offers? Is the seller open to a 5% concession, seller financing, or rate buy-down credit?
- Built in 1967 — when were the roof, HVAC, electrical panel, plumbing, and water heater last replaced?
- Is there a deadline driving the sale (1031 exchange, divorce, estate, relocation)? That informs how much negotiation room exists.
- Schools are F-rated, which usually means shorter tenancies and higher turnover. Who's the typical renter profile here, and what's been the actual vacancy rate?
- What's the average days-on-market for RENTAL listings here right now (not sales)? A rising rental-DOM trend means longer vacancies and softer asking-rent achievability than the comps imply.
- What's the recent tenant-quality profile in this submarket — average credit score on applications, eviction rate, late-payment / NSF rate, and stable-employment percentage? A property-management company in the area should have these aggregated.
- How much new for-sale + rental construction is in the pipeline within 1–3 miles? Heavy new supply typically softens prices + rents 12–24 months out; constrained supply supports both.
Investment metrics
- 1% rule
- 0.95% ✗
- Cap rate
- 8.07%
- Cash-on-cash
- 6.34%
- DSCR
- 1.28
- GRM
- 8.7
CMA / ARV
- ARV (on-the-fly)
- $251,472
- Comps found
- 2
Show comp detail 2 sales within ~0.75 mi
| Address | Dist | Beds/Ba | Sqft | Sold | Price | $/sf | Match |
|---|---|---|---|---|---|---|---|
| 10102 S River Delta Rd | 0.39mi | 3/2.0 | 1,344 (-1%) | 5mo | $142,500 | $106 | 73 |
| 1396 E Empire Rd | 0.08mi | 3/2.0 | 1,395 (+3%) | 22mo | $260,000 | $186 | 69 |
Match score weights: distance 35% · size 25% · config 20% · recency 20%. Top-matched comps best support the ARV.
Projected returns pro-forma
10.0% appreciation · 3.0% rent growth · sell at horizon
- IRR
- 28.9%
- Equity multiple
- 3.28×
- Total profit
- $102,157
- Equity at exit
- $144,141
- IRR
- 25.1%
- Equity multiple
- 7.45×
- Total profit
- $288,854
- Equity at exit
- $310,845
Cash invested: $44,800 (down + closing). Projections, not guarantees.
Landlord ↔ Tenant lean methodology
- Overall (STATE)
- 87 Strongly Landlord-Friendly
- State Arizona
- 87 Strongly Landlord-Friendly · R+3
- County
- — inherits STATE
- City
- — inherits STATE
ZIP-level market 86440
- Home prices YoY
- 4.2%
- Active inventory
- 217
- Price-to-rent
- 8.7×
Monthly cashflow live
- Estimated rent
- $1,524 medium interval (Pro) →
- Mortgage (P&I)
- −$839
- Tax from tax record
- −$61 /mo · $737/yr
- Insurance
- −$67
- HOA
- −$0
- Vacancy / Maint / Mgmt
- −$320
- Net cashflow
- $237
Break-even live
UW: 25.0% down · 7.5% · 30yr · 1.5% tax · 5.0% vac · 8.0% maint · 8.0% mgmt
Financing live
Cash to close
- Down payment
- $40,000
- Closing costs
- $4,800
- Reserves months
- —
- Total cash needed
- —
Loan-product check · same deal, 3 products live
Conventional
25% down · 7.5% · 30yr
- Down + closing
- —
- Monthly P&I
- —
- Monthly cashflow
- —
- DSCR
- —
- Eligible?
- —
Personal DTI + credit; lowest rate.
DSCR
20% down · 8.5% · 30yr
- Down + closing
- —
- Monthly P&I
- —
- Monthly cashflow
- —
- DSCR
- —
- Eligible?
- —
No personal income docs; deal must DSCR.
Hard money
10% down · 12.0% · 12mo
- Down + closing
- —
- Monthly P&I
- —
- Monthly cashflow
- —
- DSCR
- —
- Eligible?
- —
Short-term bridge; refi at stabilization.
Rent comps 4 comps
| Address | Beds | Baths | Sqft | Rent | $/sqft | DOM | Units | Dist |
|---|---|---|---|---|---|---|---|---|
| 9815 S Phoenix Dr Mohave Valley, AZ | 3.0 | 2.0 | 1146 | $1,600 | $1.40 | 13d | 1 | 1.28mi |
| 503 California Ave Needles, CA | 3.0 | 2.0 | 1428 | $1,500 | $1.05 | 13d | 1 | 1.32mi |
| 1514 4th St Unit 1514 Needles, CA | 3.0 | 1.0 | 968 | $1,375 | $1.42 | 13d | 1 | 1.38mi |
| 10044 S Kent Rd Mohave Valley, AZ | 3.0 | 2.0 | 1643 | $1,600 | $0.97 | 13d | 1 | 1.43mi |
Listing history 23 events
-
2026-06-18days on market $160,000 Active 58 DOM
-
2026-06-17days on market $160,000 Active 57 DOM
-
2026-06-16days on market $160,000 Active 56 DOM
-
2026-06-15days on market $160,000 Active 55 DOM
-
2026-06-14days on market $160,000 Active 53 DOM
-
2026-06-13days on market $160,000 Active 52 DOM
-
2026-06-10days on market $160,000 Active 50 DOM
-
2026-06-09days on market $160,000 Active 49 DOM
-
2026-06-08days on market $160,000 Active 48 DOM
-
2026-06-07days on market $160,000 Active 47 DOM
-
2026-06-05days on market $160,000 Active 44 DOM
-
2026-06-03days on market $160,000 Active 43 DOM
-
2026-06-02days on market $160,000 Active 42 DOM
-
2026-06-01days on market $160,000 Active 41 DOM
-
2026-05-31days on market $160,000 Active 40 DOM
-
2026-05-30days on market $160,000 Active 39 DOM
-
2026-04-21$160,000 Active
-
2021-06-30soldstatus $125,000 70-char remark
Show marketing remark (70 chars)
Older home ready for a make over. Large detached garage with bathroom.
-
2021-06-25soldstatus $125,000
-
2021-03-26$135,000 70-char remark
Show marketing remark (70 chars)
Older home ready for a make over. Large detached garage with bathroom.
-
2021-03-10soldstatus $84,000
-
2002-06-26soldstatus $55,000
-
1994-07-08soldstatus $53,000
ⓘ Source: listings_history table (triggers on properties + properties_extension) + one-shot
backfill from property_details.listing_events for pre-trigger history.
Tax reassessment forecast AZ · Resets to sale price
- Current annual tax
- $737 · $61/mo
- Projected year-2 tax
- $1,056 · $88/mo
- Expected delta
- +$319/yr (+$27/mo · 43.2%)
ⓘ Screening estimate from a state-policy table — verify with the county assessor before closing.
Climate risk First Street
- Flood 3/10 Moderate FEMA zone X (shaded) · 18% chance over 30 yrs
- Wildfire 5/10 Major
- Heat 9/10 Extreme 7 d/yr ≥117°F today · 16 d/yr by 30 yrs out
- Wind 1/10 Low
- Air quality 1/10 Low 0 unhealthy d/yr today · 0 by 30 yrs out
Nearby sold comps map
Loading sold comps map…
Walkable amenities ~0.75 mi
Loading nearby amenities…
Taxation est. · year 1
- Rental income
- $18,287
- − Mortgage interest
- −$8,962
- − Property taxes
- −$737
- − Insurance
- −$800
- − Repairs & maintenance
- −$1,463
- − Management
- −$1,463
- − Depreciation
- −$4,655
- Taxable income
- $207
- Est. tax owed @ 24.0%
- −$50
- After-tax cash flow
- $2,791/yr
For passive investors: Depreciation is non-cash, so a rental often shows a tax loss while cash-flowing — sheltering income. Rental losses are passive: they offset passive income freely, and up to $25,000/yr can offset ordinary (W-2) income if you actively participate and your MAGI is under $100k (phasing out to $0 by $150k); unused losses carry forward. On sale, claimed depreciation is recaptured at up to 25%, and gains may owe capital-gains tax (a 1031 exchange can defer both). Figures are a year-1 estimate at your 24.0% rate — not tax advice; consult a CPA.
Schools (NCES district)
- District
- Colorado River Union High School District (4381)
- NCES district ID
- 0400082
- Math proficiency
- 13% ▼ -17.00%
- Reading proficiency
- 17% ▼ -18.00%
- Median HH income
- $39,132
- Composite
- 12.72/100
- National rank
- #9603
- State rank
- #213 of 249 in AZ
Livability — Arizona Village
- Score
- 56/100
- State rank
- #252
- US rank
- #22996
Category grades
Schools grade is shown separately in the Schools card above.
Census & demographics
- City population
- 15,467
- Population (ZIP)
- 8,403
Population outlook (Mohave County) Hauer SSP2
- Today (2025)
- 209,184 people
- By 2030
- 209,674 · +0.2%
- By 2040
- 205,897 · -1.6%
- By 2050
- 196,810 · -5.9%
- By 2075
- 169,454 · -19.0%
- By 2100
- 136,630 · -34.7%
Race, ethnicity, and origin ACS 2023
- Neighborhood character
- Predominantly White (73%)
- Race & ethnicity
- White 73% Hispanic / Latino 20% Two or more races 11% Native American 4%
- Hispanic origin (detail)
- Mexican 11%
- Common ancestry
- Lithuanian 3% Iranian 2% Italian 2%
- Foreign-born
- 1% · Canada
- Languages at home
- 96% English-only · Spanish 3%
Political lean MEDSL · Mohave
- 2024 margin
- Solid R (+55.8) · D 21.8% · R 77.6%
- 2008→2024 swing
- -22.9pp toward R · 2008: -32.9pp · 2024: -55.8pp
- All cycles
- 2024: R+55.8 2020: R+51.3 2016: R+51.5 2012: R+42.6 2008: R+32.9
Not yet ingested
- Civics
- —
Market trends
- HPI YoY
- ▲ 13.05%
- Current HPI
- 322.7772
- Rent YoY
- —
- Metro
- —
- State GDP YoY
- ▲ 4.54%
- F500 in state
- 20
Industry mix (Fortune 500 HQ in AZ)
| Industry | F500 HQs | Revenue |
|---|---|---|
| Technology | 2 | $13B |
|
||
| Mining / Metals | 1 | $23B |
|
||
| Environmental Services | 1 | $16B |
|
||
| Metals / Steel | 1 | $14B |
|
||
| Technology Distribution | 1 | $9B |
|
||
| Homebuilding | 1 | $8B |
|
||
Price history
+201.9% since first listed7 events — show timeline
- 2026-04-21 Listed $160,000 WARDEX
- 2021-06-30 Sold (MLS) $125,000 WARDEX
- 2021-06-25 Sold (Public Records) $125,000 Public Records
- 2021-03-26 Listed $135,000 WARDEX
- 2021-03-10 Sold (Public Records) $84,000 Public Records
- 2002-06-26 Sold (Public Records) $55,000 Public Records
- 1994-07-08 Sold (Public Records) $53,000 Public Records
Property tax history
+3.8%/yrLatest (2025): $737 · +15.4% YoY. Source: county tax records.
Cash-flow waterfall
monthlySold comps — $/sqft
last 12 mo · ≤1 miLoading sold comps…