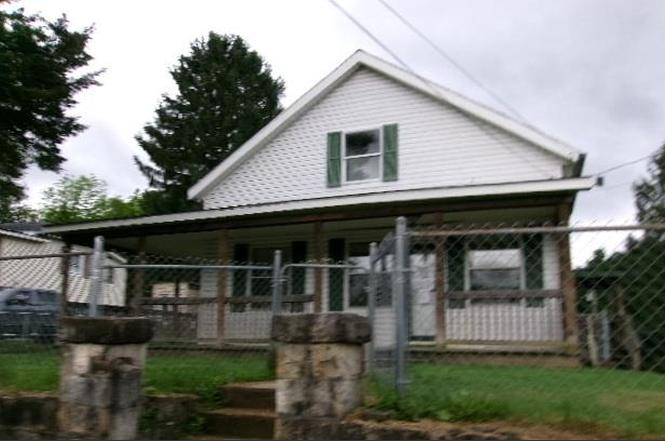
200 Little Vine Dr · Daniels, WV
Flood risk No data
- FEMA flood zone
- —
- Chance of flooding over 30 yrs
- —
- Est. flood insurance / yr
- —
Fire risk No data
- Est. fire insurance / yr
- —
Heat risk No data
- Hot days now (above threshold)
- —
- Hot days in 30 yrs
- —
Wind risk No data
- Chance of severe wind over 30 yrs
- —
Air-quality risk No data
- Unhealthy air days now
- —
- Unhealthy air days in 30 yrs
- —
Risk factors via First Street. Map © Google.
Why this score? — see what drove the B- grade
The composite is a weighted blend of 9 inputs, each scored 0–100. Each bar is that input's sub-score; the figure is the points it added to the 100-point composite (weight × sub-score).
- Cash flow +30.0/30.0
- 1% rule +10.0/10.0
- DSCR +10.0/10.0
- ARV discount +7.5/15.0
- Schools +3.0/10.0
- Livability +2.8/5.0
- Rent growth +2.5/5.0
- Condition / age +2.5/5.0
- Appreciation +0.0/10.0
$89,000
🖨 Deal sheet 📄 Offer letter ✓ Due diligence
Listing remarks MLS
Conveniently located 4-bedroom 2 bath house with partially fenced yard. Beautiful covered wrap around porch. New 16x28 building with bathroom has electric and water.
Key facts
- 0.26 acre lot
- Built 1935
- Listed 2 days
Tags
Property features AI
Exterior
- Parking: Open parking on gravel; no garage
- Utilities: Public water; Public sewer
- Home design: Residential property; Two levels; Vinyl siding
- Construction: Vinyl siding construction
- Exterior features: Asphalt roof; Property has a view; Lot is level to rolling
Interior
- Kitchen: Electric water heater
- Bedrooms: 1 main-level bedroom
- Flooring: Hardwood; Laminate
- Bathrooms: 2 full bathrooms
- Heating & cooling: Natural gas heating; Central air conditioning
- Interior features: Eat-in kitchen; Unfinished basement
- Laundry & utility: No built-in laundry listed
Neighborhood map
What this means for you Summary
Snapshot
- This is a 4-bed/2.0-bath single-family listed at $89k.
Deal economics
- At list price, monthly cash flow is $566 ($7k/yr) — positive.
- The deal already cash-flows at list — no discount required.
- Meets the 1% rule at list price ($1k rent vs $89k).
Location & tenants
- Location reads 56/100 on livability (#272 in WV) — a working-class tenant base; expect higher turnover. Strengths: crime A+, cost of living A+, housing B+; Watch: health & safety D+, amenities F, commute F.
- Raleigh County Schools (rural): math 29% / reading 42% proficiency, ranked #14 of 55 in WV (top 26%) — families likely to look elsewhere, expect single-tenant / working-renter base with shorter leases.
- Zoned schools: Daniels Elementary (math 38% / reading 36%, grade F, #130 of 377 statewide, top 39%, 562 students, 0% FRL); Shady Spring Middle School (math 30% / reading 46%, grade F, #25 of 109 statewide, top 23%, 578 students, 0% FRL); Shady Spring High (math 32% / reading 57%, grade F, #11 of 110 statewide, top 11%, 828 students, 0% FRL) — zoned schools average 0% FRL vs 46% district-wide (46 pts lower); this property's tenant base skews higher-income than the district average.
- Market conditions: 13 active listings in the ZIP; 41 units permitted in Raleigh County in 2024 (0 in 5+ unit buildings).
Forward outlook
- Local home prices are declining (-3.0%/yr); year-one equity from $615 of loan paydown is wiped out by about $3k of value loss. Plan a longer hold.
- Raleigh County population projected at -16% by 2050 — secular population decline; favor cash flow + early exit over multi-decade hold.
- At projected returns (-3.0% appreciation + 3.0% rent growth), your $25k cash investment doubles in ~5 years — after that, you're playing with house money.
Negotiation context
- Only 3 days on market — expect competitive offers; lowballing is unlikely to land.
- 4 sale attempts since 5y ago with the ask held roughly flat each time — persistent listings suggest the price (not the market) is what's stuck; bring a comps-based counter.
Risks & watch-outs
- Watch-outs: built in 1935 — expect roof / HVAC / electrical / plumbing capex.
Questions for the listing agent
- Built in 1935 — when were the roof, HVAC, electrical panel, plumbing, and water heater last replaced?
- Is there a deadline driving the sale (1031 exchange, divorce, estate, relocation)? That informs how much negotiation room exists.
- Schools are F-rated, which usually means shorter tenancies and higher turnover. Who's the typical renter profile here, and what's been the actual vacancy rate?
- What's the average days-on-market for RENTAL listings here right now (not sales)? A rising rental-DOM trend means longer vacancies and softer asking-rent achievability than the comps imply.
- What's the recent tenant-quality profile in this submarket — average credit score on applications, eviction rate, late-payment / NSF rate, and stable-employment percentage? A property-management company in the area should have these aggregated.
- How much new for-sale + rental construction is in the pipeline within 1–3 miles? Heavy new supply typically softens prices + rents 12–24 months out; constrained supply supports both.
Investment metrics
- 1% rule
- 1.61% ✓
- Cap rate
- 13.93%
- Cash-on-cash
- 27.27%
- DSCR
- 2.21
- GRM
- 5.2
CMA / ARV
- ARV (on-the-fly)
- $183,540
- Comps found
- 6
Show comp detail 6 sales within ~0.75 mi
| Address | Dist | Beds/Ba | Sqft | Sold | Price | $/sf | Match |
|---|---|---|---|---|---|---|---|
| 200 Little Vine Dr | 0.00mi | 4/2.0 | 1,950 (+1%) | 17mo | $185,000 | $95 | 84 |
| 112 Shady Acres Ln | 0.65mi | 3/1.5 (-1) | 1,825 (-6%) | 1mo | $130,000 | $71 | 52 |
| 117 Greystone Dr | 0.37mi | 3/2.0 (-1) | 1,795 (-7%) | 22mo | $240,000 | $134 | 48 |
| 195 C & O Dam Rd | 0.67mi | 4/2.5 | 2,190 (+13%) | 6mo | $115,000 | $53 | 40 |
| 152 Shady Acres Ln | 0.69mi | 3/3.0 (-1) | 1,750 (-9%) | 9mo | $242,000 | $138 | 36 |
| 510 Skyline Dr | 0.73mi | 5/2.0 (+1) | 1,792 (-7%) | 20mo | $165,000 | $92 | 32 |
Match score weights: distance 35% · size 25% · config 20% · recency 20%. Top-matched comps best support the ARV.
Projected returns pro-forma
-3.0% appreciation · 3.0% rent growth · sell at horizon
- IRR
- 21.3%
- Equity multiple
- 1.87×
- Total profit
- $21,641
- Equity at exit
- $13,270
- IRR
- 29.4%
- Equity multiple
- 3.62×
- Total profit
- $65,258
- Equity at exit
- $7,695
Cash invested: $24,920 (down + closing). Projections, not guarantees.
Landlord ↔ Tenant lean methodology
- Overall (STATE)
- 83 Strongly Landlord-Friendly
- State West Virginia
- 83 Strongly Landlord-Friendly · R+22
- County
- — inherits STATE
- City
- — inherits STATE
ZIP-level market 25813
- Home prices YoY
- -5.7%
- Active inventory
- 13
- Price-to-rent
- 5.2×
Monthly cashflow live
- Estimated rent
- $1,434 medium interval (Pro) →
- Mortgage (P&I)
- −$467
- Tax from tax record
- −$63 /mo · $750/yr
- Insurance
- −$37
- HOA
- −$0
- Vacancy / Maint / Mgmt
- −$301
- Net cashflow
- $566
Break-even live
UW: 25.0% down · 7.5% · 30yr · 1.5% tax · 5.0% vac · 8.0% maint · 8.0% mgmt
Financing live
Cash to close
- Down payment
- $22,250
- Closing costs
- $2,670
- Reserves months
- —
- Total cash needed
- —
Loan-product check · same deal, 3 products live
Conventional
25% down · 7.5% · 30yr
- Down + closing
- —
- Monthly P&I
- —
- Monthly cashflow
- —
- DSCR
- —
- Eligible?
- —
Personal DTI + credit; lowest rate.
DSCR
20% down · 8.5% · 30yr
- Down + closing
- —
- Monthly P&I
- —
- Monthly cashflow
- —
- DSCR
- —
- Eligible?
- —
No personal income docs; deal must DSCR.
Hard money
10% down · 12.0% · 12mo
- Down + closing
- —
- Monthly P&I
- —
- Monthly cashflow
- —
- DSCR
- —
- Eligible?
- —
Short-term bridge; refi at stabilization.
Listing history 4 events
-
2026-06-19days on market $89,000 Active 3 DOM
-
2026-06-18days on market $89,000 Active 2 DOM
-
2026-06-17remarks 204-char remark
-
2026-06-17$89,000 Active 1 DOM
ⓘ Source: listings_history table (triggers on properties + properties_extension) + one-shot
backfill from property_details.listing_events for pre-trigger history.
Tax reassessment forecast WV · Resets to sale price
- Current annual tax
- $750 · $63/mo
- Projected year-2 tax
- $750 · $63/mo
- Expected delta
- $0/yr ($0/mo · 0.0%)
ⓘ Screening estimate from a state-policy table — verify with the county assessor before closing.
Nearby sold comps map
Loading sold comps map…
Walkable amenities ~0.75 mi
Loading nearby amenities…
Taxation est. · year 1
- Rental income
- $17,205
- − Mortgage interest
- −$4,985
- − Property taxes
- −$750
- − Insurance
- −$445
- − Repairs & maintenance
- −$1,376
- − Management
- −$1,376
- − Depreciation
- −$2,589
- Taxable income
- $5,683
- Est. tax owed @ 24.0%
- −$1,364
- After-tax cash flow
- $5,432/yr
For passive investors: Depreciation is non-cash, so a rental often shows a tax loss while cash-flowing — sheltering income. Rental losses are passive: they offset passive income freely, and up to $25,000/yr can offset ordinary (W-2) income if you actively participate and your MAGI is under $100k (phasing out to $0 by $150k); unused losses carry forward. On sale, claimed depreciation is recaptured at up to 25%, and gains may owe capital-gains tax (a 1031 exchange can defer both). Figures are a year-1 estimate at your 24.0% rate — not tax advice; consult a CPA.
Schools (NCES district)
- District
- Raleigh County Schools
- NCES district ID
- 5401230
- Math proficiency
- 29% ▼ -8.00%
- Reading proficiency
- 42% ▼ -3.00%
- Median HH income
- $39,828
- Composite
- 29.74/100
- National rank
- #6445
- State rank
- #14 of 55 in WV
Livability — Daniels
- Score
- 56/100
- State rank
- #272
- US rank
- #22887
Category grades
Schools grade is shown separately in the Schools card above.
Census & demographics
- Census place
- Daniels, WV
- City population
- 4,843
- Population (ZIP)
- 7,429
Population outlook (Raleigh County) Hauer SSP2
- Today (2025)
- 73,505 people
- By 2030
- 70,954 · -3.5%
- By 2040
- 66,038 · -10.2%
- By 2050
- 61,919 · -15.8%
- By 2075
- 51,954 · -29.3%
- By 2100
- 39,724 · -46.0%
Race, ethnicity, and origin ACS 2023
- Neighborhood character
- Predominantly White (80%)
- Race & ethnicity
- White 80% Black 16% Hispanic / Latino 3%
- Common ancestry
- Lithuanian 4% Romanian 1% Serbian 1%
- Foreign-born
- 1% · Canada
- Languages at home
- 96% English-only · Spanish 4%
Political lean MEDSL · Raleigh
- 2024 margin
- Solid R (+54.3) · D 22.0% · R 76.3% · Other 1.6%
- 2008→2024 swing
- -28.5pp toward R · 2008: -25.9pp · 2024: -54.3pp
- All cycles
- 2024: R+54.3 2020: R+50.4 2016: R+52.8 2012: R+44.6 2008: R+25.9
Not yet ingested
- Civics
- —
Market trends
- HPI YoY
- ▼ -13.00%
- Current HPI
- 214.0545
- Rent YoY
- —
- Metro
- —
- State GDP YoY
- —
- F500 in state
- 0
Price history
+123.1% since first listed10 events — show timeline
- 2026-06-16 Listed $89,000 BBOR
- 2025-01-15 Sold (MLS) $185,000 BBOR
- 2025-01-15 Sold (MLS) $185,000 MTCBOR
- 2024-07-18 Listed $187,000 BBOR
- 2024-07-18 Listed $187,000 MTCBOR
- 2021-06-16 Sold (Public Records) $105,000 Public Records
- 2021-06-15 Sold (MLS) $105,000 BBOR
- 2021-03-15 Listed $132,500 BBOR
- 2019-11-06 Sold (Public Records) $90,000 Public Records
- 1986-03-03 Sold (Public Records) $39,900 Public Records
Property tax history
+4.7%/yrLatest (2023): $750 · +0.0% YoY. Source: county tax records.
Cash-flow waterfall
monthlySold comps — $/sqft
last 12 mo · ≤1 miLoading sold comps…