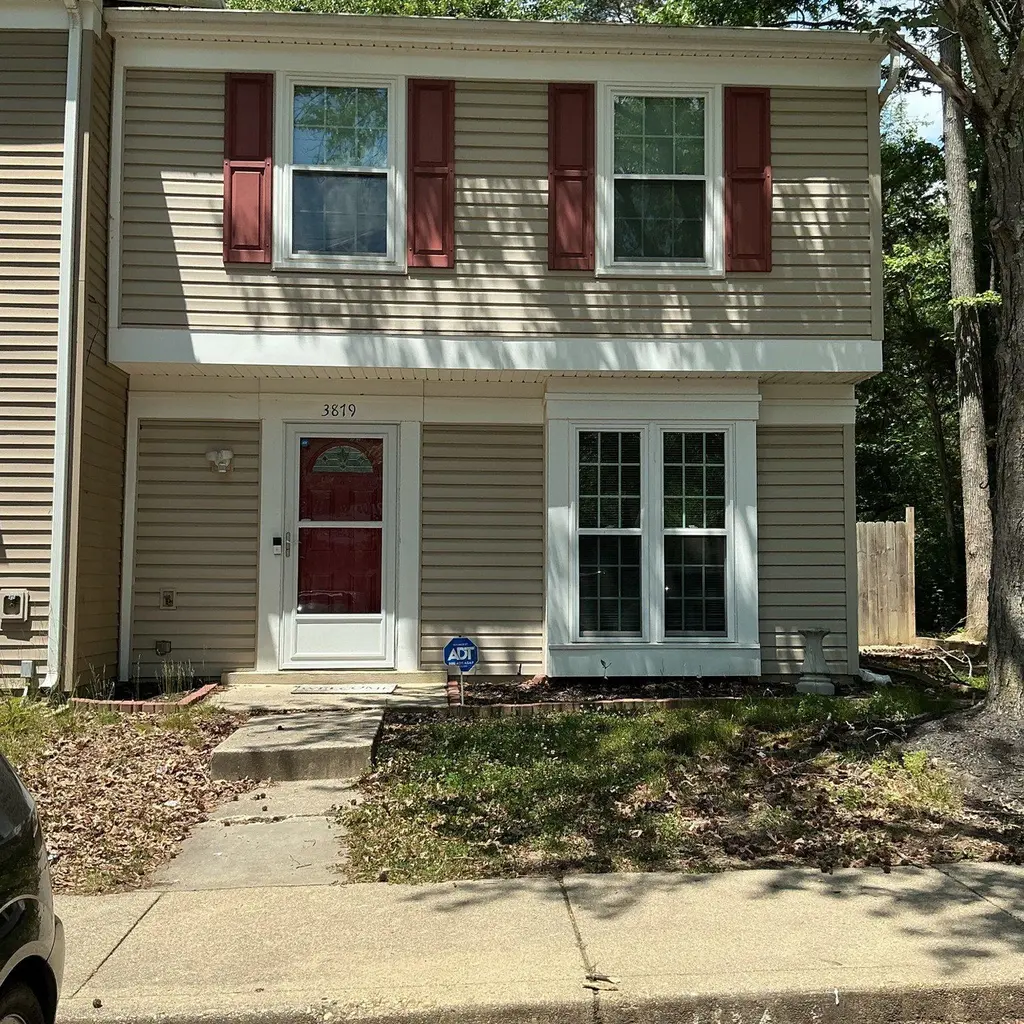
3879 Kearnys Inn Pl · Waldorf, MD
Flood risk 1/10 · Minimal
- FEMA flood zone
- X (unshaded)
- Chance of flooding over 30 yrs
- 0.0%
- Est. flood insurance / yr
- $507 – $1,088
Fire risk 4/10 · Minor
- Est. fire insurance / yr
- $755 – $1,403
Heat risk 7/10 · Major
- Hot days now (above 103°F)
- 7 days/yr
- Hot days in 30 yrs
- 15 days/yr
Wind risk 5/10 · Moderate
- Chance of severe wind over 30 yrs
- 25.0%
Air-quality risk 2/10 · Minimal
- Unhealthy air days now
- 1 days/yr
- Unhealthy air days in 30 yrs
- 2 days/yr
Risk factors via First Street. Map © Google.
Why this score? — see what drove the D+ grade
The composite is a weighted blend of 9 inputs, each scored 0–100. Each bar is that input's sub-score; the figure is the points it added to the 100-point composite (weight × sub-score).
- Cash flow +14.7/30.0
- ARV discount +12.0/15.0
- DSCR +4.5/10.0
- 1% rule +4.0/10.0
- Livability +3.6/5.0
- Rent growth +2.5/5.0
- Condition / age +2.5/5.0
- Schools +2.3/10.0
- Appreciation +0.0/10.0
$278,900
🖨 Deal sheet (PDF) 📄 Offer letter ✓ Due diligence
Listing remarks MLS
Financing fell though. More photos to come. You will not want to miss out on this great end-unit town home in sought after neighborhood. New bathrooms, wood floors, and carpet. Nice back yard with brand new wooden fence. Close to shopping. Convenient to DC, Andrews AFB, Navy Yard, and VA.
Key facts
- Private lot
- Eat-in kitchen
- Mature trees
Tags
Property features AI
Finance
- Other: Property is located within city limits
- Financial info: No investor or rental income details provided
- HOA & community: HOA fee of $371 charged annually
Exterior
- Parking: Two parking spaces in parking lot; Two total garage/parking spaces
- Security: No security details provided
- Utilities: Public water; Public septic; Electric service available
- Home design: End-of-row townhouse; Fee simple ownership; Year built estimated
- Construction: Aluminum siding; Slab foundation; Above grade structure
- Exterior features: Parking lot; Property is not on tidal water; Above-grade living area of approximately 1,200 (estimated)
Interior
- Kitchen: No kitchen appliance details provided
- Bedrooms: Three bedrooms on the upper level
- Flooring: No flooring details provided
- Bathrooms: One full bathroom on the upper level; One half bathroom on the main level
- Heating & cooling: Hot water heating; Electric heating fuel; Central air conditioning (electric)
- Interior features: Estimated living area; No basement
- Laundry & utility: No laundry details provided
Neighborhood map
What this means for you Summary
Snapshot
- This is a 3-bed/1.5-bath townhouse listed at $279k.
Deal economics
- At list price, monthly cash flow is $69 ($831/yr) — positive.
- The deal already cash-flows at list — no discount required.
- To meet the 1% rule (rent ≥ 1% of price), the offer needs to be $250k (10.2% below list).
- Recommended offer: $250k (10.2% below list) — sets the bar for 1% rule.
- Cap rate 6.6% vs local median 4.8% in Waldorf — top-decile yield for the area; either an underpriced asset or a hidden risk that comps aren't pricing in. Stress-test before assuming the spread holds.
Location & tenants
- Location reads 72/100 on livability (#141 in MD) — a middle-class / working-renter tenant base. Strengths: commute A+, employment A+, housing A+; Watch: crime D-, amenities F, cost of living F.
- Charles County Public Schools (suburban): math 13% / reading 29% proficiency, ranked #14 of 24 in MD (top 58%) — low school quality limits family demand, transient renter base, plan for 1-2y turnover.
- Zoned schools: Dr. Samuel A. Mudd Elementary School (math 4% / reading 11%, grade F, #681 of 860 statewide, top 81%, 555 students, 83% FRL); John Hanson Middle School (math 6% / reading 26%, grade F, #183 of 225 statewide, top 84%, 772 students, 60% FRL); Thomas Stone High School (math 13% / reading 35%, grade F, #168 of 222 statewide, top 76%, 1,177 students, 61% FRL) — zoned schools average 68% FRL vs 28% district-wide (40 pts higher); higher-poverty schools than district average — tighter screening recommended.
- Market conditions: 94 active listings in the ZIP; 17 comparable units currently listed for rent nearby; rentals at typical pace (median 26d on market — plan ~3-4 weeks tenant-placement turnaround); 41% of comp listings sitting > 30 days — soft ceiling on asking rent; solid renter incomes; 1,542 units permitted in Charles County in 2024 (516 in 5+ unit buildings).
Forward outlook
- Local home prices are declining (-3.0%/yr); year-one equity from $2k of loan paydown is wiped out by about $8k of value loss. Plan a longer hold.
- Charles County population projected at +27% by 2050 — long-run rental-demand tailwind backs the buy-and-hold thesis.
Negotiation context
- Only 8 days on market — expect competitive offers; lowballing is unlikely to land.
- 8 sale attempts since 25y ago with the ask held roughly flat each time — persistent listings suggest the price (not the market) is what's stuck; bring a comps-based counter.
Risks & watch-outs
- Climate carrying-cost: moderate wind risk, 25% chance of damaging wind over 30y; extreme-heat days projected 7→15/yr by 2055 (HVAC capex compounding) — expect insurance premiums to compound above CPI over the hold.
Questions for the listing agent
- What does the HOA fee cover, when was the last increase, and are there any pending special assessments or reserve-fund shortfalls?
- Is there a deadline driving the sale (1031 exchange, divorce, estate, relocation)? That informs how much negotiation room exists.
- Schools are D-rated, which usually means shorter tenancies and higher turnover. Who's the typical renter profile here, and what's been the actual vacancy rate?
- Crime grade is D in this area — have there been break-ins, vandalism, or insurance claims at this property in the last 3 years? What carrier currently insures it and at what premium?
- The area grade is low — what's the realistic commute time and amenity access for the typical tenant pool here? Any planned neighborhood developments (good or bad) we should know about?
- What's the average days-on-market for RENTAL listings here right now (not sales)? A rising rental-DOM trend means longer vacancies and softer asking-rent achievability than the comps imply.
- What's the recent tenant-quality profile in this submarket — average credit score on applications, eviction rate, late-payment / NSF rate, and stable-employment percentage? A property-management company in the area should have these aggregated.
- How much new for-sale + rental construction is in the pipeline within 1–3 miles? Heavy new supply typically softens prices + rents 12–24 months out; constrained supply supports both.
Investment metrics
- 1% rule
- 0.90% ✗
- Cap rate
- 6.59%
- Cash-on-cash
- 1.06%
- DSCR
- 1.05
- GRM
- 9.3
CMA / ARV
- ARV (on-the-fly)
- $309,600
- Comps found
- 12
Show comp detail 12 sales within ~0.75 mi
| Address | Dist | Beds/Ba | Sqft | Sold | Price | $/sf | Match |
|---|---|---|---|---|---|---|---|
| 3837 Kearnys Inn Pl | 0.05mi | 3/1.5 | 1,160 (-3%) | 2mo | $300,000 | $259 | 91 |
| 3729 Kempsford Field Pl | 0.15mi | 3/1.5 | 1,160 (-3%) | 1mo | $307,000 | $265 | 87 |
| 800-B Larkspur Ct Unit 7B | 0.26mi | 3/2.5 | 1,200 (0%) | 2mo | $295,000 | $246 | 82 |
| 723 Hatfield Ct | 0.26mi | 3/1.5 | 1,056 (-12%) | 1mo | $305,000 | $289 | 67 |
| 3243 Indian King Ct | 0.21mi | 4/1.0 (+1) | 1,085 (-10%) | 0mo | $310,000 | $286 | 67 |
| 3046 Heathcote Rd | 0.36mi | 3/2.0 | 1,034 (-14%) | 2mo | $309,000 | $299 | 56 |
| 3425 Milstead Ct | 0.69mi | 3/1.0 | 1,084 (-10%) | 2mo | $280,000 | $258 | 47 |
| 2409 Ferrell Ct | 0.67mi | 3/1.0 | 1,056 (-12%) | 0mo | $265,000 | $251 | 46 |
| 1050 Dorset Dr | 0.67mi | 3/1.5 | 1,380 (+15%) | 0mo | $329,000 | $238 | 44 |
| 2620 Ferguson Ct | 0.65mi | 3/1.0 | 1,040 (-13%) | 2mo | $265,000 | $255 | 44 |
| 1010 Victoria Pl | 0.68mi | 3/1.5 | 1,380 (+15%) | 2mo | $319,500 | $232 | 42 |
| 1039 Dorset Dr | 0.71mi | 3/2.5 | 1,380 (+15%) | 1mo | $350,000 | $254 | 37 |
Match score weights: distance 35% · size 25% · config 20% · recency 20%. Top-matched comps best support the ARV.
Projected returns pro-forma
-3.0% appreciation · 3.0% rent growth · sell at horizon
- IRR
- -14.6%
- Equity multiple
- 0.48×
- Total profit
- $-40,754
- Equity at exit
- $41,585
- IRR
- -5.9%
- Equity multiple
- 0.62×
- Total profit
- $-29,697
- Equity at exit
- $24,114
Cash invested: $78,092 (down + closing). Projections, not guarantees.
Landlord ↔ Tenant lean methodology
- Overall (STATE)
- 27 Tenant-Leaning
- State Maryland
- 27 Tenant-Leaning · D+14
- County
- — inherits STATE
- City
- — inherits STATE
ZIP-level market 20602
- Active inventory
- 94
- Price-to-rent
- 9.3×
Monthly cashflow live
- Estimated rent
- $2,505 high interval (Pro) →
- Mortgage (P&I)
- −$1,463
- Tax from tax record
- −$300 /mo · $3,596/yr
- Insurance
- −$116
- HOA
- −$31
- Vacancy / Maint / Mgmt
- −$526
- Net cashflow
- $69
Break-even live
Sensitivity live
| Price | -10% $227 | -5% $148 | +0% $69 | +5% $-10 | +10% $-89 |
|---|---|---|---|---|---|
| Rent | -10% $-129 | -5% $-30 | +0% $69 | +5% $168 | +10% $267 |
| Rate | -1.0pp $210 | -0.5pp $140 | base $69 | +0.5pp $-3 | +1.0pp $-77 |
UW: 25.0% down · 7.5% · 30yr · 1.5% tax · 5.0% vac · 8.0% maint · 8.0% mgmt
Financing live
Cash to close
- Down payment
- $69,725
- Closing costs
- $8,367
- Reserves months
- —
- Total cash needed
- —
Loan-product check · same deal, 3 products live
Conventional
25% down · 7.5% · 30yr
- Down + closing
- —
- Monthly P&I
- —
- Monthly cashflow
- —
- DSCR
- —
- Eligible?
- —
Personal DTI + credit; lowest rate.
DSCR
20% down · 8.5% · 30yr
- Down + closing
- —
- Monthly P&I
- —
- Monthly cashflow
- —
- DSCR
- —
- Eligible?
- —
No personal income docs; deal must DSCR.
Hard money
10% down · 12.0% · 12mo
- Down + closing
- —
- Monthly P&I
- —
- Monthly cashflow
- —
- DSCR
- —
- Eligible?
- —
Short-term bridge; refi at stabilization.
Rent comps 17 comps
| Address | Beds | Baths | Sqft | Rent | $/sqft | DOM | Units | Dist |
|---|---|---|---|---|---|---|---|---|
| 3379 Justice Ct Waldorf, MD | 3.0 | 1.5 | 1085 | $1,975 | $1.82 | 7d | 1 | 0.21mi |
| 3053 Heathcote Rd Waldorf, MD | 3.0 | 1.5 | 1034 | $2,300 | $2.22 | 45d | 1 | 0.33mi |
| 3125 Heathcote Rd Waldorf, MD | 3.0 | 1.0 | 1034 | $1,995 | $1.93 | 45d | 1 | 0.42mi |
| 2094 Chapelside Ct Waldorf, MD | 3.0 | 2.0 | 1432 | $2,900 | $2.03 | 45d | 1 | 0.46mi |
| 3975 Wintergreen Pl Waldorf, MD | 3.0 | 2.0 | 1240 | $2,400 | $1.94 | 26d | 1 | 0.68mi |
| 12151 Ell Ln Waldorf, MD | 2.0 | 2.0 | 840 | $1,695 | $2.02 | 7d | 1 | 0.71mi |
| 1015 Copperfield Ct Waldorf, MD | 3.0 | 2.5 | 1380 | $2,600 | $1.88 | 24d | 1 | 0.80mi |
| 1718 Brightwell Ct Waldorf, MD | 3.0 | 1.5 | 1056 | $2,195 | $2.08 | 24d | 1 | 0.83mi |
| 2619 Rooks Head Pl Waldorf, MD | 3.0 | 1.5 | 1188 | $2,500 | $2.10 | 45d | 1 | 0.85mi |
| 3454 Tamarack Ct Waldorf, MD | 4.0 | 2.0 | 1368 | $2,900 | $2.12 | 45d | 1 | 0.89mi |
| 3381 Ryon Ct Waldorf, MD | 3.0 | 1.5 | 1232 | $2,200 | $1.79 | 13d | 1 | 0.92mi |
| 4503 Ruston Pl Unit 43M Waldorf, MD | 3.0 | 1.5 | 1076 | $2,300 | $2.14 | 13d | 1 | 0.95mi |
| 1001 Tyler Ct Waldorf, MD | 3.0 | 1.5 | 1315 | $2,600 | $1.98 | 24d | 1 | 0.97mi |
| 12111 Fielding Pl Waldorf, MD | 3.0 | 2.5 | 1835 | $3,270 | $1.78 | 7d | 7 | 0.99mi |
| 4703 Rookewood Pl Unit 28K Waldorf, MD | 3.0 | 2.5 | 1350 | $2,500 | $1.85 | 45d | 1 | 1.03mi |
| 30 Keepsake Pl Waldorf, MD | 3.0 | 1.5 | 1344 | $2,000 | $1.49 | 26d | 1 | 1.03mi |
| 3281 Ryon Ct Waldorf, MD | 3.0 | 1.5 | 1232 | $2,299 | $1.87 | 45d | 1 | 1.04mi |
HOA detail
- Monthly dues
- $31 · $372/yr
Listing history 6 events
-
2026-06-18days on market $278,900 Active 8 DOM
-
2026-06-17days on market $278,900 Active 7 DOM
-
2026-06-16days on market $278,900 Active 6 DOM
-
2026-06-15days on market $278,900 Active 5 DOM
-
2026-06-13remarks 699-char remark
-
2026-06-13$278,900 Active 3 DOM
ⓘ Source: listings_history table (triggers on properties + properties_extension) + one-shot
backfill from property_details.listing_events for pre-trigger history.
Tax reassessment forecast MD · Partial reset (capped growth)
- Current annual tax
- $3,596 · $300/mo
- Projected year-2 tax
- $3,596 · $300/mo
- Expected delta
- $0/yr ($0/mo · 0.0%)
ⓘ Screening estimate from a state-policy table — verify with the county assessor before closing.
Climate risk First Street
- Flood 1/10 Low FEMA zone X (unshaded) · 0% chance over 30 yrs
- Wildfire 4/10 Moderate
- Heat 7/10 Severe 7 d/yr ≥103°F today · 15 d/yr by 30 yrs out
- Wind 5/10 Major 25% chance of damaging wind over 30 yrs
- Air quality 2/10 Low 1 unhealthy d/yr today · 2 by 30 yrs out
Nearby sold comps map
Loading sold comps map…
Walkable amenities ~0.75 mi
Loading nearby amenities…
Taxation est. · year 1
- Rental income
- $30,057
- − Mortgage interest
- −$15,623
- − Property taxes
- −$3,596
- − Insurance
- −$1,394
- − Repairs & maintenance
- −$2,405
- − Management
- −$2,405
- − HOA
- −$372
- − Depreciation
- −$8,113
- Taxable loss
- −$3,851
- Est. tax savings @ 24.0%
- +$924
- After-tax cash flow
- $1,756/yr
For passive investors: Depreciation is non-cash, so a rental often shows a tax loss while cash-flowing — sheltering income. Rental losses are passive: they offset passive income freely, and up to $25,000/yr can offset ordinary (W-2) income if you actively participate and your MAGI is under $100k (phasing out to $0 by $150k); unused losses carry forward. On sale, claimed depreciation is recaptured at up to 25%, and gains may owe capital-gains tax (a 1031 exchange can defer both). Figures are a year-1 estimate at your 24.0% rate — not tax advice; consult a CPA.
Schools (NCES district)
- District
- Charles County Public Schools
- NCES district ID
- 2400270
- Math proficiency
- 13% ▼ -19.00%
- Reading proficiency
- 29% ▼ -13.00%
- Median HH income
- $90,389
- Composite
- 22.54/100
- National rank
- #8087
- State rank
- #14 of 24 in MD
Livability — Waldorf
- Score
- 72/100
- State rank
- #141
- US rank
- #6083
Category grades
Schools grade is shown separately in the Schools card above.
Census & demographics
- Census place
- Waldorf, MD
- County
- Charles County · 103,527 people
- City population
- 103,527
- Metro
- Washington-Arlington-Alexandria, DC-VA-MD-WV
- Population (ZIP)
- 28,331
- Household income
- $107,360
- Rent vs Own
- Severe rent burden
- 867.0
Population outlook (Charles County) Hauer SSP2
- Today (2025)
- 176,616 people
- By 2030
- 186,471 · +5.6%
- By 2040
- 206,472 · +16.9%
- By 2050
- 224,883 · +27.3%
- By 2075
- 272,101 · +54.1%
- By 2100
- 303,564 · +71.9%
Race, ethnicity, and origin ACS 2023
- Neighborhood character
- Diverse neighborhood (Simpson 0.57)
- Race & ethnicity
- Black 62% White 19% Two or more races 11% Hispanic / Latino 9% Asian 2%
- Hispanic origin (detail)
- Common ancestry
- Lithuanian 1% Iranian 1% Italian 1%
- Foreign-born
- 11% · Canada, South Korea, Jamaica
- Languages at home
- 88% English-only · Spanish 6% Other Indo-European 1% Tagalog/Filipino 1%
Political lean MEDSL · Charles
- 2024 margin
- Solid D (+40.7) · D 69.2% · R 28.5% · Other 2.2%
- 2008→2024 swing
- +15.2pp toward D · 2008: 25.5pp · 2024: 40.7pp
- All cycles
- 2024: D+40.7 2020: D+40.9 2016: D+30.2 2012: D+31.3 2008: D+25.5
Not yet ingested
- Civics
- —
Market trends
- HPI YoY
- ▼ -261.39%
- Current HPI
- 267.3445
- Rent YoY
- —
- Metro
- Washington-Arlington-Alexandria, DC-VA-MD-WV
- State GDP YoY
- ▲ 2.97%
- F500 in state
- 12
Industry mix (Fortune 500 HQ in MD)
| Industry | F500 HQs | Revenue |
|---|---|---|
| Aerospace / Defense | 1 | $71B |
|
||
| Utilities | 1 | $25B |
|
||
| Hotels | 1 | $24B |
|
||
| Consumer Goods | 1 | $7B |
|
||
| Real Estate | 1 | $6B |
|
||
| Chemicals | 1 | $2B |
|
||
Price history
+431.2% since first listed27 events — show timeline
- 2026-06-10 Listed $278,900 BRIGHT MLS
- 2022-10-11 Sold (Public Records) $280,000 Public Records
- 2022-09-09 Sold (MLS) $280,000 BRIGHT MLS
- 2022-08-09 Contingent — BRIGHT MLS
- 2022-06-22 Price Changed $285,000 BRIGHT MLS
- 2022-06-22 Relisted — BRIGHT MLS
- 2022-06-15 Price Changed $290,500 BRIGHT MLS
- 2022-06-15 Relisted — BRIGHT MLS
- 2022-06-13 Listing Removed — BRIGHT MLS
- 2022-06-04 Listed $285,500 BRIGHT MLS
- 2021-03-30 Sold (MLS) $240,000 BRIGHT MLS
- 2021-02-20 Pending — BRIGHT MLS
- 2021-02-08 Contingent — BRIGHT MLS
- 2021-01-10 Listed $240,000 BRIGHT MLS
- 2017-10-03 Sold (Public Records) $150,000 Public Records
- 2017-09-25 Sold (MLS) $150,000 MRIS
- 2017-09-25 Sold (MLS) $150,000 BRIGHT MLS
- 2017-08-18 Pending — MRIS
- 2017-08-14 Relisted — MRIS
- 2017-03-28 Pending — MRIS
- 2017-03-19 Listed $150,000 MRIS
- 2001-12-12 Sold (Public Records) $94,900 Public Records
- 2001-11-28 Sold (MLS) $94,900 MRIS
- 2001-11-12 Delisted — MRIS
- 2001-11-02 Listed $94,900 MRIS
- 1986-11-19 Sold (Public Records) $67,990 Public Records
- 1982-12-03 Sold (Public Records) $52,500 Public Records
Property tax history
+6.1%/yrLatest (2025): $3,596 · +9.3% YoY. Source: county tax records.
Cash-flow waterfall
monthlySold comps — $/sqft
last 12 mo · ≤1 miLoading sold comps…