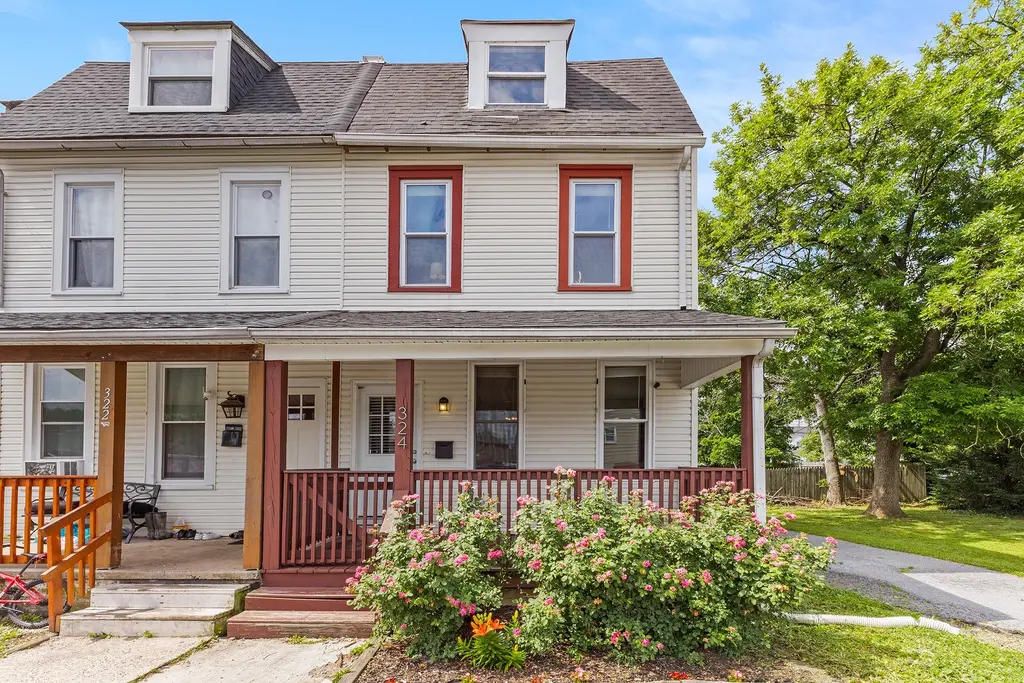
324 Ash St · Stowe, PA
Flood risk 1/10 · Minimal
- FEMA flood zone
- X (unshaded)
- Chance of flooding over 30 yrs
- 0.0%
- Est. flood insurance / yr
- $473 – $860
Fire risk 3/10 · Minor
- Est. fire insurance / yr
- $511 – $949
Heat risk 6/10 · Moderate
- Hot days now (above 101°F)
- 7 days/yr
- Hot days in 30 yrs
- 16 days/yr
Wind risk 4/10 · Minor
- Chance of severe wind over 30 yrs
- 19.0%
Air-quality risk 3/10 · Minor
- Unhealthy air days now
- 2 days/yr
- Unhealthy air days in 30 yrs
- 4 days/yr
Risk factors via First Street. Map © Google.
Why this score? — see what drove the F grade
The composite is a weighted blend of 9 inputs, each scored 0–100. Each bar is that input's sub-score; the figure is the points it added to the 100-point composite (weight × sub-score).
- Cash flow +8.0/30.0
- ARV discount +7.5/15.0
- Livability +3.8/5.0
- Rent growth +3.7/5.0
- Schools +3.6/10.0
- 1% rule +2.6/10.0
- Condition / age +2.5/5.0
- DSCR +2.1/10.0
- Appreciation +0.0/10.0
$250,000
🖨 Deal sheet (PDF) 📄 Offer letter ✓ Due diligence
Listing remarks MLS
NEW, NEW, NEW! Completely rehabbed twin in Stowe. Interior has been completely renovated with NEW laminate flooring and carpeting, fresh paint, newer windows, NEW hot water heater, NEW doors and completely remodeled kitchen with brand NEW appliances. Main floor laundry. Wide covered front porch. Located in Pottsgrove School District. The house sits on over-sized corner lot with fenced in backyard and large tree covered side yard. Plenty of parking available on driveway or on front or side street. ONE YEAR HOME WARRANTY provided with acceptable offer.
Key facts
- Covered front porch
- Storage shed
- Outdoor patio
Tags
Property features AI
Exterior
- Parking: Driveway parking for three vehicles (total garage and parking spaces: 3)
- Utilities: Public water; Public sewer; Electric service for heating, cooling, and hot water
- Home design: Semi-detached home; Single entry level (above-grade finished area reported)
- Construction: Vinyl siding; Shingle roof; Concrete perimeter foundation; Built year reported by assessor
- Exterior features: Lot dimensions approximately 60 x 0; No tidal water
Interior
- Kitchen: Dishwasher; Self-cleaning oven; Electric oven/range; Built-in microwave; Refrigerator
- Bedrooms: Three bedrooms on the first upper level; Two bedrooms on the second upper level
- Bathrooms: One full bathroom (upper level); One half bathroom (main level)
- Heating & cooling: Central air conditioning (electric); Electric baseboard heating; Central heating; Electric hot water
- Interior features: Full, unfinished basement; Porch(es) and patio(s)
- Laundry & utility: Main floor laundry
Neighborhood map
What this means for you Summary
Snapshot
- This is a 3-bed/1.0-bath townhouse listed at $250k.
Deal economics
- At list price, monthly cash flow is $-253 ($-3k/yr) — negative.
- To cash-flow at today's rent, offer at most $205k (17.8% below list).
- To meet the 1% rule (rent ≥ 1% of price), the offer needs to be $190k (24.2% below list).
- Recommended offer: $190k (24.2% below list) — sets the bar for 1% rule.
Location & tenants
- Location reads 75/100 on livability (#441 in PA, #4,019 nationally) — a middle-class / working-renter tenant base. Strengths: crime A+, cost of living A+, housing A+; Watch: amenities F, commute F.
- Pottsgrove SD (suburban): math 29% / reading 50% proficiency, ranked #318 of 539 in PA (top 59%) — families likely to look elsewhere, expect single-tenant / working-renter base with shorter leases.
- Zoned schools: Lower Pottsgrove El Sch (math 30% / reading 49%, grade F, #947 of 1,518 statewide, top 65%, 661 students, 48% FRL); Pottsgrove Ms (math 17% / reading 51%, grade F, #334 of 512 statewide, top 67%, 697 students, 49% FRL); Pottsgrove Shs (math 60% / reading 30%, grade D-, #192 of 437 statewide, top 44%, 1,021 students, 34% FRL).
- Market conditions: Rents rising fast (+4.9%/yr); 213 active listings in the ZIP; solid renter incomes; 1,936 units permitted in Montgomery County in 2024 (530 in 5+ unit buildings).
Forward outlook
- Local home prices are declining (-3.0%/yr); year-one equity from $2k of loan paydown is wiped out by about $8k of value loss. Plan a longer hold.
- Montgomery County population projected at +5% by 2050 — modest demand growth; plan on rents tracking national, not racing it.
Negotiation context
- Only 2 days on market — expect competitive offers; lowballing is unlikely to land.
- 12 sale attempts since 27y ago with the ask held roughly flat each time — persistent listings suggest the price (not the market) is what's stuck; bring a comps-based counter.
- Current owner paid $180k; 39% above their basis — modest negotiation headroom, anchor on the comps not their cost.
Risks & watch-outs
- Watch-outs: built in 1880 — expect roof / HVAC / electrical / plumbing capex.
- Climate carrying-cost: extreme-heat days projected 7→16/yr by 2055 (HVAC capex compounding) — expect insurance premiums to compound above CPI over the hold.
Questions for the listing agent
- What do current leases actually rent for vs. the listed asking? Can we see a recent rent roll and the last 12 months of T-12 income?
- Built in 1880 — when were the roof, HVAC, electrical panel, plumbing, and water heater last replaced?
- Is there a deadline driving the sale (1031 exchange, divorce, estate, relocation)? That informs how much negotiation room exists.
- The area grade is low — what's the realistic commute time and amenity access for the typical tenant pool here? Any planned neighborhood developments (good or bad) we should know about?
- What's the average days-on-market for RENTAL listings here right now (not sales)? A rising rental-DOM trend means longer vacancies and softer asking-rent achievability than the comps imply.
- What's the recent tenant-quality profile in this submarket — average credit score on applications, eviction rate, late-payment / NSF rate, and stable-employment percentage? A property-management company in the area should have these aggregated.
- How much new for-sale + rental construction is in the pipeline within 1–3 miles? Heavy new supply typically softens prices + rents 12–24 months out; constrained supply supports both.
Investment metrics
- 1% rule
- 0.76% ✗
- Cap rate
- 5.08%
- Cash-on-cash
- -4.33%
- DSCR
- 0.81
- GRM
- 11.0
CMA / ARV
- ARV (on-the-fly)
- $249,772
- Comps found
- 11
Show comp detail 11 sales within ~0.75 mi
| Address | Dist | Beds/Ba | Sqft | Sold | Price | $/sf | Match |
|---|---|---|---|---|---|---|---|
| 326 W Race | 0.07mi | 2/2.0 (-1) | 1,428 (-6%) | 10mo | $260,000 | $182 | 69 |
| 122 Jay St | 0.22mi | 3/1.5 | 1,420 (-7%) | 14mo | $225,000 | $158 | 65 |
| 316 Glasgow St | 0.43mi | 3/1.5 | 1,440 (-5%) | 9mo | $226,000 | $157 | 61 |
| 624 E Howard St | 0.65mi | 3/1.0 | 1,502 (-1%) | 8mo | $250,000 | $166 | 61 |
| 554 W Walnut St | 0.64mi | 3/1.5 | 1,536 (+1%) | 11mo | $220,000 | $143 | 57 |
| 326 E Vine St | 0.42mi | 3/2.0 | 1,403 (-8%) | 8mo | $245,000 | $175 | 57 |
| 624 Holly Dr | 0.51mi | 3/2.0 | 1,536 (+1%) | 19mo | $252,000 | $164 | 55 |
| 18 W Vine St | 0.12mi | 3/1.5 | 1,320 (-13%) | 22mo | $225,000 | $170 | 52 |
| 511 E Vine St | 0.52mi | 3/2.0 | 1,323 (-13%) | 2mo | $282,500 | $214 | 48 |
| 556 W Walnut St | 0.64mi | 4/1.5 (+1) | 1,680 (+10%) | 11mo | $245,000 | $146 | 36 |
| 7 Quinter St | 0.39mi | 4/2.0 (+1) | 1,344 (-12%) | 22mo | $205,000 | $153 | 34 |
Match score weights: distance 35% · size 25% · config 20% · recency 20%. Top-matched comps best support the ARV.
Projected returns pro-forma
-3.0% appreciation · 4.93% rent growth · sell at horizon
- IRR
- -21.4%
- Equity multiple
- 0.25×
- Total profit
- $-52,805
- Equity at exit
- $37,276
- IRR
- -11.1%
- Equity multiple
- 0.28×
- Total profit
- $-50,515
- Equity at exit
- $21,615
Cash invested: $70,000 (down + closing). Projections, not guarantees.
Landlord ↔ Tenant lean methodology
- Overall (STATE)
- 62 Landlord-Friendly
- State Pennsylvania
- 62 Landlord-Friendly · EVEN
- County
- — inherits STATE
- City
- — inherits STATE
ZIP-level market 19464
- Rents YoY
- 4.9%
- Active inventory
- 213
- Price-to-rent
- 11.0×
Monthly cashflow live
- Estimated rent
- $1,895 medium interval (Pro) →
- Mortgage (P&I)
- −$1,311
- Tax from tax record
- −$335 /mo · $4,014/yr
- Insurance
- −$104
- HOA
- −$0
- Vacancy / Maint / Mgmt
- −$398
- Net cashflow
- $-253
Break-even live
Sensitivity live
| Price | -10% $-111 | -5% $-182 | +0% $-253 | +5% $-323 | +10% $-394 |
|---|---|---|---|---|---|
| Rent | -10% $-402 | -5% $-327 | +0% $-253 | +5% $-178 | +10% $-103 |
| Rate | -1.0pp $-127 | -0.5pp $-189 | base $-253 | +0.5pp $-317 | +1.0pp $-383 |
UW: 25.0% down · 7.5% · 30yr · 1.5% tax · 5.0% vac · 8.0% maint · 8.0% mgmt
Financing live
Cash to close
- Down payment
- $62,500
- Closing costs
- $7,500
- Reserves months
- —
- Total cash needed
- —
Loan-product check · same deal, 3 products live
Conventional
25% down · 7.5% · 30yr
- Down + closing
- —
- Monthly P&I
- —
- Monthly cashflow
- —
- DSCR
- —
- Eligible?
- —
Personal DTI + credit; lowest rate.
DSCR
20% down · 8.5% · 30yr
- Down + closing
- —
- Monthly P&I
- —
- Monthly cashflow
- —
- DSCR
- —
- Eligible?
- —
No personal income docs; deal must DSCR.
Hard money
10% down · 12.0% · 12mo
- Down + closing
- —
- Monthly P&I
- —
- Monthly cashflow
- —
- DSCR
- —
- Eligible?
- —
Short-term bridge; refi at stabilization.
Listing history 2 events
-
2026-06-21remarks 693-char remark
-
2026-06-21$250,000 Active 2 DOM
ⓘ Source: listings_history table (triggers on properties + properties_extension) + one-shot
backfill from property_details.listing_events for pre-trigger history.
Tax reassessment forecast PA · Partial reset (capped growth)
- Current annual tax
- $4,014 · $335/mo
- Projected year-2 tax
- $4,014 · $335/mo
- Expected delta
- $0/yr ($0/mo · 0.0%)
ⓘ Screening estimate from a state-policy table — verify with the county assessor before closing.
Climate risk First Street
- Flood 1/10 Low FEMA zone X (unshaded) · 0% chance over 30 yrs
- Wildfire 3/10 Moderate
- Heat 6/10 Major 7 d/yr ≥101°F today · 16 d/yr by 30 yrs out
- Wind 4/10 Moderate 19% chance of damaging wind over 30 yrs
- Air quality 3/10 Moderate 2 unhealthy d/yr today · 4 by 30 yrs out
Nearby sold comps map
Loading sold comps map…
Walkable amenities ~0.75 mi
Loading nearby amenities…
Taxation est. · year 1
- Rental income
- $22,741
- − Mortgage interest
- −$14,004
- − Property taxes
- −$4,014
- − Insurance
- −$1,250
- − Repairs & maintenance
- −$1,819
- − Management
- −$1,819
- − Depreciation
- −$7,273
- Taxable loss
- −$7,438
- Est. tax savings @ 24.0%
- +$1,785
- After-tax cash flow
- $-1,246/yr
For passive investors: Depreciation is non-cash, so a rental often shows a tax loss while cash-flowing — sheltering income. Rental losses are passive: they offset passive income freely, and up to $25,000/yr can offset ordinary (W-2) income if you actively participate and your MAGI is under $100k (phasing out to $0 by $150k); unused losses carry forward. On sale, claimed depreciation is recaptured at up to 25%, and gains may owe capital-gains tax (a 1031 exchange can defer both). Figures are a year-1 estimate at your 24.0% rate — not tax advice; consult a CPA.
Schools (NCES district)
- District
- Pottsgrove SD
- NCES district ID
- 4219650
- Math proficiency
- 29% ▼ -18.00%
- Reading proficiency
- 50% ▼ -14.00%
- Median HH income
- $71,814
- Composite
- 36.08/100
- National rank
- #4763
- State rank
- #318 of 539 in PA
Livability — Stowe
- Score
- 75/100
- State rank
- #441
- US rank
- #4019
Category grades
Schools grade is shown separately in the Schools card above.
Census & demographics
- Census place
- Stowe, PA
- County
- Montgomery County · 712,331 people
- Metro
- Philadelphia-Camden-Wilmington, PA-NJ-DE-MD
- Population (ZIP)
- 49,101
- Household income
- $79,787
- Rent vs Own
- Severe rent burden
- 1797.0
Population outlook (Montgomery County) Hauer SSP2
- Today (2025)
- 856,074 people
- By 2030
- 870,887 · +1.7%
- By 2040
- 891,195 · +4.1%
- By 2050
- 896,417 · +4.7%
- By 2075
- 903,212 · +5.5%
- By 2100
- 843,240 · -1.5%
Race, ethnicity, and origin ACS 2023
- Neighborhood character
- Predominantly White (69%)
- Race & ethnicity
- White 69% Black 15% Two or more races 9% Hispanic / Latino 9% Asian 2%
- Hispanic origin (detail)
- Mexican 2% Puerto Rican 5%
- Common ancestry
- Romanian 7% Polish 2% Iranian 2%
- Foreign-born
- 6% · Canada, China
- Languages at home
- 92% English-only · Spanish 4% Arabic 1% Other Indo-European 1%
Political lean MEDSL · Montgomery
- 2024 margin
- Strong D (+22.8) · D 60.9% · R 38.1% · Other 1.1%
- 2008→2024 swing
- +2.0pp toward D · 2008: 20.8pp · 2024: 22.8pp
- All cycles
- 2024: D+22.8 2020: D+26.3 2016: D+21.1 2012: D+14.3 2008: D+20.8
Not yet ingested
- Civics
- —
Market trends
- HPI YoY
- ▼ -253.73%
- Current HPI
- 271.9399
- Rent YoY
- ▲ 4.93%
- Metro
- Philadelphia-Camden-Wilmington, PA-NJ-DE-MD
- State GDP YoY
- ▲ 1.68%
- F500 in state
- 34
Industry mix (Fortune 500 HQ in PA)
| Industry | F500 HQs | Revenue |
|---|---|---|
| Healthcare | 2 | $309B |
|
||
| Insurance | 2 | $27B |
|
||
| Telecommunications / Media | 1 | $124B |
|
||
| Industrial Distribution | 1 | $22B |
|
||
| Financial Services | 1 | $20B |
|
||
| Chemicals / Materials | 1 | $18B |
|
||
Price history
+1090.5% since first listed37 events — show timeline
- 2026-06-19 Listed $250,000 BRIGHT MLS
- 2021-08-26 Sold (Public Records) $180,000 Public Records
- 2021-07-09 Listed $180,000 BRIGHT MLS
- 2021-07-09 Sold (MLS) $180,000 BRIGHT MLS
- 2014-06-26 Sold (Public Records) $118,000 Public Records
- 2014-06-12 Sold (MLS) $118,000 TREND
- 2014-06-12 Sold (MLS) $118,000 BRIGHT MLS
- 2014-06-05 Delisted — TREND
- 2014-06-04 Sold (MLS) $118,000 TREND
- 2014-04-25 Pending — TREND
- 2014-04-24 Listing Removed — BRIGHT MLS
- 2014-04-22 Pending — TREND
- 2014-04-22 Relisted — TREND
- 2014-04-22 Pending — TREND
- 2014-04-22 Price Changed $118,000 TREND
- 2014-04-02 Listed $125,000 TREND
- 2014-04-01 Listed $118,000 BRIGHT MLS
- 2013-12-12 Sold (MLS) $44,223 TREND
- 2013-12-12 Sold (MLS) $44,223 BRIGHT MLS
- 2013-11-22 Pending — TREND
- 2013-11-13 Listing Removed — BRIGHT MLS
- 2013-10-04 Listed $49,000 TREND
- 2013-10-04 Listed $49,000 BRIGHT MLS
- 2005-10-24 Sold (Public Records) $125,000 Public Records
- 2005-10-17 Sold (MLS) $125,000 BRIGHT MLS
- 2005-07-26 Listing Removed — BRIGHT MLS
- 2005-07-09 Listed $125,000 BRIGHT MLS
- 2002-06-28 Sold (MLS) $81,000 BRIGHT MLS
- 2002-05-07 Listing Removed — BRIGHT MLS
- 2002-02-14 Listed $81,000 BRIGHT MLS
- 2000-09-26 Listing Removed — BRIGHT MLS
- 2000-09-18 Listed $25,500 BRIGHT MLS
- 1999-12-08 Listing Removed — BRIGHT MLS
- 1999-12-08 Listed $49,900 BRIGHT MLS
- 1999-12-07 Listed $39,900 BRIGHT MLS
- 1999-12-07 Listing Removed — BRIGHT MLS
- 1982-07-27 Sold (Public Records) $21,000 Public Records
Property tax history
+2.4%/yrLatest (2026): $4,014 · +8.6% YoY. Source: county tax records.
Cash-flow waterfall
monthlySold comps — $/sqft
last 12 mo · ≤1 miLoading sold comps…