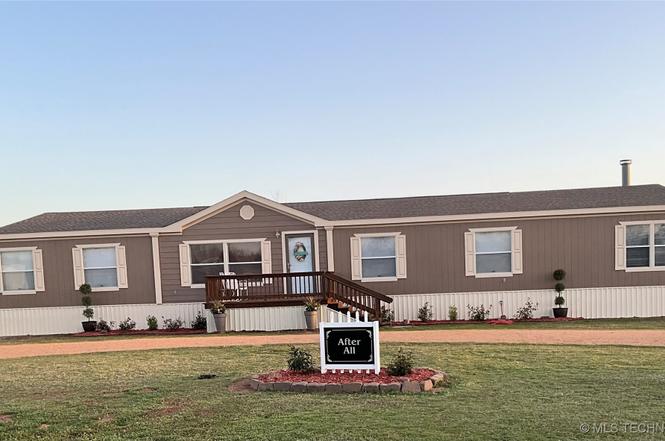
14115 Whispering Mdws · Sherwood Shores, TX
Flood risk 1/10 · Minimal
- FEMA flood zone
- —
- Chance of flooding over 30 yrs
- 0.0%
- Est. flood insurance / yr
- —
Fire risk 4/10 · Minor
- Est. fire insurance / yr
- $2,463 – $4,575
Heat risk 6/10 · Moderate
- Hot days now (above 110°F)
- 7 days/yr
- Hot days in 30 yrs
- 21 days/yr
Wind risk 4/10 · Minor
- Chance of severe wind over 30 yrs
- 19.0%
Air-quality risk 3/10 · Minor
- Unhealthy air days now
- 3 days/yr
- Unhealthy air days in 30 yrs
- 3 days/yr
Risk factors via First Street. Map © Google.
Why this score? — see what drove the C grade
The composite is a weighted blend of 9 inputs, each scored 0–100. Each bar is that input's sub-score; the figure is the points it added to the 100-point composite (weight × sub-score).
- Cash flow +19.8/30.0
- Appreciation +10.0/10.0
- ARV discount +7.5/15.0
- DSCR +6.3/10.0
- 1% rule +4.1/10.0
- Rent growth +2.5/5.0
- Schools +2.5/10.0
- Livability +2.5/5.0
- Condition / age +2.5/5.0
$249,000
🖨 Deal sheet (PDF) 📄 Offer letter ✓ Due diligence
Listing remarks
This Beautiful Spacious Home with a 30x40 Insulated shop is LESS than 1 mile from the Boat dock and The Anchor, where you will find great food and Entertainment. This Beauty is Situated in the Buncombe Creek Community at Beautiful Lake Texoma. Very conveniently located on a quiet cul-de-sac in Twin Ponds golf cart community, you can Hop on your golf cart and go to the beaches, Marina or Restaurant. Upon entering, you are greeted with a Large open living room with a nice flow into the dining area. Adjacent to the living area is a breakfast bar that enhances the home’s entertainment potential. The family kitchen is well appointed with plenty of counter space & lots of cabinets pr
Key facts
- Quiet cul-de-sac
- Golf cart community
- Ensuite bathroom
Tags
Property features AI
Finance
- Other: Located less than 1 mile to Texoma Lake with boat dock/slip, lake and river access
Exterior
- Parking: Detached garage with workshop and storage; 3-car garage
- Security: Smoke detector(s); No safety shelter
- Utilities: Electricity available; Water available (rural); Septic tank; Satellite internet available
- Home design: Manufactured double-wide home; Single-story; Faces north; Tie-down foundation
- Construction: Wood siding; Asphalt/fiberglass roof; Built as a manufactured home
- Exterior features: Deck; Porch; Gravel driveway; Landscaping; Satellite dish; Storage; Workshop
Interior
- Kitchen: Country-style eat-in kitchen; Built-in range; Built-in oven; Oven; Range; Dishwasher; Refrigerator; Icemaker / plumbed for icemaker; Electric water heater; Electric oven/range connections
- Bedrooms: Four bedrooms with walk-in closets; Primary bedroom with private bath and walk-in closet
- Flooring: Carpet; Vinyl
- Bathrooms: Two full bathrooms; Hall bath with bathtub
- Heating & cooling: Central heating (electric); Central air conditioning
- Interior features: High ceilings; Laminate counters; Ceiling fan(s); Programmable thermostat; Accessible doors; Storm door(s); Aluminum frame windows
- Laundry & utility: Utility room (first level); Washer hookup; Electric dryer hookup
Neighborhood map
What this means for you Summary
Snapshot
- This is a 4-bed/2.0-bath manufactured listed at $249k.
Deal economics
- At list price, monthly cash flow is $295 ($4k/yr) — positive.
- The deal already cash-flows at list — no discount required.
- To meet the 1% rule (rent ≥ 1% of price), the offer needs to be $226k (9.1% below list).
- Recommended offer: $219k (12.0% below list) — sets the bar for market timing.
- Cap rate 7.7% vs local median 2.9% in Sherwood Shores — top-decile yield for the area; either an underpriced asset or a hidden risk that comps aren't pricing in. Stress-test before assuming the spread holds.
Location & tenants
- Location reads 49/100 on livability (#1,519 in TX) — a working-class tenant base; expect higher turnover. Strengths: cost of living A+, housing A+; Watch: crime F, amenities F, commute F.
- Kingston (rural): math 27% / reading 32% proficiency, ranked #70 of 270 in OK (top 26%) — low school quality limits family demand, transient renter base, plan for 1-2y turnover; 76% free/reduced lunch — lower-income household profile, screen leases tightly.
- Zoned schools: Kingston Es (math 33% / reading 32%, grade F, #210 of 845 statewide, top 25%, 620 students, 0% FRL); Kingston Ms (math 23% / reading 34%, grade F, #57 of 345 statewide, top 18%, 286 students, 0% FRL); Kingston Hs (math 22% / reading 27%, grade F, #150 of 447 statewide, top 48%, 362 students, 0% FRL) — zoned schools average 0% FRL vs 76% district-wide (76 pts lower); this property's tenant base skews higher-income than the district average.
- Market conditions: 42 units permitted in Marshall County in 2024 (0 in 5+ unit buildings).
Forward outlook
- In year one you build about $27k of equity ($2k loan paydown + $25k appreciation (10.0% local appreciation)).
- Marshall County population projected at +22% by 2050 — long-run rental-demand tailwind backs the buy-and-hold thesis.
- At projected returns (10.0% appreciation + 3.0% rent growth), your $70k cash investment doubles in ~3 years — after that, you're playing with house money.
- By year 2, paydown + projected appreciation supports a ~$43k cash-out refi (75% LTV) — recoverable capital for the next deal without selling this one.
Negotiation context
- It's been on market 153 days — a 12% lower offer ($219k) is reasonable based on typical stale-listing flexibility.
- 4 sale attempts since 13y ago with the ask held roughly flat each time — persistent listings suggest the price (not the market) is what's stuck; bring a comps-based counter.
- Current owner paid $59k; list at $249k implies a 322% gain — meaningful room to come down on a strong offer.
Risks & watch-outs
- Climate carrying-cost: extreme-heat days projected 7→21/yr by 2055 (HVAC capex compounding) — expect insurance premiums to compound above CPI over the hold.
Questions for the listing agent
- It's been on market 153 days. Have you received any prior offers? Is the seller open to a 12% concession, seller financing, or rate buy-down credit?
- Why hasn't it sold? Are there any deal-killer items the seller is aware of (foundation, flood, title, zoning, code violations)?
- Is there a deadline driving the sale (1031 exchange, divorce, estate, relocation)? That informs how much negotiation room exists.
- Schools are F-rated, which usually means shorter tenancies and higher turnover. Who's the typical renter profile here, and what's been the actual vacancy rate?
- Crime grade is F in this area — have there been break-ins, vandalism, or insurance claims at this property in the last 3 years? What carrier currently insures it and at what premium?
- What's the average days-on-market for RENTAL listings here right now (not sales)? A rising rental-DOM trend means longer vacancies and softer asking-rent achievability than the comps imply.
- What's the recent tenant-quality profile in this submarket — average credit score on applications, eviction rate, late-payment / NSF rate, and stable-employment percentage? A property-management company in the area should have these aggregated.
- How much new for-sale + rental construction is in the pipeline within 1–3 miles? Heavy new supply typically softens prices + rents 12–24 months out; constrained supply supports both.
Investment metrics
- 1% rule
- 0.91% ✗
- Cap rate
- 7.72%
- Cash-on-cash
- 5.08%
- DSCR
- 1.23
- GRM
- 9.2
CMA / ARV
No comps found within radius.
Projected returns pro-forma
10.0% appreciation · 3.0% rent growth · sell at horizon
- IRR
- 27.9%
- Equity multiple
- 3.21×
- Total profit
- $154,320
- Equity at exit
- $224,319
- IRR
- 24.3%
- Equity multiple
- 7.30×
- Total profit
- $439,442
- Equity at exit
- $483,752
Cash invested: $69,720 (down + closing). Projections, not guarantees.
Landlord ↔ Tenant lean methodology
- Overall (STATE)
- 87 Strongly Landlord-Friendly
- State Texas
- 87 Strongly Landlord-Friendly · R+5
- County
- — inherits STATE
- City
- — inherits STATE
ZIP-level market 73439
- Home prices YoY
- 12.3%
- Price-to-rent
- 9.2×
Monthly cashflow live
- Estimated rent
- $2,264 medium interval (Pro) →
- Mortgage (P&I)
- −$1,306
- Tax from tax record
- −$84 /mo · $1,007/yr
- Insurance
- −$104
- HOA
- −$0
- Vacancy / Maint / Mgmt
- −$476
- Net cashflow
- $295
Break-even live
Sensitivity live
| Price | -10% $436 | -5% $366 | +0% $295 | +5% $225 | +10% $154 |
|---|---|---|---|---|---|
| Rent | -10% $117 | -5% $206 | +0% $295 | +5% $385 | +10% $474 |
| Rate | -1.0pp $421 | -0.5pp $359 | base $295 | +0.5pp $231 | +1.0pp $165 |
UW: 25.0% down · 7.5% · 30yr · 1.5% tax · 5.0% vac · 8.0% maint · 8.0% mgmt
Financing live
Cash to close
- Down payment
- $62,250
- Closing costs
- $7,470
- Reserves months
- —
- Total cash needed
- —
Loan-product check · same deal, 3 products live
Conventional
25% down · 7.5% · 30yr
- Down + closing
- —
- Monthly P&I
- —
- Monthly cashflow
- —
- DSCR
- —
- Eligible?
- —
Personal DTI + credit; lowest rate.
DSCR
20% down · 8.5% · 30yr
- Down + closing
- —
- Monthly P&I
- —
- Monthly cashflow
- —
- DSCR
- —
- Eligible?
- —
No personal income docs; deal must DSCR.
Hard money
10% down · 12.0% · 12mo
- Down + closing
- —
- Monthly P&I
- —
- Monthly cashflow
- —
- DSCR
- —
- Eligible?
- —
Short-term bridge; refi at stabilization.
Listing history 30 events
-
2026-06-19days on market $249,000 Active 153 DOM
-
2026-06-18days on market $249,000 Active 152 DOM
-
2026-06-17days on market $249,000 Active 151 DOM
-
2026-06-16days on market $249,000 Active 150 DOM
-
2026-06-15days on market $249,000 Active 149 DOM
-
2026-06-14days on market $249,000 Active 147 DOM
-
2026-06-13days on market $249,000 Active 146 DOM
-
2026-06-10days on market $249,000 Active 144 DOM
-
2026-06-09days on market $249,000 Active 143 DOM
-
2026-06-08days on market $249,000 Active 142 DOM
-
2026-06-07days on market $249,000 Active 141 DOM
-
2026-06-05days on market $249,000 Active 138 DOM
-
2026-06-02days on market $249,000 Active 136 DOM
-
2026-06-01days on market $249,000 Active 135 DOM
-
2026-05-31days on market $249,000 Active 134 DOM
-
2026-05-30days on market $249,000 Active 133 DOM
-
2026-05-06price $249,000
-
2026-04-28price $254,900
-
2026-01-14$259,000 Active
-
2026-01-06historical
-
2025-09-27$273,900 Active
-
2025-09-24historical
-
2025-07-01price $275,000
-
2025-03-24$289,000 Active
-
2018-04-23soldstatus $59,000
-
2014-02-28soldstatus $81,500
-
2014-02-28soldstatus $81,000
-
2013-05-24$89,000
-
2007-09-27soldstatus $24,000
-
2006-08-13soldstatus $16,900
ⓘ Source: listings_history table (triggers on properties + properties_extension) + one-shot
backfill from property_details.listing_events for pre-trigger history.
Tax reassessment forecast TX · Resets to sale price
- Current annual tax
- $1,007 · $84/mo
- Projected year-2 tax
- $4,557 · $380/mo
- Expected delta
- +$3,550/yr (+$296/mo · 352.5%)
ⓘ Screening estimate from a state-policy table — verify with the county assessor before closing.
Climate risk First Street
- Flood 1/10 Low 0% chance over 30 yrs
- Wildfire 4/10 Moderate
- Heat 6/10 Major 7 d/yr ≥110°F today · 21 d/yr by 30 yrs out
- Wind 4/10 Moderate 19% chance of damaging wind over 30 yrs
- Air quality 3/10 Moderate 3 unhealthy d/yr today · 3 by 30 yrs out
Nearby sold comps map
Loading sold comps map…
Walkable amenities ~0.75 mi
Loading nearby amenities…
Taxation est. · year 1
- Rental income
- $27,172
- − Mortgage interest
- −$13,948
- − Property taxes
- −$1,007
- − Insurance
- −$1,245
- − Repairs & maintenance
- −$2,174
- − Management
- −$2,174
- − Depreciation
- −$7,244
- Taxable loss
- −$619
- Est. tax savings @ 24.0%
- +$149
- After-tax cash flow
- $3,693/yr
For passive investors: Depreciation is non-cash, so a rental often shows a tax loss while cash-flowing — sheltering income. Rental losses are passive: they offset passive income freely, and up to $25,000/yr can offset ordinary (W-2) income if you actively participate and your MAGI is under $100k (phasing out to $0 by $150k); unused losses carry forward. On sale, claimed depreciation is recaptured at up to 25%, and gains may owe capital-gains tax (a 1031 exchange can defer both). Figures are a year-1 estimate at your 24.0% rate — not tax advice; consult a CPA.
Schools (NCES district)
- District
- Kingston
- NCES district ID
- 4016590
- Math proficiency
- 27% ▼ -7.00%
- Reading proficiency
- 32% ▼ -7.00%
- Median HH income
- $40,655
- Composite
- 24.88/100
- National rank
- #7585
- State rank
- #70 of 270 in OK
Livability — Sherwood Shores
- Score
- 49/100
- State rank
- #1519
- US rank
- #25941
Category grades
Schools grade is shown separately in the Schools card above.
Census & demographics
- Population (ZIP)
- 7,011
Population outlook (Marshall County) Hauer SSP2
- Today (2025)
- 17,405 people
- By 2030
- 18,038 · +3.6%
- By 2040
- 19,513 · +12.1%
- By 2050
- 21,283 · +22.3%
- By 2075
- 27,884 · +60.2%
- By 2100
- 35,435 · +103.6%
Race, ethnicity, and origin ACS 2023
- Neighborhood character
- Predominantly White (75%)
- Race & ethnicity
- White 75% Two or more races 16% Native American 5% Hispanic / Latino 4%
- Common ancestry
- Lithuanian 3% Italian 2% Serbian 1%
- Foreign-born
- 1% · Canada
- Languages at home
- 97% English-only · Spanish 3%
Political lean MEDSL · Marshall
- 2024 margin
- Solid R (+63.4) · D 17.7% · R 81.2% · Other 1.1%
- 2008→2024 swing
- -24.6pp toward R · 2008: -38.8pp · 2024: -63.4pp
- All cycles
- 2024: R+63.4 2020: R+62.5 2016: R+56.6 2012: R+45.7 2008: R+38.8
Not yet ingested
- Civics
- —
Market trends
- HPI YoY
- ▲ 26.96%
- Current HPI
- 246.2253
- Rent YoY
- —
- Metro
- —
- State GDP YoY
- ▲ 3.95%
- F500 in state
- 110
Industry mix (Fortune 500 HQ in TX)
| Industry | F500 HQs | Revenue |
|---|---|---|
| Energy | 16 | $1,198B |
|
||
| Technology | 5 | $198B |
|
||
| Engineering / Construction | 4 | $72B |
|
||
| Energy Services | 3 | $60B |
|
||
| Utilities | 3 | $41B |
|
||
| Healthcare | 2 | $330B |
|
||
Price history
+1373.4% since first listed14 events — show timeline
- 2026-05-06 Price Changed $249,000 MLS Technology, Inc.
- 2026-04-28 Price Changed $254,900 MLS Technology, Inc.
- 2026-01-14 Listed $259,000 MLS Technology, Inc.
- 2026-01-06 Listing Removed — MLS Technology, Inc.
- 2025-09-27 Listed $273,900 MLS Technology, Inc.
- 2025-09-24 Listing Removed — MLS Technology, Inc.
- 2025-07-01 Price Changed $275,000 MLS Technology, Inc.
- 2025-03-24 Listed $289,000 MLS Technology, Inc.
- 2018-04-23 Sold (Public Records) $59,000 Public Records
- 2014-02-28 Sold (Public Records) $81,000 Public Records
- 2014-02-28 Sold (MLS) $81,500 MLS Technology, Inc.
- 2013-05-24 Listed $89,000 MLS Technology, Inc.
- 2007-09-27 Sold (Public Records) $24,000 Public Records
- 2006-08-13 Sold (Public Records) $16,900 Public Records
Property tax history
+2.4%/yrLatest (2025): $1,007 · +4.2% YoY. Source: county tax records.
Cash-flow waterfall
monthlySold comps — $/sqft
last 12 mo · ≤1 miLoading sold comps…