40090 Colorado Way · Salome, AZ
Flood risk 1/10 · Minimal
- FEMA flood zone
- X (shaded)
- Chance of flooding over 30 yrs
- 0.0%
- Est. flood insurance / yr
- $507 – $1,088
Fire risk 3/10 · Minor
- Est. fire insurance / yr
- $610 – $1,132
Heat risk 8/10 · Major
- Hot days now (above 109°F)
- 6 days/yr
- Hot days in 30 yrs
- 13 days/yr
Wind risk 1/10 · Minimal
- Chance of severe wind over 30 yrs
- —
Air-quality risk 1/10 · Minimal
- Unhealthy air days now
- 0 days/yr
- Unhealthy air days in 30 yrs
- 0 days/yr
Risk factors via First Street. Map © Google.
Why this score? — see what drove the C+ grade
The composite is a weighted blend of 9 inputs, each scored 0–100. Each bar is that input's sub-score; the figure is the points it added to the 100-point composite (weight × sub-score).
- Cash flow +26.3/30.0
- DSCR +8.9/10.0
- ARV discount +7.5/15.0
- Appreciation +6.6/10.0
- 1% rule +6.5/10.0
- Livability +3.3/5.0
- Rent growth +2.5/5.0
- Condition / age +2.5/5.0
- Schools +0.8/10.0
$116,000
🖨 Deal sheet 📄 Offer letter ✓ Due diligence
Listing remarks
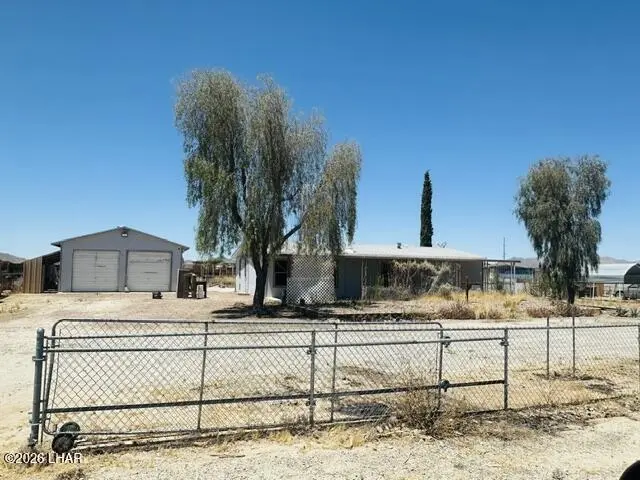
Built in 1989, situated on a 18,731 square foot lot is this Spacious 1700 sq ft. home that needs some Handyman touch! Plenty of Parking in the Detached 32X24 Garage. Split floor plan with a open kitchen and living room area. Located in Salome AZ. and in a nice neighborhood. Call your Agent today and come see this place for yourself! Motivated Sellers! Wholesale seller holds an equitable interest in the real property and the wholesale seller may not be able to convey title to the property
Key facts
- Split floor plan
- Living room area
- Nice neighborhood
Tags
Property features AI
Finance
- HOA & community: Located in Keller Retirement Community; Zoned P-MHS (Manufactured/Mobile Home Subdivision)
Exterior
- Parking: Detached garage with 4 spaces
- Utilities: Electricity available; Septic tank
- Home design: Manufactured home (double wide); Built by Palm Harbor
- Construction: Vertical siding
- Exterior features: Level lot; Front yard and back yard fencing; Chain-link fence; Shingle roof
Interior
- Flooring: Laminate flooring; Carpet
- Bathrooms: 1 full bathroom; 1 three-quarter bathroom
- Heating & cooling: No heating; No cooling
- Interior features: Vaulted ceilings; Open floor plan
Neighborhood map
What this means for you Summary
Snapshot
- This is a 3-bed/2.0-bath manufactured listed at $116k.
Deal economics
- At list price, monthly cash flow is $299 ($4k/yr) — positive.
- The deal already cash-flows at list — no discount required.
- Meets the 1% rule at list price ($1k rent vs $116k).
- Recommended offer: $114k (1.5% below list) — sets the bar for market timing.
- Cap rate 9.4% vs local median 4.3% in Salome — top-decile yield for the area; either an underpriced asset or a hidden risk that comps aren't pricing in. Stress-test before assuming the spread holds.
Location & tenants
- Location reads 66/100 on livability (#76 in AZ) — a middle-class / working-renter tenant base. Strengths: cost of living A+, crime A-; Watch: health & safety C-, schools F, amenities F.
- Bicentennial Union High School District (4515) (rural): math 0% / reading 11% proficiency, ranked #448 of 501 in AZ (top 89%) — low school quality limits family demand, transient renter base, plan for 1-2y turnover.
- Market conditions: 136 active listings in the ZIP; 92 units permitted in La Paz County in 2024 (0 in 5+ unit buildings).
Forward outlook
- In year one you build about $4k of equity ($802 loan paydown + $4k appreciation (3.1% local appreciation)).
- La Paz County population projected at -11% by 2050 — secular population decline; favor cash flow + early exit over multi-decade hold.
- At projected returns (3.1% appreciation + 3.0% rent growth), your $32k cash investment doubles in ~4 years — after that, you're playing with house money.
- By year 8, paydown + projected appreciation supports a ~$33k cash-out refi (75% LTV) — recoverable capital for the next deal without selling this one.
Negotiation context
- It's been on market 22 days — a 2% lower offer ($114k) is reasonable based on typical stale-listing flexibility.
- Current owner paid $78k; 49% above their basis — modest negotiation headroom, anchor on the comps not their cost.
Risks & watch-outs
- Climate carrying-cost: extreme-heat days projected 6→13/yr by 2055 (HVAC capex compounding) — expect insurance premiums to compound above CPI over the hold.
Questions for the listing agent
- Is there a deadline driving the sale (1031 exchange, divorce, estate, relocation)? That informs how much negotiation room exists.
- Schools are F-rated, which usually means shorter tenancies and higher turnover. Who's the typical renter profile here, and what's been the actual vacancy rate?
- What's the average days-on-market for RENTAL listings here right now (not sales)? A rising rental-DOM trend means longer vacancies and softer asking-rent achievability than the comps imply.
- What's the recent tenant-quality profile in this submarket — average credit score on applications, eviction rate, late-payment / NSF rate, and stable-employment percentage? A property-management company in the area should have these aggregated.
- How much new for-sale + rental construction is in the pipeline within 1–3 miles? Heavy new supply typically softens prices + rents 12–24 months out; constrained supply supports both.
Investment metrics
- 1% rule
- 1.15% ✓
- Cap rate
- 9.39%
- Cash-on-cash
- 11.06%
- DSCR
- 1.49
- GRM
- 7.2
CMA / ARV
- ARV (on-the-fly)
- $255,612
- Comps found
- 8
Show comp detail 8 sales within ~0.75 mi
| Address | Dist | Beds/Ba | Sqft | Sold | Price | $/sf | Match |
|---|---|---|---|---|---|---|---|
| 66383 Cactus St | 0.17mi | 3/2.0 | 1,350 (-6%) | 3mo | $242,000 | $179 | 81 |
| 66608 Utah Ln | 0.09mi | 3/2.0 | 1,566 (+10%) | 6mo | $250,000 | $160 | 75 |
| 66710 Cactus St St | 0.27mi | 3/2.0 | 1,348 (-6%) | 18mo | $275,000 | $204 | 63 |
| 66920 Prose Ln | 0.51mi | 3/2.0 | 1,344 (-6%) | 6mo | $249,000 | $185 | 61 |
| 66774 Ocotillo Ln | 0.35mi | 2/2.5 (-1) | 1,232 (-14%) | 4mo | $269,900 | $219 | 50 |
| 66330 Kokopelli Ln | 0.46mi | 4/2.0 (+1) | 1,600 (+12%) | 10mo | $165,000 | $103 | 46 |
| 39919 S Dakota Pl | 0.48mi | 2/1.0 (-1) | 1,216 (-15%) | 2mo | $95,000 | $78 | 42 |
| 39950 Washington Dr | 0.35mi | 2/2.0 (-1) | 1,248 (-13%) | 21mo | $77,500 | $62 | 40 |
Match score weights: distance 35% · size 25% · config 20% · recency 20%. Top-matched comps best support the ARV.
Projected returns pro-forma
3.11% appreciation · 3.0% rent growth · sell at horizon
- IRR
- 18.1%
- Equity multiple
- 2.04×
- Total profit
- $33,726
- Equity at exit
- $52,901
- IRR
- 19.4%
- Equity multiple
- 3.85×
- Total profit
- $92,490
- Equity at exit
- $82,108
Cash invested: $32,480 (down + closing). Projections, not guarantees.
Landlord ↔ Tenant lean methodology
- Overall (STATE)
- 87 Strongly Landlord-Friendly
- State Arizona
- 87 Strongly Landlord-Friendly · R+3
- County
- — inherits STATE
- City
- — inherits STATE
ZIP-level market 85348
- Home prices YoY
- 2.0%
- Active inventory
- 136
- Price-to-rent
- 7.2×
Monthly cashflow live
- Estimated rent
- $1,335 medium interval (Pro) →
- Mortgage (P&I)
- −$608
- Tax from tax record
- −$99 /mo · $1,186/yr
- Insurance
- −$48
- HOA
- −$0
- Vacancy / Maint / Mgmt
- −$280
- Net cashflow
- $299
Break-even live
UW: 25.0% down · 7.5% · 30yr · 1.5% tax · 5.0% vac · 8.0% maint · 8.0% mgmt
Financing live
Cash to close
- Down payment
- $29,000
- Closing costs
- $3,480
- Reserves months
- —
- Total cash needed
- —
Loan-product check · same deal, 3 products live
Conventional
25% down · 7.5% · 30yr
- Down + closing
- —
- Monthly P&I
- —
- Monthly cashflow
- —
- DSCR
- —
- Eligible?
- —
Personal DTI + credit; lowest rate.
DSCR
20% down · 8.5% · 30yr
- Down + closing
- —
- Monthly P&I
- —
- Monthly cashflow
- —
- DSCR
- —
- Eligible?
- —
No personal income docs; deal must DSCR.
Hard money
10% down · 12.0% · 12mo
- Down + closing
- —
- Monthly P&I
- —
- Monthly cashflow
- —
- DSCR
- —
- Eligible?
- —
Short-term bridge; refi at stabilization.
Listing history 20 events
-
2026-06-19days on market $116,000 Active 22 DOM
-
2026-06-18days on market $116,000 Active 21 DOM
-
2026-06-17days on market $116,000 Active 20 DOM
-
2026-06-16days on market $116,000 Active 19 DOM
-
2026-06-15days on market $116,000 Active 18 DOM
-
2026-06-14days on market $116,000 Active 16 DOM
-
2026-06-13days on market $116,000 Active 15 DOM
-
2026-06-10days on market $116,000 Active 13 DOM
-
2026-06-09days on market $116,000 Active 12 DOM
-
2026-06-08days on market $116,000 Active 11 DOM
-
2026-06-07pricedays on market $116,000 Active 10 DOM
-
2026-06-05days on market $119,000 Active 7 DOM
-
2026-06-03days on market $119,000 Active 6 DOM
-
2026-06-02days on market $119,000 Active 5 DOM
-
2026-06-01days on market $119,000 Active 4 DOM
-
2026-05-31days on market $119,000 Active 3 DOM
-
2026-05-30days on market $119,000 Active 2 DOM
-
2026-05-28$119,000 Active
-
2021-03-15soldstatus $78,000
-
1995-06-29soldstatus $60,000
ⓘ Source: listings_history table (triggers on properties + properties_extension) + one-shot
backfill from property_details.listing_events for pre-trigger history.
Tax reassessment forecast AZ · Resets to sale price
- Current annual tax
- $1,186 · $99/mo
- Projected year-2 tax
- $1,186 · $99/mo
- Expected delta
- $0/yr ($0/mo · 0.0%)
ⓘ Screening estimate from a state-policy table — verify with the county assessor before closing.
Climate risk First Street
- Flood 1/10 Low FEMA zone X (shaded) · 0% chance over 30 yrs
- Wildfire 3/10 Moderate
- Heat 8/10 Severe 6 d/yr ≥109°F today · 13 d/yr by 30 yrs out
- Wind 1/10 Low
- Air quality 1/10 Low 0 unhealthy d/yr today · 0 by 30 yrs out
Nearby sold comps map
Loading sold comps map…
Walkable amenities ~0.75 mi
Loading nearby amenities…
Taxation est. · year 1
- Rental income
- $16,021
- − Mortgage interest
- −$6,498
- − Property taxes
- −$1,186
- − Insurance
- −$580
- − Repairs & maintenance
- −$1,282
- − Management
- −$1,282
- − Depreciation
- −$3,375
- Taxable income
- $1,820
- Est. tax owed @ 24.0%
- −$437
- After-tax cash flow
- $3,155/yr
For passive investors: Depreciation is non-cash, so a rental often shows a tax loss while cash-flowing — sheltering income. Rental losses are passive: they offset passive income freely, and up to $25,000/yr can offset ordinary (W-2) income if you actively participate and your MAGI is under $100k (phasing out to $0 by $150k); unused losses carry forward. On sale, claimed depreciation is recaptured at up to 25%, and gains may owe capital-gains tax (a 1031 exchange can defer both). Figures are a year-1 estimate at your 24.0% rate — not tax advice; consult a CPA.
Schools (NCES district)
- District
- Bicentennial Union High School District (4515)
- NCES district ID
- 0401160
- Math proficiency
- 0% ▬ 0.00%
- Reading proficiency
- 11% ▬ 0.00%
- Median HH income
- $34,540
- Composite
- 8.23/100
- National rank
- #14749
- State rank
- #448 of 501 in AZ
Livability — Salome
- Score
- 66/100
- State rank
- #76
- US rank
- #11989
Category grades
Schools grade is shown separately in the Schools card above.
Census & demographics
- Census place
- Salome, AZ
- Population (ZIP)
- 2,201
Population outlook (La Paz County) Hauer SSP2
- Today (2025)
- 18,409 people
- By 2030
- 17,592 · -4.4%
- By 2040
- 16,600 · -9.8%
- By 2050
- 16,328 · -11.3%
- By 2075
- 17,075 · -7.2%
- By 2100
- 17,042 · -7.4%
Race, ethnicity, and origin ACS 2023
- Neighborhood character
- Predominantly White (93%)
- Race & ethnicity
- White 93% Two or more races 4% Hispanic / Latino 4% Native American 1%
- Common ancestry
- Romanian 3% Slovak 3% German 3%
- Foreign-born
- 10% · Canada
- Languages at home
- 90% English-only · Other Indo-European 5% Spanish 4%
Political lean MEDSL · La Paz
- 2024 margin
- Solid R (+44.2) · D 27.6% · R 71.8%
- 2008→2024 swing
- -15.7pp toward R · 2008: -28.5pp · 2024: -44.2pp
- All cycles
- 2024: R+44.2 2020: R+38.8 2016: R+41.8 2012: R+32.2 2008: R+28.5
Not yet ingested
- Civics
- —
Market trends
- HPI YoY
- ▲ 3.11%
- Current HPI
- 161.321
- Rent YoY
- —
- Metro
- —
- State GDP YoY
- ▲ 4.54%
- F500 in state
- 20
Industry mix (Fortune 500 HQ in AZ)
| Industry | F500 HQs | Revenue |
|---|---|---|
| Technology | 2 | $13B |
|
||
| Mining / Metals | 1 | $23B |
|
||
| Environmental Services | 1 | $16B |
|
||
| Metals / Steel | 1 | $14B |
|
||
| Technology Distribution | 1 | $9B |
|
||
| Homebuilding | 1 | $8B |
|
||
Price history
+98.3% since first listed3 events — show timeline
- 2026-05-28 Listed $119,000 LHAR
- 2021-03-15 Sold (Public Records) $78,000 Public Records
- 1995-06-29 Sold (Public Records) $60,000 Public Records
Property tax history
+2.9%/yrLatest (2025): $1,186 · +5.7% YoY. Source: county tax records.
Cash-flow waterfall
monthlySold comps — $/sqft
last 12 mo · ≤1 miLoading sold comps…