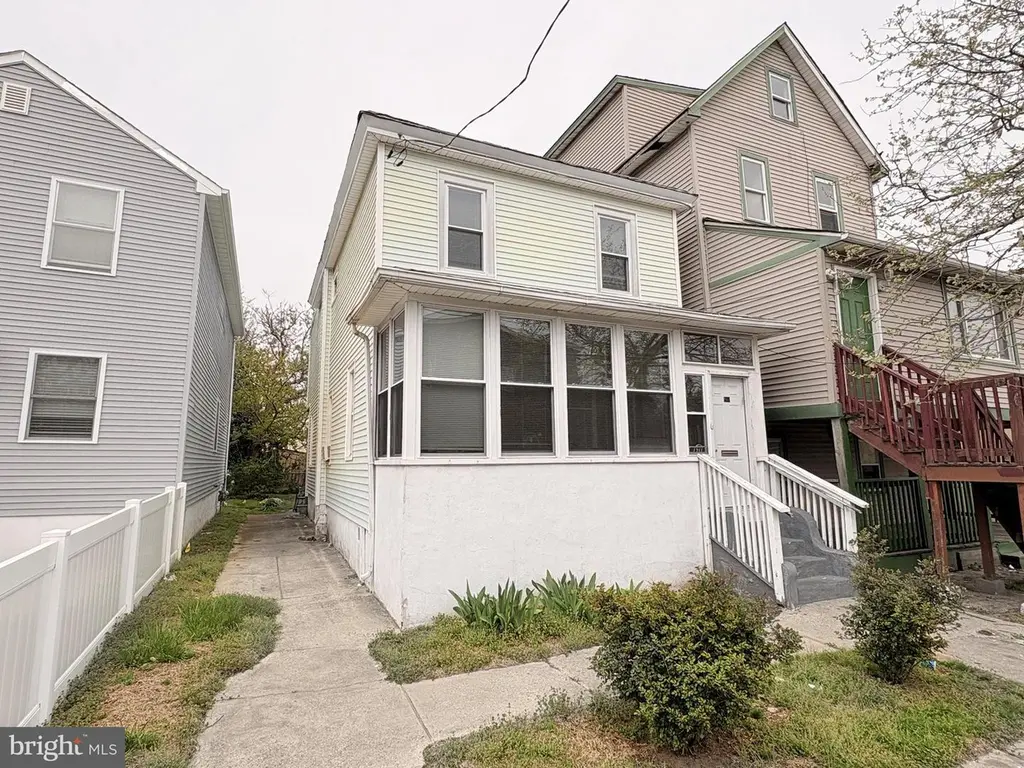
1911 Hummock Ave · Atlantic City, NJ
Flood risk 8/10 · Major
- FEMA flood zone
- AE
- Chance of flooding over 30 yrs
- 0.97%
- Est. flood insurance / yr
- $1,737 – $8,500
Fire risk 2/10 · Minimal
- Est. fire insurance / yr
- $526 – $976
Heat risk 9/10 · Severe
- Hot days now (above 94°F)
- 7 days/yr
- Hot days in 30 yrs
- 17 days/yr
Wind risk 8/10 · Major
- Chance of severe wind over 30 yrs
- 80.0%
Air-quality risk 3/10 · Minor
- Unhealthy air days now
- 2 days/yr
- Unhealthy air days in 30 yrs
- 3 days/yr
Risk factors via First Street. Map © Google.
Why this score? — see what drove the B- grade
The composite is a weighted blend of 9 inputs, each scored 0–100. Each bar is that input's sub-score; the figure is the points it added to the 100-point composite (weight × sub-score).
- Cash flow +30.0/30.0
- DSCR +10.0/10.0
- 1% rule +8.2/10.0
- ARV discount +8.2/15.0
- Rent growth +3.9/5.0
- Livability +2.8/5.0
- Condition / age +2.5/5.0
- Schools +1.4/10.0
- Appreciation +0.0/10.0
$185,000
🖨 Deal sheet 📄 Offer letter ✓ Due diligence
Listing remarks MLS
Welcome to this Well Built 4 bedroom Home with Character. Enjoy the views from the Enclosed Front Porch, Large Formal Dining Room with Wood Columns and Builtin Cabinets with glass doors that separates the Formal Living Room, Lots of Windows and High Ceilings. Large Primary Bedroom, Pull down attic stairs for additional storage, Ceiling Fans, Replacement Windows, Back Covered Porch, Needs a Little Updating, but this property would make a great First Time Buyer Home or a Great Investment Property, This property is being Sold In As Is Condition. The Buyer Shall be Responsible for the CO and Any other Inspections, Certifications or Repairs Necessary for Closing at the buyers expense
Key facts
- Formal dining room
- Wood columns
- Builtin cabinets
Tags
Property features AI
Finance
- Other: Fee simple ownership
Exterior
- Parking: On-street parking
- Utilities: Public water; Public sewer hookup available; Natural gas service
- Home design: Detached property; Above-grade finished living space noted
- Construction: Frame construction; Crawl space foundation; Above- and below-grade structures
- Exterior features: Lot dimensions approximately 25 x 101; No tidal water
Interior
- Kitchen: Kitchen (appliances not specified)
- Bedrooms: Four bedrooms on the first upper level
- Bathrooms: One full bathroom
- Heating & cooling: Hot water baseboard heating; Natural gas heating and hot water
- Interior features: Living room; Dining room; Kitchen; Two or more access/exit points
- Laundry & utility: No basement
Neighborhood map
What this means for you Summary
Snapshot
- This is a 4-bed/1.0-bath single-family listed at $185k.
Deal economics
- At list price, monthly cash flow is $269 ($3k/yr) — positive.
- The deal already cash-flows at list — no discount required.
- Meets the 1% rule at list price ($2k rent vs $185k).
- Recommended offer: $179k (3.0% below list) — sets the bar for market timing.
- Cap rate 10.8% vs local median 3.7% in Atlantic City — top-decile yield for the area; either an underpriced asset or a hidden risk that comps aren't pricing in. Stress-test before assuming the spread holds.
Location & tenants
- Location reads 55/100 on livability (#525 in NJ) — a working-class tenant base; expect higher turnover. Strengths: health & safety A; Watch: commute D, schools F, crime F.
- Atlantic City School District (urban): math 9% / reading 26% proficiency, ranked #454 of 472 in NJ (top 96%) — low school quality limits family demand, transient renter base, plan for 1-2y turnover; 85% free/reduced lunch — lower-income household profile, screen leases tightly.
- Market conditions: Rents rising fast (+5.5%/yr); 482 active listings in the ZIP; 16 comparable units currently listed for rent nearby; rentals at typical pace (median 21d on market — plan ~3-4 weeks tenant-placement turnaround); lower-income renter base — watch delinquency; 672 units permitted in Atlantic County in 2024 (258 in 5+ unit buildings).
- At $2,449/mo this rent would consume 71% of the median local household income ($41k/yr) (locally 3414% of renters already pay >50% of income on rent) — very limited rent-growth headroom before tenants either downsize or default.
Forward outlook
- Local home prices are declining (-3.0%/yr); year-one equity from $1k of loan paydown is wiped out by about $6k of value loss. Plan a longer hold.
- Atlantic County population projected at -12% by 2050 — secular population decline; favor cash flow + early exit over multi-decade hold.
- At projected returns (-3.0% appreciation + 5.5% rent growth), your $52k cash investment doubles in ~10 years — after that, you're playing with house money.
Negotiation context
- It's been on market 31 days — a 3% lower offer ($179k) is reasonable based on typical stale-listing flexibility.
- 4 sale attempts with the ask held roughly flat each time — persistent listings suggest the price (not the market) is what's stuck; bring a comps-based counter.
- Current owner paid $68k; list at $185k implies a 174% gain — meaningful room to come down on a strong offer.
Risks & watch-outs
- Watch-outs: flood insurance adds $427/mo; built in 1920 — expect roof / HVAC / electrical / plumbing capex.
- Climate carrying-cost: in FEMA flood zone AE (mandatory federal flood insurance); severe wind risk, 80% chance of damaging wind over 30y; extreme-heat days projected 7→17/yr by 2055 (HVAC capex compounding) — expect insurance premiums to compound above CPI over the hold.
Questions for the listing agent
- It's been on market 31 days. Have you received any prior offers? Is the seller open to a 3% concession, seller financing, or rate buy-down credit?
- Built in 1920 — when were the roof, HVAC, electrical panel, plumbing, and water heater last replaced?
- What's the actual annual flood-insurance premium (NFIP or private), and is the property in a SFHA with mandatory coverage?
- Is there a deadline driving the sale (1031 exchange, divorce, estate, relocation)? That informs how much negotiation room exists.
- Schools are F-rated, which usually means shorter tenancies and higher turnover. Who's the typical renter profile here, and what's been the actual vacancy rate?
- Crime grade is F in this area — have there been break-ins, vandalism, or insurance claims at this property in the last 3 years? What carrier currently insures it and at what premium?
- What's the average days-on-market for RENTAL listings here right now (not sales)? A rising rental-DOM trend means longer vacancies and softer asking-rent achievability than the comps imply.
- What's the recent tenant-quality profile in this submarket — average credit score on applications, eviction rate, late-payment / NSF rate, and stable-employment percentage? A property-management company in the area should have these aggregated.
- How much new for-sale + rental construction is in the pipeline within 1–3 miles? Heavy new supply typically softens prices + rents 12–24 months out; constrained supply supports both.
Investment metrics
- 1% rule
- 1.32% ✓
- Cap rate
- 10.80%
- Cash-on-cash
- 16.11%
- DSCR
- 1.72
- GRM
- 6.3
CMA / ARV
- ARV (on-the-fly)
- $188,082
- Comps found
- 12
Show comp detail 12 sales within ~0.75 mi
| Address | Dist | Beds/Ba | Sqft | Sold | Price | $/sf | Match |
|---|---|---|---|---|---|---|---|
| 704 N Michigan Ave | 0.12mi | 3/1.5 (-1) | 1,404 (-4%) | 4mo | $215,000 | $153 | 78 |
| 1910 Grant Ave | 0.18mi | 3/1.0 (-1) | 1,460 (+0%) | 13mo | $100,000 | $68 | 75 |
| 604 N Indiana Ave | 0.12mi | 3/1.5 (-1) | 1,476 (+1%) | 14mo | $162,500 | $110 | 73 |
| 1719 Hummock Ave | 0.14mi | 3/1.5 (-1) | 1,439 (-1%) | 15mo | $185,000 | $129 | 72 |
| 719 N Ohio Ave | 0.18mi | 4/2.0 | 1,436 (-2%) | 16mo | $1,570,000 | $1,093 | 72 |
| 1932 Mckinley Ave Ave | 0.23mi | 3/2.0 (-1) | 1,369 (-6%) | 6mo | $232,300 | $170 | 65 |
| 1115 N Ohio Ave | 0.36mi | 3/1.0 (-1) | 1,438 (-1%) | 16mo | $149,000 | $104 | 63 |
| 133 N Georgia | 0.43mi | 3/1.5 (-1) | 1,364 (-6%) | 1mo | $137,000 | $100 | 61 |
| 1002 N Michigan Ave | 0.25mi | 4/2.0 | 1,640 (+12%) | 9mo | $191,000 | $116 | 56 |
| 32 S Bellevue Ave | 0.74mi | 4/2.0 | 1,432 (-2%) | 9mo | $200,000 | $140 | 51 |
| 1428 Madison Ave | 0.68mi | 3/2.5 (-1) | 1,474 (+1%) | 12mo | $155,000 | $105 | 46 |
| 1410 Emerson Ave | 0.60mi | 3/2.0 (-1) | 1,244 (-15%) | 12mo | $300,000 | $241 | 29 |
Match score weights: distance 35% · size 25% · config 20% · recency 20%. Top-matched comps best support the ARV.
Projected returns pro-forma
-3.0% appreciation · 5.52% rent growth · sell at horizon
- IRR
- -3.1%
- Equity multiple
- 0.88×
- Total profit
- $-6,218
- Equity at exit
- $27,584
- IRR
- 9.9%
- Equity multiple
- 1.87×
- Total profit
- $45,254
- Equity at exit
- $15,995
Cash invested: $51,800 (down + closing). Projections, not guarantees.
Landlord ↔ Tenant lean methodology
- Overall (STATE)
- 21 Tenant-Leaning
- State New Jersey
- 21 Tenant-Leaning · D+6
- County
- — inherits STATE
- City
- — inherits STATE
ZIP-level market 08401
- Home prices YoY
- -7.0%
- Rents YoY
- 5.5%
- Active inventory
- 482
- Price-to-rent
- 6.3×
Monthly cashflow live
- Estimated rent
- $2,449 high interval (Pro) →
- Mortgage (P&I)
- −$970
- Tax from tax record
- −$192 /mo · $2,305/yr
- Insurance
- −$77
- Flood insurance flood zone
- −$427 /mo · $5,118/yr
- HOA
- −$0
- Vacancy / Maint / Mgmt
- −$514
- Net cashflow
- $269
Break-even live
UW: 25.0% down · 7.5% · 30yr · 1.5% tax · 5.0% vac · 8.0% maint · 8.0% mgmt
Financing live
Cash to close
- Down payment
- $46,250
- Closing costs
- $5,550
- Reserves months
- —
- Total cash needed
- —
Loan-product check · same deal, 3 products live
Conventional
25% down · 7.5% · 30yr
- Down + closing
- —
- Monthly P&I
- —
- Monthly cashflow
- —
- DSCR
- —
- Eligible?
- —
Personal DTI + credit; lowest rate.
DSCR
20% down · 8.5% · 30yr
- Down + closing
- —
- Monthly P&I
- —
- Monthly cashflow
- —
- DSCR
- —
- Eligible?
- —
No personal income docs; deal must DSCR.
Hard money
10% down · 12.0% · 12mo
- Down + closing
- —
- Monthly P&I
- —
- Monthly cashflow
- —
- DSCR
- —
- Eligible?
- —
Short-term bridge; refi at stabilization.
Rent comps 16 comps
| Address | Beds | Baths | Sqft | Rent | $/sqft | DOM | Units | Dist |
|---|---|---|---|---|---|---|---|---|
| 2015 Grant Ave Atlantic City, NJ | 3.0 | 1.0 | 1056 | $2,325 | $2.20 | 20d | 1 | 0.20mi |
| 2021 Grant Ave Atlantic City, NJ | 3.0 | 1.0 | 1011 | $2,350 | $2.32 | 20d | 1 | 0.20mi |
| 905 Keener Ave Atlantic City, NJ | 3.0 | 1.0 | 1059 | $1,900 | $1.79 | 20d | 1 | 0.20mi |
| 326 N Tennessee Ave Unit 2 Atlantic City, NJ | 3.0 | 1.0 | 1815 | $2,200 | $1.21 | 13d | 1 | 0.40mi |
| 1216 N Ohio Ave Atlantic City, NJ | 5.0 | 2.0 | 1355 | $2,900 | $2.14 | 20d | 1 | 0.44mi |
| 4 Italy Ter Atlantic City, NJ | 3.0 | 1.0 | 1000 | $2,300 | $2.30 | 20d | 1 | 0.46mi |
| 1724 Atlantic Ave Unit A1 Atlantic City, NJ | 3.0 | 1.0 | 950 | $2,300 | $2.42 | 20d | 1 | 0.54mi |
| 1510 N Arkansas Ave Atlantic City, NJ | 3.0 | 2.0 | 1008 | $2,750 | $2.73 | 13d | 1 | 0.66mi |
| 1523 N Arkansas Ave Atlantic City, NJ | 3.0 | 2.0 | 984 | $2,500 | $2.54 | 20d | 1 | 0.70mi |
| 1532 Emerson Pl Fl Front Atlantic City, NJ | 3.0 | 2.0 | 1200 | $2,400 | $2.00 | 13d | 1 | 0.73mi |
| 31 N Virginia Ave Atlantic City, NJ | 3.0 | 1.0 | 725 | $2,230 | $3.08 | 13d | 1 | 0.83mi |
| 100 N Chelsea Ave Unit 1 Atlantic City, NJ | 3.0 | 1.0 | 1200 | $15,000 | $12.50 | 20d | 1 | 0.95mi |
| 10 Starboard Ct #10 Atlantic City, NJ | 3.0 | 2.5 | 1680 | $2,400 | $1.43 | 13d | 1 | 1.25mi |
| 3636 Winchester Ave Atlantic City, NJ | 3.0 | 1.0 | 1094 | $1,995 | $1.82 | 20d | 1 | 1.28mi |
| 512 N Harrisburg Ave Atlantic City, NJ | 3.0 | 2.0 | 1156 | $2,800 | $2.42 | 13d | 1 | 1.39mi |
| 3809 Ventnor Ave #6 Atlantic City, NJ | 3.0 | 1.0 | 1500 | $2,100 | $1.40 | 20d | 1 | 1.41mi |
Listing history 9 events
-
2026-06-19days on market $185,000 Active 31 DOM
-
2026-06-18days on market $185,000 Active 30 DOM
-
2026-06-17days on market $185,000 Active 29 DOM
-
2026-06-16days on market $185,000 Active 28 DOM
-
2026-06-15days on market $185,000 Active 27 DOM
-
2026-06-14days on market $185,000 Active 25 DOM
-
2026-06-13days on market $185,000 Active 24 DOM
-
2026-06-10remarks 683-char remark
-
2026-06-10$185,000 Active 22 DOM
ⓘ Source: listings_history table (triggers on properties + properties_extension) + one-shot
backfill from property_details.listing_events for pre-trigger history.
Tax reassessment forecast NJ · Partial reset (capped growth)
- Current annual tax
- $2,305 · $192/mo
- Projected year-2 tax
- $3,456 · $288/mo
- Expected delta
- +$1,151/yr (+$96/mo · 49.9%)
ⓘ Screening estimate from a state-policy table — verify with the county assessor before closing.
Climate risk First Street
- Flood 8/10 Severe FEMA zone AE · 97% chance over 30 yrs
- Wildfire 2/10 Low
- Heat 9/10 Extreme 7 d/yr ≥94°F today · 17 d/yr by 30 yrs out
- Wind 8/10 Severe 80% chance of damaging wind over 30 yrs
- Air quality 3/10 Moderate 2 unhealthy d/yr today · 3 by 30 yrs out
Nearby sold comps map
Loading sold comps map…
Walkable amenities ~0.75 mi
Loading nearby amenities…
Taxation est. · year 1
- Rental income
- $29,388
- − Mortgage interest
- −$10,363
- − Property taxes
- −$2,305
- − Insurance
- −$6,044
- − Repairs & maintenance
- −$2,351
- − Management
- −$2,351
- − Depreciation
- −$5,382
- Taxable income
- $592
- Est. tax owed @ 24.0%
- −$142
- After-tax cash flow
- $3,083/yr
For passive investors: Depreciation is non-cash, so a rental often shows a tax loss while cash-flowing — sheltering income. Rental losses are passive: they offset passive income freely, and up to $25,000/yr can offset ordinary (W-2) income if you actively participate and your MAGI is under $100k (phasing out to $0 by $150k); unused losses carry forward. On sale, claimed depreciation is recaptured at up to 25%, and gains may owe capital-gains tax (a 1031 exchange can defer both). Figures are a year-1 estimate at your 24.0% rate — not tax advice; consult a CPA.
Schools (NCES district)
- District
- Atlantic City School District
- NCES district ID
- 3400960
- Math proficiency
- 9% ▼ -12.00%
- Reading proficiency
- 26% ▼ -6.00%
- Median HH income
- $27,842
- Composite
- 13.66/100
- National rank
- #9504
- State rank
- #454 of 472 in NJ
Livability — Atlantic City
- Score
- 55/100
- State rank
- #525
- US rank
- #23095
Category grades
Schools grade is shown separately in the Schools card above.
Census & demographics
- Census place
- Atlantic City, NJ
- County
- Atlantic County · 143,611 people
- City population
- 38,925
- Metro
- Atlantic City-Hammonton, NJ
- Population (ZIP)
- 38,925
- Household income
- $41,126
- Rent vs Own
- Severe rent burden
- 3414.0
Population outlook (Atlantic County) Hauer SSP2
- Today (2025)
- 268,948 people
- By 2030
- 264,497 · -1.7%
- By 2040
- 252,261 · -6.2%
- By 2050
- 237,846 · -11.6%
- By 2075
- 210,650 · -21.7%
- By 2100
- 180,234 · -33.0%
Race, ethnicity, and origin ACS 2023
- Neighborhood character
- Highly diverse neighborhood (Simpson 0.75)
- Race & ethnicity
- Hispanic / Latino 32% Black 32% Asian 16% White 16% Two or more races 11% Native American 2%
- Hispanic origin (detail)
- Mexican 10% Puerto Rican 8% Dominican 8%
- Common ancestry
- Romanian 1% Scotch-Irish 1%
- Foreign-born
- 29% · Canada, Vietnam, Jamaica
- Languages at home
- 52% English-only · Spanish 30% Other Indo-European 8% Vietnamese 3%
Political lean MEDSL · Atlantic
- 2024 margin
- Toss-up / Even · D 47.7% · R 50.7% · Other 1.6%
- 2008→2024 swing
- -18.1pp toward R · 2008: 15.1pp · 2024: -3.0pp
- All cycles
- 2024: R+3.0 2020: D+6.7 2016: D+6.2 2012: D+17.2 2008: D+15.1
Not yet ingested
- Civics
- —
Market trends
- HPI YoY
- ▼ -26.82%
- Current HPI
- 353.7827
- Rent YoY
- ▲ 5.52%
- Metro
- Atlantic City-Hammonton, NJ
- State GDP YoY
- ▲ 2.05%
- F500 in state
- 34
Industry mix (Fortune 500 HQ in NJ)
| Industry | F500 HQs | Revenue |
|---|---|---|
| Consumer Goods | 3 | $31B |
|
||
| Pharmaceuticals | 2 | $153B |
|
||
| Technology | 2 | $21B |
|
||
| Insurance | 2 | $20B |
|
||
| Healthcare | 2 | $19B |
|
||
| Financial Services | 1 | $70B |
|
||
Price history
+174.1% since first listed7 events — show timeline
- 2026-06-09 Relisted — BRIGHT MLS
- 2026-06-09 Relisted — SJSRMLS
- 2026-05-15 Listing Removed — BRIGHT MLS
- 2026-05-01 Listing Removed — SJSRMLS
- 2026-04-24 Listed $185,000 BRIGHT MLS
- 2026-04-20 Listed $185,000 SJSRMLS
- 1999-01-19 Sold (Public Records) $67,500 Public Records
Property tax history
-5.6%/yrLatest (2025): $2,305 · -2.1% YoY. Source: county tax records.
Cash-flow waterfall
monthlySold comps — $/sqft
last 12 mo · ≤1 miLoading sold comps…