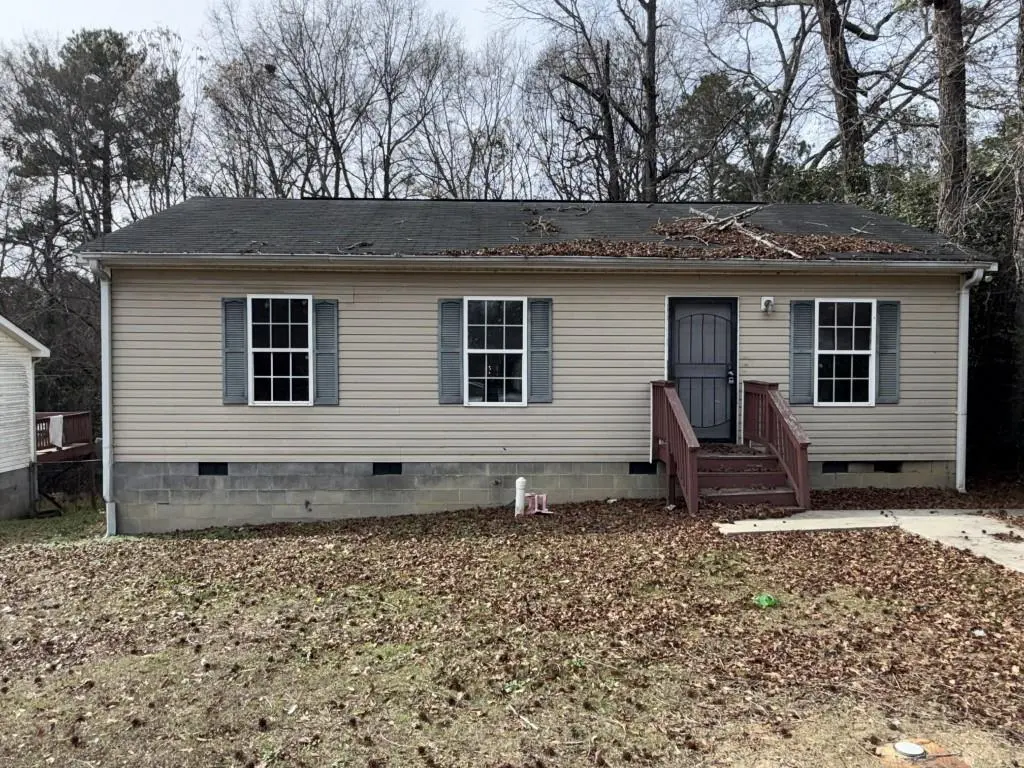
3470 Lawton Rd · Macon-Bibb County, GA
Flood risk 1/10 · Minimal
- FEMA flood zone
- X (unshaded)
- Chance of flooding over 30 yrs
- 0.0%
- Est. flood insurance / yr
- $507 – $1,088
Fire risk 2/10 · Minimal
- Est. fire insurance / yr
- $963 – $1,789
Heat risk 6/10 · Moderate
- Hot days now (above 108°F)
- 7 days/yr
- Hot days in 30 yrs
- 17 days/yr
Wind risk 6/10 · Moderate
- Chance of severe wind over 30 yrs
- 65.0%
Air-quality risk 3/10 · Minor
- Unhealthy air days now
- 3 days/yr
- Unhealthy air days in 30 yrs
- 4 days/yr
Risk factors via First Street. Map © Google.
Why this score? — see what drove the C- grade
The composite is a weighted blend of 9 inputs, each scored 0–100. Each bar is that input's sub-score; the figure is the points it added to the 100-point composite (weight × sub-score).
- Cash flow +25.7/30.0
- DSCR +8.6/10.0
- 1% rule +6.2/10.0
- Rent growth +3.7/5.0
- Livability +2.5/5.0
- Condition / age +2.5/5.0
- Schools +1.2/10.0
- ARV discount +0.0/15.0
- Appreciation +0.0/10.0
$100,000
🖨 Deal sheet 📄 Offer letter ✓ Due diligence
Listing remarks MLS
Don't miss this prime investment opportunity in Macon! This 3-bedroom, 2-bath home offers a desirable layout and excellent upside for investors looking to add to their rental portfolio or complete their next flip. Featuring an open floorplan, this home provides a bright and spacious feel that today's tenants and buyers love. The seamless flow between living, dining, and kitchen areas creates an inviting space ideal for everyday living and entertaining. Step outside to a large rear deck perfect for gatherings, relaxing evenings, or adding extra appeal for future renters. With the right updates, this property has strong income potential and room to build equity. Whether you're a seasoned investor or just getting started, this Macon opportunity checks all the boxes. Act fast properties with this kind of potential don't last long!
Key facts
- Open floorplan
- Large rear deck
- 0.23 acre lot
Tags
Neighborhood map
What this means for you Summary
Snapshot
- This is a 3-bed/2.0-bath single-family listed at $100k.
Deal economics
- At list price, monthly cash flow is $239 ($3k/yr) — positive.
- The deal already cash-flows at list — no discount required.
- Meets the 1% rule at list price ($1k rent vs $100k).
- Recommended offer: $91k (9.0% below list) — sets the bar for market timing.
- Cap rate 9.2% vs local median 5.4% in Macon-Bibb County — top-decile yield for the area; either an underpriced asset or a hidden risk that comps aren't pricing in. Stress-test before assuming the spread holds.
Location & tenants
- Location reads: area grade C — affects rentability + tenant quality, not the cash-flow math above.
- Bibb County (urban): math 11% / reading 18% proficiency, ranked #161 of 174 in GA (top 92%) — low school quality limits family demand, transient renter base, plan for 1-2y turnover; 75% free/reduced lunch — lower-income household profile, screen leases tightly.
- Market conditions: Rents rising fast (+4.6%/yr); 255 active listings in the ZIP; 40 comparable units currently listed for rent nearby; rentals at typical pace (median 21d on market — plan ~3-4 weeks tenant-placement turnaround); lower-income renter base — watch delinquency; 154 units permitted in Bibb County in 2024 (0 in 5+ unit buildings).
- This rent runs 35% of the median local income ($39k/yr) — at the standard rent-burdened threshold; future hikes will face affordability resistance.
Forward outlook
- Local home prices are declining (-3.0%/yr); year-one equity from $691 of loan paydown is wiped out by about $3k of value loss. Plan a longer hold.
- Bibb County population projected at -12% by 2050 — secular population decline; favor cash flow + early exit over multi-decade hold.
- At projected returns (-3.0% appreciation + 4.6% rent growth), your $28k cash investment doubles in ~9 years — after that, you're playing with house money.
Negotiation context
- It's been on market 96 days — a 9% lower offer ($91k) is reasonable based on typical stale-listing flexibility.
- 2 sale attempts with the ask held roughly flat each time — persistent listings suggest the price (not the market) is what's stuck; bring a comps-based counter.
Risks & watch-outs
- Climate carrying-cost: major wind risk, 65% chance of damaging wind over 30y; extreme-heat days projected 7→17/yr by 2055 (HVAC capex compounding) — expect insurance premiums to compound above CPI over the hold.
Questions for the listing agent
- It's been on market 96 days. Have you received any prior offers? Is the seller open to a 9% concession, seller financing, or rate buy-down credit?
- Why hasn't it sold? Are there any deal-killer items the seller is aware of (foundation, flood, title, zoning, code violations)?
- Is there a deadline driving the sale (1031 exchange, divorce, estate, relocation)? That informs how much negotiation room exists.
- What's the average days-on-market for RENTAL listings here right now (not sales)? A rising rental-DOM trend means longer vacancies and softer asking-rent achievability than the comps imply.
- What's the recent tenant-quality profile in this submarket — average credit score on applications, eviction rate, late-payment / NSF rate, and stable-employment percentage? A property-management company in the area should have these aggregated.
- How much new for-sale + rental construction is in the pipeline within 1–3 miles? Heavy new supply typically softens prices + rents 12–24 months out; constrained supply supports both.
Investment metrics
- 1% rule
- 1.12% ✓
- Cap rate
- 9.16%
- Cash-on-cash
- 10.25%
- DSCR
- 1.46
- GRM
- 7.4
CMA / ARV
- ARV (median comp)
- $75,364
- List price
- $100,000
- Delta
- 32.69%
- Verdict
- OVERPRICED
- Comps
- 20 within 1.0 mi
Show comp detail 12 sales within ~0.75 mi
| Address | Dist | Beds/Ba | Sqft | Sold | Price | $/sf | Match |
|---|---|---|---|---|---|---|---|
| 3789 Del Park | 0.23mi | 3/1.0 | 1,023 (-2%) | 4mo | $31,000 | $30 | 79 |
| 3584 Log Cabin Dr | 0.39mi | 3/2.0 | 1,025 (-1%) | 6mo | $130,000 | $127 | 75 |
| 3434 Lawton Rd | 0.04mi | 3/1.0 | 1,000 (-4%) | 18mo | $99,000 | $99 | 73 |
| 3529 Thorpe St | 0.18mi | 3/1.0 | 1,132 (+9%) | 1mo | $42,000 | $37 | 72 |
| 1201 Sherbrooke Dr | 0.40mi | 3/1.0 | 1,080 (+4%) | 4mo | $65,000 | $60 | 68 |
| 3591 Napier Ave | 0.36mi | 3/1.0 | 968 (-7%) | 6mo | $78,200 | $81 | 62 |
| 3720 W Napier Ave | 0.44mi | 3/1.0 | 1,064 (+2%) | 12mo | $64,585 | $61 | 61 |
| 3669 Earl St | 0.34mi | 3/1.0 | 1,128 (+8%) | 7mo | $75,000 | $66 | 60 |
| 1042 Washington St | 0.45mi | 3/1.0 | 965 (-7%) | 4mo | $74,000 | $77 | 59 |
| 1076 Carlisle Ave | 0.72mi | 3/1.0 | 1,025 (-1%) | 4mo | $104,000 | $101 | 56 |
| 3423 Walker St | 0.62mi | 3/1.0 | 969 (-7%) | 14mo | $62,500 | $64 | 44 |
| 1269 James St | 0.64mi | 3/1.5 | 1,150 (+11%) | 10mo | $130,000 | $113 | 42 |
Match score weights: distance 35% · size 25% · config 20% · recency 20%. Top-matched comps best support the ARV.
Projected returns pro-forma
-3.0% appreciation · 4.61% rent growth · sell at horizon
- IRR
- 0.8%
- Equity multiple
- 1.03×
- Total profit
- $865
- Equity at exit
- $14,910
- IRR
- 11.9%
- Equity multiple
- 2.01×
- Total profit
- $28,144
- Equity at exit
- $8,646
Cash invested: $28,000 (down + closing). Projections, not guarantees.
Landlord ↔ Tenant lean methodology
- Overall (STATE)
- 90 Strongly Landlord-Friendly
- State Georgia
- 90 Strongly Landlord-Friendly · R+3
- County
- — inherits STATE
- City
- — inherits STATE
ZIP-level market 31204
- Rents YoY
- 4.6%
- Active inventory
- 255
- Price-to-rent
- 7.4×
Monthly cashflow live
- Estimated rent
- $1,120 high interval (Pro) →
- Mortgage (P&I)
- −$524
- Tax from tax record
- −$79 /mo · $952/yr
- Insurance
- −$42
- HOA
- −$0
- Vacancy / Maint / Mgmt
- −$235
- Net cashflow
- $239
Break-even live
UW: 25.0% down · 7.5% · 30yr · 1.5% tax · 5.0% vac · 8.0% maint · 8.0% mgmt
Financing live
Cash to close
- Down payment
- $25,000
- Closing costs
- $3,000
- Reserves months
- —
- Total cash needed
- —
Loan-product check · same deal, 3 products live
Conventional
25% down · 7.5% · 30yr
- Down + closing
- —
- Monthly P&I
- —
- Monthly cashflow
- —
- DSCR
- —
- Eligible?
- —
Personal DTI + credit; lowest rate.
DSCR
20% down · 8.5% · 30yr
- Down + closing
- —
- Monthly P&I
- —
- Monthly cashflow
- —
- DSCR
- —
- Eligible?
- —
No personal income docs; deal must DSCR.
Hard money
10% down · 12.0% · 12mo
- Down + closing
- —
- Monthly P&I
- —
- Monthly cashflow
- —
- DSCR
- —
- Eligible?
- —
Short-term bridge; refi at stabilization.
Rent comps 40 comps
| Address | Beds | Baths | Sqft | Rent | $/sqft | DOM | Units | Dist |
|---|---|---|---|---|---|---|---|---|
| 3634 Dawn St Macon, GA | 3.0 | 1.0 | 999 | $850 | $0.85 | 43d | 1 | 0.29mi |
| 1097 Edna Pl Macon, GA | 2.0 | 1.0 | 1299 | $1,300 | $1.00 | 43d | 1 | 0.54mi |
| 4145 Forest Ave W Macon, GA | 3.0 | 1.0 | 1285 | $1,195 | $0.93 | 43d | 1 | 0.55mi |
| 3588 Morgan Dr Macon, GA | 4.0 | 1.0 | 1080 | $1,200 | $1.11 | 21d | 1 | 0.58mi |
| 3775 Grand Ave Macon, GA | 3.0 | 2.0 | 1240 | $1,175 | $0.95 | 13d | 1 | 0.62mi |
| 1187 Edna Pl Unit S-1206 Macon, GA | 2.0 | 2.0 | 1000 | $1,060 | $1.06 | 21d | 1 | 0.65mi |
| 1187 Edna Pl Unit S-1208 Macon, GA | 2.0 | 2.0 | 1000 | $850 | $0.85 | 13d | 1 | 0.65mi |
| 1187 Edna Pl Unit S-0501 Macon, GA | 3.0 | 2.0 | 1200 | $1,000 | $0.83 | 21d | 1 | 0.65mi |
| 1187 Edna Pl Unit S-0503 Macon, GA | 3.0 | 2.0 | 1200 | $1,125 | $0.94 | 21d | 1 | 0.65mi |
| 3834 Mercer St Macon, GA | 2.0 | 1.0 | 1000 | $875 | $0.88 | 43d | 1 | 0.72mi |
| 1076 Carlisle Ave Macon, GA | 3.0 | 1.0 | 1025 | $1,065 | $1.04 | 21d | 1 | 0.73mi |
| 3840 Napier Ave Macon, GA | 3.0 | 1.0 | 1365 | $1,350 | $0.99 | 13d | 1 | 0.75mi |
| 4053 Log Cabin Dr Unit B3 Macon, GA | 2.0 | 1.0 | 950 | $749 | $0.79 | 21d | 1 | 0.78mi |
| 3346 Shaw Dr Macon, GA | 3.0 | 1.0 | 1094 | $895 | $0.82 | 21d | 1 | 0.79mi |
| 3307 Guthrie Dr Macon, GA | 2.0 | 1.0 | 754 | $900 | $1.19 | 13d | 1 | 0.80mi |
| 1208 Fourth Ave W Macon, GA | 3.0 | 1.0 | 960 | $825 | $0.86 | 43d | 1 | 0.81mi |
| 3495 Charleston Cir Macon, GA | 3.0 | 1.0 | 1048 | $799 | $0.76 | 21d | 1 | 0.84mi |
| 3495 Charleston Cir Macon, GA | 3.0 | 1.0 | 1048 | $875 | $0.83 | 43d | 1 | 0.84mi |
| 3469 Kingsbury Dr Macon, GA | 4.0 | 2.0 | 1100 | $1,295 | $1.18 | 43d | 1 | 0.85mi |
| 1196 Mimosa Dr Macon, GA | 3.0 | 2.0 | 1200 | $1,300 | $1.08 | 21d | 1 | 0.92mi |
| 4033 N Napier Ave Unit 6 Macon, GA | 2.0 | 1.5 | 1000 | $850 | $0.85 | 43d | 1 | 0.99mi |
| 4126 Ayers Rd Macon, GA | 2.0 | 1.0 | 900 | $750 | $0.83 | 13d | 1 | 1.02mi |
| 4250 Ayers Rd Macon, GA | 2.0 | 1.0 | 1008 | $1,100 | $1.09 | 13d | 1 | 1.03mi |
| 4357 Azalea Dr Unit 4357 Macon, GA | 2.0 | 1.0 | 750 | $750 | $1.00 | 43d | 1 | 1.06mi |
| 1020 Radio Dr Macon, GA | 2.0 | 1.0 | 850 | $889 | $1.05 | 43d | 1 | 1.10mi |
| 4342 Barrington Pl Macon, GA | 2.0 | 1.5 | 1092 | $950 | $0.87 | 21d | 1 | 1.11mi |
| 3324 Vineville Ave Unit 63B Macon, GA | 2.0 | 1.0 | 1125 | $1,050 | $0.93 | 21d | 1 | 1.12mi |
| 3324 Vineville Ave Unit 57C Macon, GA | 2.0 | 1.0 | 914 | $1,050 | $1.15 | 13d | 1 | 1.12mi |
| 3576 Vineville Ave Unit 3550-D-LT Macon, GA | 2.0 | 2.0 | 863 | $995 | $1.15 | 13d | 1 | 1.12mi |
| 4353 Barrington Pl Macon, GA | 2.0 | 1.5 | 1108 | $1,000 | $0.90 | 13d | 1 | 1.14mi |
| 3413 Vineville Ave Unit 3419 Macon, GA | 3.0 | 1.5 | 1200 | $1,200 | $1.00 | 21d | 1 | 1.17mi |
| 133 Auburn Ave Macon, GA | 2.0 | 1.0 | 880 | $895 | $1.02 | 43d | 1 | 1.19mi |
| 3330 Ridge Ave Unit D4 Macon, GA | 2.0 | 1.5 | 1056 | $1,050 | $0.99 | 13d | 1 | 1.20mi |
| 4151 Log Cabin Dr Macon, GA | 1.0–2.0 | 1.0–2.0 | 836 | $1,434 | $1.72 | 43d | 1 | 1.28mi |
| 4158 Log Cabin Dr Macon, GA | 3.0 | 1.5 | 1380 | $1,375 | $1.00 | 21d | 1 | 1.31mi |
| 3034 Churchill St Macon, GA | 2.0 | 1.0 | 872 | $900 | $1.03 | 21d | 1 | 1.39mi |
| 230 Roycrest Dr Macon, GA | 3.0 | 2.0 | 1261 | $1,300 | $1.03 | 43d | 1 | 1.40mi |
| 1528 Wellworth Ave Macon, GA | 3.0 | 1.0 | 1126 | $1,000 | $0.89 | 21d | 1 | 1.42mi |
| 3645 Mercer University Dr Macon, GA | 1.0–2.0 | 1.0 | 874 | $850 | $0.97 | 43d | 4 | 1.42mi |
| 4265 Hillary Pl Macon, GA | 4.0 | 2.0 | 1250 | $1,450 | $1.16 | 43d | 1 | 1.45mi |
Listing history 6 events
-
2026-05-31days on market $100,000 Active 96 DOM
-
2026-05-30days on market $100,000 Active 95 DOM
-
2026-02-24$100,000 New 842-char remark
Show marketing remark (842 chars)
Don't miss this prime investment opportunity in Macon! This 3-bedroom, 2-bath home offers a desirable layout and excellent upside for investors looking to add to their rental portfolio or complete their next flip. Featuring an open floorplan, this home provides a bright and spacious feel that today's tenants and buyers love. The seamless flow between living, dining, and kitchen areas creates an inviting space ideal for everyday living and entertaining. Step outside to a large rear deck perfect for gatherings, relaxing evenings, or adding extra appeal for future renters. With the right updates, this property has strong income potential and room to build equity. Whether you're a seasoned investor or just getting started, this Macon opportunity checks all the boxes. Act fast properties with this kind of potential don't last long!
-
2026-02-24$100,000 Active 842-char remark
Show marketing remark (842 chars)
Don't miss this prime investment opportunity in Macon! This 3-bedroom, 2-bath home offers a desirable layout and excellent upside for investors looking to add to their rental portfolio or complete their next flip. Featuring an open floorplan, this home provides a bright and spacious feel that today's tenants and buyers love. The seamless flow between living, dining, and kitchen areas creates an inviting space ideal for everyday living and entertaining. Step outside to a large rear deck perfect for gatherings, relaxing evenings, or adding extra appeal for future renters. With the right updates, this property has strong income potential and room to build equity. Whether you're a seasoned investor or just getting started, this Macon opportunity checks all the boxes. Act fast properties with this kind of potential don't last long!
-
2006-12-07soldstatus $231,000
-
2005-04-22soldstatus $12,000
ⓘ Source: listings_history table (triggers on properties + properties_extension) + one-shot
backfill from property_details.listing_events for pre-trigger history.
Tax reassessment forecast GA · Resets to sale price
- Current annual tax
- $952 · $79/mo
- Projected year-2 tax
- $952 · $79/mo
- Expected delta
- $0/yr ($0/mo · -0.0%)
ⓘ Screening estimate from a state-policy table — verify with the county assessor before closing.
Climate risk First Street
- Flood 1/10 Low FEMA zone X (unshaded) · 0% chance over 30 yrs
- Wildfire 2/10 Low
- Heat 6/10 Major 7 d/yr ≥108°F today · 17 d/yr by 30 yrs out
- Wind 6/10 Major 65% chance of damaging wind over 30 yrs
- Air quality 3/10 Moderate 3 unhealthy d/yr today · 4 by 30 yrs out
Nearby sold comps map
Loading sold comps map…
Walkable amenities ~0.75 mi
Loading nearby amenities…
Taxation est. · year 1
- Rental income
- $13,437
- − Mortgage interest
- −$5,602
- − Property taxes
- −$952
- − Insurance
- −$500
- − Repairs & maintenance
- −$1,075
- − Management
- −$1,075
- − Depreciation
- −$2,909
- Taxable income
- $1,325
- Est. tax owed @ 24.0%
- −$318
- After-tax cash flow
- $2,553/yr
For passive investors: Depreciation is non-cash, so a rental often shows a tax loss while cash-flowing — sheltering income. Rental losses are passive: they offset passive income freely, and up to $25,000/yr can offset ordinary (W-2) income if you actively participate and your MAGI is under $100k (phasing out to $0 by $150k); unused losses carry forward. On sale, claimed depreciation is recaptured at up to 25%, and gains may owe capital-gains tax (a 1031 exchange can defer both). Figures are a year-1 estimate at your 24.0% rate — not tax advice; consult a CPA.
Schools (NCES district)
- District
- Bibb County
- NCES district ID
- 1300420
- Math proficiency
- 11% ▼ -14.00%
- Reading proficiency
- 18% ▼ -11.00%
- Median HH income
- $37,426
- Composite
- 12.13/100
- National rank
- #9654
- State rank
- #161 of 174 in GA
Livability — Macon-Bibb County
No livability data for this city. (Only ~50 U.S. cities are tracked.)
Census & demographics
- Census place
- Macon-Bibb County, GA
- County
- Bibb County · 164,332 people
- City population
- 143,186
- Metro
- Macon-Bibb County, GA
- Population (ZIP)
- 32,421
- Household income
- $38,784
- Rent vs Own
- Severe rent burden
- 2674.0
Population outlook (Bibb County) Hauer SSP2
- Today (2025)
- 148,772 people
- By 2030
- 145,904 · -1.9%
- By 2040
- 139,404 · -6.3%
- By 2050
- 131,603 · -11.5%
- By 2075
- 111,050 · -25.4%
- By 2100
- 83,346 · -44.0%
Race, ethnicity, and origin ACS 2023
- Neighborhood character
- Predominantly Black (65%)
- Race & ethnicity
- Black 65% White 28% Hispanic / Latino 3% Two or more races 2% Asian 1%
- Common ancestry
- Serbian 2% Slovak 1% Lithuanian 1%
- Foreign-born
- 2% · Canada
- Languages at home
- 96% English-only · Spanish 2% French/Haitian/Cajun 1%
Political lean MEDSL · Bibb
- 2024 margin
- Strong D (+22.4) · D 61.0% · R 38.5%
- 2008→2024 swing
- +4.4pp toward D · 2008: 18.0pp · 2024: 22.4pp
- All cycles
- 2024: D+22.4 2020: D+23.8 2016: D+20.2 2012: D+20.0 2008: D+18.0
Not yet ingested
- Civics
- —
Market trends
- HPI YoY
- ▼ -135.44%
- Current HPI
- 194.5459
- Rent YoY
- ▲ 4.61%
- Metro
- Macon-Bibb County, GA
- State GDP YoY
- ▲ 2.66%
- F500 in state
- 28
Industry mix (Fortune 500 HQ in GA)
| Industry | F500 HQs | Revenue |
|---|---|---|
| Paper / Packaging | 2 | $29B |
|
||
| Retail | 1 | $160B |
|
||
| Transportation / Logistics | 1 | $91B |
|
||
| Airlines | 1 | $62B |
|
||
| Consumer Goods | 1 | $47B |
|
||
| Utilities | 1 | $25B |
|
||
Price history
+733.3% since first listed4 events — show timeline
- 2026-02-24 Listed $100,000 FMLS
- 2026-02-24 Listed $100,000 GAMLS
- 2006-12-07 Sold (Public Records) $231,000 Public Records
- 2005-04-22 Sold (Public Records) $12,000 Public Records
Property tax history
+4.7%/yrLatest (2025): $952 · +3.4% YoY. Source: county tax records.
Cash-flow waterfall
monthlySold comps — $/sqft
last 12 mo · ≤1 miLoading sold comps…