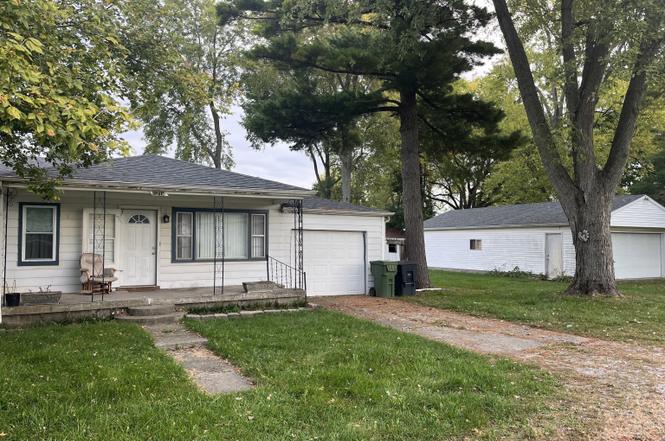
1214 E Third St · Greenfield, IN
Flood risk 4/10 · Minor
- FEMA flood zone
- X (shaded)
- Chance of flooding over 30 yrs
- 0.22%
- Est. flood insurance / yr
- $507 – $1,088
Fire risk 1/10 · Minimal
- Est. fire insurance / yr
- $717 – $1,331
Heat risk 3/10 · Minor
- Hot days now (above 102°F)
- 7 days/yr
- Hot days in 30 yrs
- 18 days/yr
Wind risk 2/10 · Minimal
- Chance of severe wind over 30 yrs
- 1.0%
Air-quality risk 2/10 · Minimal
- Unhealthy air days now
- 1 days/yr
- Unhealthy air days in 30 yrs
- 2 days/yr
Risk factors via First Street. Map © Google.
Why this score? — see what drove the B- grade
The composite is a weighted blend of 9 inputs, each scored 0–100. Each bar is that input's sub-score; the figure is the points it added to the 100-point composite (weight × sub-score).
- Cash flow +25.3/30.0
- ARV discount +15.0/15.0
- DSCR +8.4/10.0
- 1% rule +6.0/10.0
- Schools +4.0/10.0
- Livability +3.7/5.0
- Rent growth +3.2/5.0
- Condition / age +2.5/5.0
- Appreciation +0.0/10.0
$165,000
🖨 Deal sheet 📄 Offer letter ✓ Due diligence
Listing remarks
This home is the Original family home owned by seller's parents. Property includes 2 lots and has been used as rental with 3 bedrooms and attached one car garage w/ built in storage area. Property also Includes the Additional detached 24x40 garage w/ overhead door, service door and separate electric that has been occupied by seller. Big back yard with alley access. There is an older storage building that sits at the back of property that has no value. This could be a Great Investor opportunity. Roof approx 7 yrs old, New GFA furnace 2025. Located walking distance to city pool and community splash pad and shops.
Key facts
- Alley access
- Community splash pad
- 2 lots
Tags
Property features AI
Finance
- Other: Horse amenities: none
- Financial info: No financial details provided
- HOA & community: No HOA information provided
Exterior
- Parking: Attached garage; Finished garage with service door and garage door opener; Garage space for 1 car
- Security: No specific security features provided
- Utilities: Public water; Municipal sewer connected; 100 amp electrical service; Electricity, natural gas, cable available/connected; Sewer and water connected
- Home design: Single-family residence; One story; Faces north; Property listed as fixer condition
- Construction: Vinyl siding; Block foundation; Built as a one-level home
- Exterior features: Approximately 0.36-acre lot (1/4–1/2 acre)
Interior
- Kitchen: Gas cooktop
- Bedrooms: Three bedrooms, all on the main level; Bedroom 2 (14 x 9); Bedroom 3 (11 x 9)
- Flooring: No flooring details provided
- Bathrooms: One full bath (main level)
- Heating & cooling: Forced air heating; No central cooling
- Interior features: Woodwork stained or painted; Living room (15 x 15); Additional main-level room (12 x 12)
- Laundry & utility: No specific laundry details provided
Neighborhood map
What this means for you Summary
Snapshot
- This is a 3-bed/1.0-bath single-family listed at $165k.
Deal economics
- At list price, monthly cash flow is $377 ($5k/yr) — positive.
- The deal already cash-flows at list — no discount required.
- Meets the 1% rule at list price ($2k rent vs $165k).
- Recommended offer: $145k (12.0% below list) — sets the bar for market timing.
- Cap rate 9.0% vs local median 4.4% in Greenfield — top-decile yield for the area; either an underpriced asset or a hidden risk that comps aren't pricing in. Stress-test before assuming the spread holds.
Location & tenants
- Location reads 73/100 on livability (#88 in IN) — a middle-class / working-renter tenant base. Strengths: cost of living A+, housing A+; Watch: amenities F, commute F.
- Greenfield-Central Community Schools (other): math 47% / reading 45% proficiency, ranked #83 of 301 in IN (top 28%) — families likely to look elsewhere, expect single-tenant / working-renter base with shorter leases.
- Zoned schools: Greenfield-Central High School (math 37% / reading 65%, grade D+, #115 of 369 statewide, top 31%, 1,462 students, 35% FRL).
- Market conditions: Rents rising (+2.9%/yr); 481 active listings in the ZIP; 8 comparable units currently listed for rent nearby; rentals leasing fast (median 4d on market — plan ~1-2 weeks tenant-placement turnaround); solid renter incomes; 1,091 units permitted in Hancock County in 2024 (0 in 5+ unit buildings).
Forward outlook
- Local home prices are declining (-3.0%/yr); year-one equity from $1k of loan paydown is wiped out by about $5k of value loss. Plan a longer hold.
- Hancock County population projected at +7% by 2050 — modest demand growth; plan on rents tracking national, not racing it.
Negotiation context
- It's been on market 200 days — a 12% lower offer ($145k) is reasonable based on typical stale-listing flexibility.
- 2 sale attempts; this cycle's ask has dropped $20k (11%) from the opening price — seller is motivated, your offer sets the floor, not the list.
Risks & watch-outs
- Watch-outs: built in 1940 — expect roof / HVAC / electrical / plumbing capex.
Questions for the listing agent
- It's been on market 200 days. Have you received any prior offers? Is the seller open to a 12% concession, seller financing, or rate buy-down credit?
- Built in 1940 — when were the roof, HVAC, electrical panel, plumbing, and water heater last replaced?
- Why hasn't it sold? Are there any deal-killer items the seller is aware of (foundation, flood, title, zoning, code violations)?
- Is there a deadline driving the sale (1031 exchange, divorce, estate, relocation)? That informs how much negotiation room exists.
- Schools are B-rated — typically a magnet for longer-tenancy family renters. What's the average tenant stay here, and is there a school-zone premium baked into asking?
- What's the average days-on-market for RENTAL listings here right now (not sales)? A rising rental-DOM trend means longer vacancies and softer asking-rent achievability than the comps imply.
- What's the recent tenant-quality profile in this submarket — average credit score on applications, eviction rate, late-payment / NSF rate, and stable-employment percentage? A property-management company in the area should have these aggregated.
- How much new for-sale + rental construction is in the pipeline within 1–3 miles? Heavy new supply typically softens prices + rents 12–24 months out; constrained supply supports both.
Investment metrics
- 1% rule
- 1.10% ✓
- Cap rate
- 9.04%
- Cash-on-cash
- 9.80%
- DSCR
- 1.44
- GRM
- 7.5
CMA / ARV
- ARV (on-the-fly)
- $211,680
- Comps found
- 12
Show comp detail 12 sales within ~0.75 mi
| Address | Dist | Beds/Ba | Sqft | Sold | Price | $/sf | Match |
|---|---|---|---|---|---|---|---|
| 1214 E Third St | 0.00mi | 3/1.0 | 1,080 (0%) | 0mo | $125,000 | $116 | 100 |
| 1083 E South St | 0.31mi | 3/1.0 | 1,008 (-7%) | 1mo | $95,000 | $94 | 74 |
| 319 Brookstone Dr | 0.37mi | 3/2.0 | 1,110 (+3%) | 2mo | $237,500 | $214 | 73 |
| 310 Cherry St | 0.04mi | 3/1.0 | 936 (-13%) | 5mo | $150,000 | $160 | 72 |
| 1616 Sweetwater Ln | 0.43mi | 3/2.0 | 1,110 (+3%) | 1mo | $235,000 | $212 | 71 |
| 1647 Sweetwater Ln | 0.45mi | 3/2.0 | 1,110 (+3%) | 6mo | $229,900 | $207 | 65 |
| 1696 Carlton Dr | 0.47mi | 3/2.0 | 1,110 (+3%) | 13mo | $236,000 | $213 | 58 |
| 1683 Sweetwater Ln | 0.48mi | 3/2.0 | 1,110 (+3%) | 13mo | $232,000 | $209 | 58 |
| 1652 Sweetwater Ln | 0.46mi | 2/2.0 (-1) | 1,022 (-5%) | 10mo | $200,000 | $196 | 52 |
| 1625 Willowview Ln | 0.41mi | 3/2.0 | 1,236 (+14%) | 5mo | $215,000 | $174 | 49 |
| 604 Wood St | 0.70mi | 2/1.0 (-1) | 1,116 (+3%) | 12mo | $209,000 | $187 | 47 |
| 125 Howard St | 0.47mi | 2/1.5 (-1) | 1,238 (+15%) | 12mo | $224,000 | $181 | 36 |
Match score weights: distance 35% · size 25% · config 20% · recency 20%. Top-matched comps best support the ARV.
Projected returns pro-forma
-3.0% appreciation · 2.88% rent growth · sell at horizon
- IRR
- -1.7%
- Equity multiple
- 0.94×
- Total profit
- $-2,950
- Equity at exit
- $24,602
- IRR
- 7.9%
- Equity multiple
- 1.59×
- Total profit
- $27,386
- Equity at exit
- $14,266
Cash invested: $46,200 (down + closing). Projections, not guarantees.
Landlord ↔ Tenant lean methodology
- Overall (STATE)
- 90 Strongly Landlord-Friendly
- State Indiana
- 90 Strongly Landlord-Friendly · R+11
- County
- — inherits STATE
- City
- — inherits STATE
ZIP-level market 46140
- Rents YoY
- 2.9%
- Active inventory
- 481
- Price-to-rent
- 7.5×
Monthly cashflow live
- Estimated rent
- $1,821 high interval (Pro) →
- Mortgage (P&I)
- −$865
- Tax from tax record
- −$127 /mo · $1,530/yr
- Insurance
- −$69
- HOA
- −$0
- Vacancy / Maint / Mgmt
- −$382
- Net cashflow
- $377
Break-even live
UW: 25.0% down · 7.5% · 30yr · 1.5% tax · 5.0% vac · 8.0% maint · 8.0% mgmt
Financing live
Cash to close
- Down payment
- $41,250
- Closing costs
- $4,950
- Reserves months
- —
- Total cash needed
- —
Loan-product check · same deal, 3 products live
Conventional
25% down · 7.5% · 30yr
- Down + closing
- —
- Monthly P&I
- —
- Monthly cashflow
- —
- DSCR
- —
- Eligible?
- —
Personal DTI + credit; lowest rate.
DSCR
20% down · 8.5% · 30yr
- Down + closing
- —
- Monthly P&I
- —
- Monthly cashflow
- —
- DSCR
- —
- Eligible?
- —
No personal income docs; deal must DSCR.
Hard money
10% down · 12.0% · 12mo
- Down + closing
- —
- Monthly P&I
- —
- Monthly cashflow
- —
- DSCR
- —
- Eligible?
- —
Short-term bridge; refi at stabilization.
Rent comps 8 comps
| Address | Beds | Baths | Sqft | Rent | $/sqft | DOM | Units | Dist |
|---|---|---|---|---|---|---|---|---|
| 1027 E Fourth St Greenfield, IN | 3.0 | 2.0 | 1430 | $1,700 | $1.19 | 23d | 1 | 0.14mi |
| 210 Flagstone Dr Greenfield, IN | 1.0–3.0 | 1.0–2.5 | 1084 | $2,254 | $2.08 | 1d | 17 | 0.17mi |
| 1014 E Seventh St Greenfield, IN | 3.0 | 1.0 | 1192 | $1,400 | $1.17 | 4d | 1 | 0.29mi |
| 432 Baldwin St Greenfield, IN | 2.0 | 1.0 | 788 | $1,425 | $1.81 | 23d | 1 | 0.54mi |
| 550 Wood St Greenfield, IN | 2.0 | 1.0 | 1162 | $1,200 | $1.03 | 3d | 1 | 0.67mi |
| 917 E McKenzie Rd Greenfield, IN | 1.0–2.0 | 1.0–1.5 | 918 | $1,199 | $1.31 | 1d | 4 | 0.74mi |
| 220 Walker St Greenfield, IN | 3.0 | 1.0 | 1101 | $1,400 | $1.27 | 4d | 1 | 0.83mi |
| 685 Gondola Run Greenfield, IN | 3.0 | 2.0 | 1058 | $1,750 | $1.65 | 1d | 1 | 1.04mi |
Listing history 5 events
-
2026-05-19status Pending
-
2026-04-23price $165,000
-
2026-04-21status Active
-
2026-04-05status Pending
-
2025-10-13$185,000 Active
ⓘ Source: listings_history table (triggers on properties + properties_extension) + one-shot
backfill from property_details.listing_events for pre-trigger history.
Tax reassessment forecast IN · Partial reset (capped growth)
- Current annual tax
- $1,530 · $127/mo
- Projected year-2 tax
- $1,530 · $127/mo
- Expected delta
- $0/yr ($0/mo · 0.0%)
ⓘ Screening estimate from a state-policy table — verify with the county assessor before closing.
Climate risk First Street
- Flood 4/10 Moderate FEMA zone X (shaded) · 22% chance over 30 yrs
- Wildfire 1/10 Low
- Heat 3/10 Moderate 7 d/yr ≥102°F today · 18 d/yr by 30 yrs out
- Wind 2/10 Low 100% chance of damaging wind over 30 yrs
- Air quality 2/10 Low 1 unhealthy d/yr today · 2 by 30 yrs out
Nearby sold comps map
Loading sold comps map…
Walkable amenities ~0.75 mi
Loading nearby amenities…
Taxation est. · year 1
- Rental income
- $21,854
- − Mortgage interest
- −$9,243
- − Property taxes
- −$1,530
- − Insurance
- −$825
- − Repairs & maintenance
- −$1,748
- − Management
- −$1,748
- − Depreciation
- −$4,800
- Taxable income
- $1,960
- Est. tax owed @ 24.0%
- −$471
- After-tax cash flow
- $4,056/yr
For passive investors: Depreciation is non-cash, so a rental often shows a tax loss while cash-flowing — sheltering income. Rental losses are passive: they offset passive income freely, and up to $25,000/yr can offset ordinary (W-2) income if you actively participate and your MAGI is under $100k (phasing out to $0 by $150k); unused losses carry forward. On sale, claimed depreciation is recaptured at up to 25%, and gains may owe capital-gains tax (a 1031 exchange can defer both). Figures are a year-1 estimate at your 24.0% rate — not tax advice; consult a CPA.
Schools (NCES district)
- District
- Greenfield-Central Community Schools
- NCES district ID
- 1804050
- Math proficiency
- 47% ▼ -12.00%
- Reading proficiency
- 45% ▼ -11.00%
- Median HH income
- $55,533
- Composite
- 40.01/100
- National rank
- #3827
- State rank
- #83 of 301 in IN
Livability — Greenfield
- Score
- 73/100
- State rank
- #88
- US rank
- #5094
Category grades
Schools grade is shown separately in the Schools card above.
Census & demographics
- Census place
- Greenfield, IN
- County
- Hancock County · 59,521 people
- City population
- 43,511
- Metro
- Indianapolis-Carmel-Anderson, IN
- Population (ZIP)
- 43,511
- Household income
- $83,056
- Rent vs Own
- Severe rent burden
- 795.0
Population outlook (Hancock County) Hauer SSP2
- Today (2025)
- 77,820 people
- By 2030
- 79,914 · +2.7%
- By 2040
- 82,734 · +6.3%
- By 2050
- 83,348 · +7.1%
- By 2075
- 82,439 · +5.9%
- By 2100
- 74,181 · -4.7%
Race, ethnicity, and origin ACS 2023
- Neighborhood character
- Predominantly White (92%)
- Race & ethnicity
- White 92% Two or more races 5% Hispanic / Latino 3% Black 1%
- Common ancestry
- Italian 3% Lithuanian 3% Slovak 1%
- Foreign-born
- 3% · Canada
- Languages at home
- 96% English-only · Spanish 2% Other Indo-European 1%
Political lean MEDSL · Hancock
- 2024 margin
- Solid R (+33.7) · D 32.2% · R 65.9% · Other 1.9%
- 2008→2024 swing
- -4.1pp toward R · 2008: -29.6pp · 2024: -33.7pp
- All cycles
- 2024: R+33.7 2020: R+37.5 2016: R+44.8 2012: R+41.0 2008: R+29.6
Not yet ingested
- Civics
- —
Market trends
- HPI YoY
- ▼ -131.67%
- Current HPI
- 225.0367
- Rent YoY
- ▲ 2.88%
- Metro
- Indianapolis-Carmel-Anderson, IN
- State GDP YoY
- ▲ 2.90%
- F500 in state
- 18
Industry mix (Fortune 500 HQ in IN)
| Industry | F500 HQs | Revenue |
|---|---|---|
| Industrial Machinery | 2 | $37B |
|
||
| Healthcare | 1 | $177B |
|
||
| Pharmaceuticals | 1 | $45B |
|
||
| Metals / Steel | 1 | $18B |
|
||
| Agriculture | 1 | $17B |
|
||
| Packaging | 1 | $12B |
|
||
Price history
-10.8% since first listed5 events — show timeline
- 2026-05-19 Pending — MIBOR as Distributed by MLS Grid
- 2026-04-23 Price Changed $165,000 MIBOR as Distributed by MLS Grid
- 2026-04-21 Relisted — MIBOR as Distributed by MLS Grid
- 2026-04-05 Pending — MIBOR as Distributed by MLS Grid
- 2025-10-13 Listed $185,000 MIBOR as Distributed by MLS Grid
Property tax history
+11.1%/yrLatest (2025): $1,530 · -1.3% YoY. Source: county tax records.
Cash-flow waterfall
monthlySold comps — $/sqft
last 12 mo · ≤1 miLoading sold comps…