 Triplex
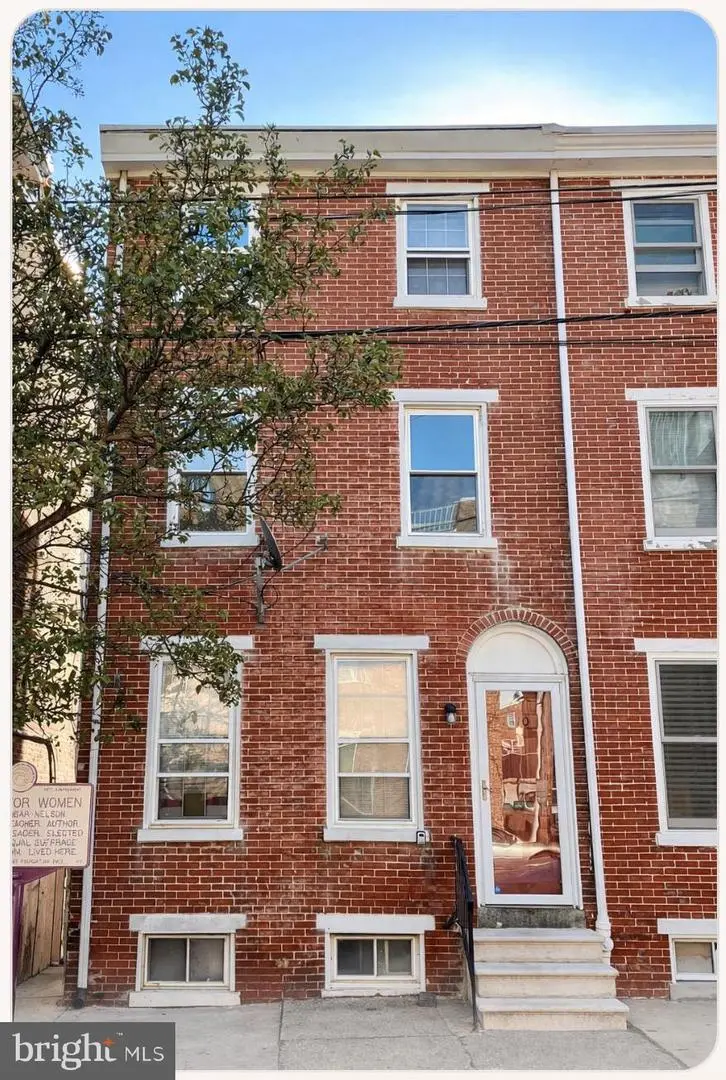
1310 N French St · Wilmington, DE
Flood risk 1/10 · Minimal
- FEMA flood zone
- X (unshaded)
- Chance of flooding over 30 yrs
- 0.0%
- Est. flood insurance / yr
- $473 – $860
Fire risk 1/10 · Minimal
- Est. fire insurance / yr
- $476 – $884
Heat risk 8/10 · Major
- Hot days now (above 103°F)
- 7 days/yr
- Hot days in 30 yrs
- 16 days/yr
Wind risk 6/10 · Moderate
- Chance of severe wind over 30 yrs
- 27.0%
Air-quality risk 3/10 · Minor
- Unhealthy air days now
- 3 days/yr
- Unhealthy air days in 30 yrs
- 5 days/yr
Risk factors via First Street. Map © Google.
Why this score? — see what drove the C+ grade
The composite is a weighted blend of 9 inputs, each scored 0–100. Each bar is that input's sub-score; the figure is the points it added to the 100-point composite (weight × sub-score).
- Cash flow +30.0/30.0
- 1% rule +10.0/10.0
- DSCR +10.0/10.0
- Livability +3.2/5.0
- Rent growth +2.9/5.0
- Schools +2.5/10.0
- Condition / age +2.5/5.0
- ARV discount +0.0/15.0
- Appreciation +0.0/10.0
$315,000
🖨 Deal sheet 📄 Offer letter ✓ Due diligence
Multi-family units
County records classify this as Multi-Family (2-4 Unit). Listing-text estimate: 3 units. confirmed
Listing remarks MLS
Great Tri-plex in the downtown business district area. This all brick Twin home features 3 units. Unit 1 is a 2 bedroom unit that has just been painted and had new carpet installed. Nice sized kitchen with a living room and dining room. Unit 2 is a one bedroom unit with full bath and living room. Unit 3 is an efficiency or studio apartment. Unit 1 typically rents for $850-$900/m. Unit 2 is currently rented on a 1 year lease at $650/m. Unit 3 is also rented on a 1 year lease at $550/m. This would make a great turn key rental or live in one unit and rent the others.
Key facts
- 2,178 sq ft lot
- Built 1900
- Listed 24 days
Property features AI
Finance
- Financial info: Property assessed and tax information available (assessed values and tax amounts recorded); Existing leases are yearly
Exterior
- Parking: On-street parking
- Utilities: Public water; Public sewer; Electric service
- Home design: Semi-detached structure; Flat roof; Fee simple ownership; Year built sourced from assessor
- Construction: Brick construction; Block and stone foundation; Other structures above and below grade
- Exterior features: Sidewalks; Street lights; Lot dimensions approximately 18.00 x 116.10
Interior
- Bedrooms: One single-room unit; One one-bedroom unit; One two-bedroom unit
- Heating & cooling: Baseboard electric heating; Window air conditioning units (electric); Electric hot water
- Interior features: Partial basement; Living area reported as estimated; Three units currently leased
Neighborhood map
What this means for you Summary
Snapshot
- This is a 1×2bd/1ba + 1×1bd/1ba + 1×?bd/1ba units multifamily listed at $315k.
Deal economics
- At list price, monthly cash flow is $2k ($23k/yr) — positive. Per door: $642/mo.
- The deal already cash-flows at list — no discount required.
- Meets the 1% rule at list price ($5k rent vs $315k).
- Recommended offer: $310k (1.5% below list) — sets the bar for market timing.
- Cap rate 13.6% vs local median 5.6% in Wilmington — top-decile yield for the area; either an underpriced asset or a hidden risk that comps aren't pricing in. Stress-test before assuming the spread holds.
Location & tenants
- Location reads 64/100 on livability (#52 in DE) — a middle-class / working-renter tenant base. Strengths: cost of living A+, housing A; Watch: employment D+, schools D, commute D.
- Christina School District (suburban): math 22% / reading 33% proficiency, ranked #18 of 26 in DE (top 69%) — low school quality limits family demand, transient renter base, plan for 1-2y turnover.
- Market conditions: Rents rising (+1.6%/yr); 75 active listings in the ZIP; 19 comparable units currently listed for rent nearby; rentals lingering (median 44d on market — plan ~5-8 weeks vacancy on turnover, expect pricing pressure); 53% of comp listings sitting > 30 days — soft ceiling on asking rent; 1,367 units permitted in New Castle County in 2024 (201 in 5+ unit buildings).
- At $4,848/mo this rent would consume 110% of the median local household income ($53k/yr) (locally 919% of renters already pay >50% of income on rent) — very limited rent-growth headroom before tenants either downsize or default.
Forward outlook
- Local home prices are declining (-3.0%/yr); year-one equity from $2k of loan paydown is wiped out by about $9k of value loss. Plan a longer hold.
- New Castle County population projected at +9% by 2050 — modest demand growth; plan on rents tracking national, not racing it.
- At projected returns (-3.0% appreciation + 1.6% rent growth), your $88k cash investment doubles in ~5 years — after that, you're playing with house money.
Negotiation context
- It's been on market 25 days — a 2% lower offer ($310k) is reasonable based on typical stale-listing flexibility.
- 2 sale attempts since 23y ago; this cycle's ask is 142% above the opening price — seller raised mid-cycle; expect resistance to lowballs.
- Current owner paid $130k; list at $315k implies a 142% gain — meaningful room to come down on a strong offer.
Risks & watch-outs
- Watch-outs: built in 1900 — expect roof / HVAC / electrical / plumbing capex.
- Climate carrying-cost: major wind risk, 27% chance of damaging wind over 30y; extreme-heat days projected 7→16/yr by 2055 (HVAC capex compounding) — expect insurance premiums to compound above CPI over the hold.
Questions for the listing agent
- Can we see the unit-by-unit rent roll, current vacancy, and any below-market leases? What's the average tenancy length?
- What capital expenditures (roof, boiler, parking lot, exteriors) have been made in the last 5 years, and what's planned in the next 2?
- Built in 1900 — when were the roof, HVAC, electrical panel, plumbing, and water heater last replaced?
- Is there a deadline driving the sale (1031 exchange, divorce, estate, relocation)? That informs how much negotiation room exists.
- Schools are D-rated, which usually means shorter tenancies and higher turnover. Who's the typical renter profile here, and what's been the actual vacancy rate?
- Crime grade is F in this area — have there been break-ins, vandalism, or insurance claims at this property in the last 3 years? What carrier currently insures it and at what premium?
- What's the average days-on-market for RENTAL listings here right now (not sales)? A rising rental-DOM trend means longer vacancies and softer asking-rent achievability than the comps imply.
- What's the recent tenant-quality profile in this submarket — average credit score on applications, eviction rate, late-payment / NSF rate, and stable-employment percentage? A property-management company in the area should have these aggregated.
- How much new apartment / multifamily construction is in the pipeline within 1–3 miles? Heavy new supply (>2% of stock underway) typically softens rents 12–24 months out; light construction supports rent growth.
Investment metrics
- 1% rule
- 1.54% ✓
- Cap rate
- 13.63%
- Cash-on-cash
- 26.19%
- DSCR
- 2.17
- GRM
- 5.4
CMA / ARV
- ARV (on-the-fly)
- $211,750
- Comps found
- 5
Show comp detail 5 sales within ~0.75 mi
| Address | Dist | Beds/Ba | Sqft | Sold | Price | $/sf | Match |
|---|---|---|---|---|---|---|---|
| 1210 N King St | 0.08mi | 5/— (+1) | 1,930 (+10%) | 1mo | $233,000 | $121 | 73 |
| 1806 N West St | 0.38mi | 3/— (-1) | 1,700 (-3%) | 6mo | $270,000 | $159 | 68 |
| 715 8th St | 0.67mi | 4/4.0 | 1,750 (0%) | 14mo | $259,900 | $149 | 53 |
| 2239 N Pine St | 0.50mi | 4/2.0 | 1,650 (-6%) | 19mo | $180,000 | $109 | 47 |
| 405 W 7th St | 0.55mi | 3/2.0 (-1) | 1,925 (+10%) | 17mo | $180,000 | $94 | 34 |
Match score weights: distance 35% · size 25% · config 20% · recency 20%. Top-matched comps best support the ARV.
Projected returns pro-forma
-3.0% appreciation · 1.59% rent growth · sell at horizon
- IRR
- 18.4%
- Equity multiple
- 1.73×
- Total profit
- $64,672
- Equity at exit
- $46,968
- IRR
- 25.8%
- Equity multiple
- 3.12×
- Total profit
- $186,738
- Equity at exit
- $27,235
Cash invested: $88,200 (down + closing). Projections, not guarantees.
Landlord ↔ Tenant lean methodology
- Overall (STATE)
- 70 Landlord-Friendly
- State Delaware
- 70 Landlord-Friendly · D+7
- County
- — inherits STATE
- City
- — inherits STATE
ZIP-level market 19801
- Rents YoY
- 1.6%
- Active inventory
- 75
- Price-to-rent
- 15.3×
Monthly cashflow live
- Estimated rent
- $4,848 high interval (Pro) →
- Mortgage (P&I)
- −$1,652
- Tax from tax record
- −$122 /mo · $1,463/yr
- Insurance
- −$131
- HOA
- −$0
- Vacancy / Maint / Mgmt
- −$1,018
- Net cashflow
- $1,925
Break-even live
3-unit breakdown (identical units grouped — click to expand)
| Units | Beds | Baths | Est. rent |
|---|---|---|---|
| 1× unit | 2 | 1 | $1,720 |
| 1× unit | 1 | 1 | $1,517 |
| 1× unit | 0 | 1 | $1,611 |
| Total (3 units) | $4,848 | ||
UW: 25.0% down · 7.5% · 30yr · 1.5% tax · 5.0% vac · 8.0% maint · 8.0% mgmt
Financing live
Cash to close
- Down payment
- $78,750
- Closing costs
- $9,450
- Reserves months
- —
- Total cash needed
- —
Loan-product check · same deal, 3 products live
Conventional
25% down · 7.5% · 30yr
- Down + closing
- —
- Monthly P&I
- —
- Monthly cashflow
- —
- DSCR
- —
- Eligible?
- —
Personal DTI + credit; lowest rate.
DSCR
20% down · 8.5% · 30yr
- Down + closing
- —
- Monthly P&I
- —
- Monthly cashflow
- —
- DSCR
- —
- Eligible?
- —
No personal income docs; deal must DSCR.
Hard money
10% down · 12.0% · 12mo
- Down + closing
- —
- Monthly P&I
- —
- Monthly cashflow
- —
- DSCR
- —
- Eligible?
- —
Short-term bridge; refi at stabilization.
Rent comps 19 comps
| Address | Beds | Baths | Sqft | Rent | $/sqft | DOM | Units | Dist |
|---|---|---|---|---|---|---|---|---|
| 1217 N King St Wilmington, DE | 3.0 | 1.5 | 1300 | $2,145 | $1.65 | 18d | 1 | 0.09mi |
| 107 W 13th St Wilmington, DE | 3.0 | 1.5 | 1325 | $1,895 | $1.43 | 43d | 1 | 0.20mi |
| 801 N Orange St Wilmington, DE | 3.0 | 1.0–3.0 | 1118 | $3,991 | $3.57 | 2d | 117 | 0.42mi |
| 125 W 23rd St Wilmington, DE | 4.0 | 2.0 | 1672 | $1,995 | $1.19 | 43d | 1 | 0.54mi |
| 2401 N West St Wilmington, DE | 4.0 | 1.0 | 1650 | $1,900 | $1.15 | 15d | 1 | 0.59mi |
| 1010 Trenton Pl Wilmington, DE | 3.0 | 1.5 | 1475 | $2,350 | $1.59 | 16d | 1 | 0.60mi |
| 2518 N Tatnall St Wilmington, DE | 4.0 | 1.5 | 1575 | $1,995 | $1.27 | 43d | 1 | 0.63mi |
| 517 W 26th St Unit NA Wilmington, DE | 3.0 | 1.5 | 1344 | $1,900 | $1.41 | 24d | 1 | 0.84mi |
| 2923 N Washington St Wilmington, DE | 3.0 | 1.0 | 1225 | $1,600 | $1.31 | 1d | 1 | 0.92mi |
| 3003 N Washington St Wilmington, DE | 3.0 | 1.0 | 1250 | $1,950 | $1.56 | 43d | 1 | 0.94mi |
| 521 N Franklin St Wilmington, DE | 3.0 | 2.0 | 1500 | $1,850 | $1.23 | 3d | 1 | 1.04mi |
| 1029 Lancaster Ave Wilmington, DE | 4.0 | 1.5 | 1375 | $1,900 | $1.38 | 24d | 1 | 1.09mi |
| 547 Eastlawn Ave Wilmington, DE | 3.0 | 1.0 | 1400 | $1,995 | $1.43 | 43d | 1 | 1.18mi |
| 1624 W 9th St Wilmington, DE | 3.0 | 2.5 | 1780 | $2,500 | $1.40 | 18d | 1 | 1.23mi |
| 307 N Rodney St Wilmington, DE | 3.0 | 1.5 | 1425 | $2,000 | $1.40 | 43d | 1 | 1.25mi |
| 1110 Maple St Wilmington, DE | 3.0 | 1.0 | 1525 | $1,600 | $1.05 | 43d | 1 | 1.32mi |
| 507 Barrett St Wilmington, DE | 3.0 | 1.0 | 1275 | $1,700 | $1.33 | 43d | 1 | 1.33mi |
| 618 N Scott St Wilmington, DE | 3.0 | 1.5 | 1400 | $1,850 | $1.32 | 43d | 1 | 1.35mi |
| 21 Stroud St Unit 1 Wilmington, DE | 3.0 | 1.5 | 1875 | $1,900 | $1.01 | 43d | 1 | 1.48mi |
Listing history 22 events
-
2026-06-18days on market $315,000 Active 25 DOM
-
2026-06-17days on market $315,000 Active 24 DOM
-
2026-06-16days on market $315,000 Active 23 DOM
-
2026-06-15days on market $315,000 Active 22 DOM
-
2026-06-13days on market $315,000 Active 20 DOM
-
2026-06-13days on market $315,000 Active 19 DOM
-
2026-06-09days on market $315,000 Active 16 DOM
-
2026-06-08days on market $315,000 Active 15 DOM
-
2026-06-07days on market $315,000 Active 14 DOM
-
2026-06-04days on market $315,000 Active 11 DOM
-
2026-06-03days on market $315,000 Active 10 DOM
-
2026-06-02days on market $315,000 Active 9 DOM
-
2026-06-01days on market $315,000 Active 8 DOM
-
2026-05-31days on market $315,000 Active 7 DOM
-
2026-05-22historical $315,000
-
2019-06-24soldstatus $129,900
-
2019-06-21soldstatus $129,900 Closed 570-char remark
Show marketing remark (570 chars)
Great Tri-plex in the downtown business district area. This all brick Twin home features 3 units. Unit 1 is a 2 bedroom unit that has just been painted and had new carpet installed. Nice sized kitchen with a living room and dining room. Unit 2 is a one bedroom unit with full bath and living room. Unit 3 is an efficiency or studio apartment. Unit 1 typically rents for $850-$900/m. Unit 2 is currently rented on a 1 year lease at $650/m. Unit 3 is also rented on a 1 year lease at $550/m. This would make a great turn key rental or live in one unit and rent the others.
-
2019-05-22historical Active Under Contract 570-char remark
Show marketing remark (570 chars)
Great Tri-plex in the downtown business district area. This all brick Twin home features 3 units. Unit 1 is a 2 bedroom unit that has just been painted and had new carpet installed. Nice sized kitchen with a living room and dining room. Unit 2 is a one bedroom unit with full bath and living room. Unit 3 is an efficiency or studio apartment. Unit 1 typically rents for $850-$900/m. Unit 2 is currently rented on a 1 year lease at $650/m. Unit 3 is also rented on a 1 year lease at $550/m. This would make a great turn key rental or live in one unit and rent the others.
-
2019-05-13$129,900 Active 570-char remark
Show marketing remark (570 chars)
Great Tri-plex in the downtown business district area. This all brick Twin home features 3 units. Unit 1 is a 2 bedroom unit that has just been painted and had new carpet installed. Nice sized kitchen with a living room and dining room. Unit 2 is a one bedroom unit with full bath and living room. Unit 3 is an efficiency or studio apartment. Unit 1 typically rents for $850-$900/m. Unit 2 is currently rented on a 1 year lease at $650/m. Unit 3 is also rented on a 1 year lease at $550/m. This would make a great turn key rental or live in one unit and rent the others.
-
2003-09-03soldstatus $82,500 346-char remark
Show marketing remark (346 chars)
Great opportunity for an investor. This building is located close to MBNA and dowtown. Property needs updating but the structure appears very sound. Roof and exterior have been maintained. The former tenants lived in the property for more than 20 years. The price reflects the need for interior updating. School district to be verified by buyer.
-
2003-07-28historical 346-char remark
Show marketing remark (346 chars)
Great opportunity for an investor. This building is located close to MBNA and dowtown. Property needs updating but the structure appears very sound. Roof and exterior have been maintained. The former tenants lived in the property for more than 20 years. The price reflects the need for interior updating. School district to be verified by buyer.
-
2003-06-04$82,500 346-char remark
Show marketing remark (346 chars)
Great opportunity for an investor. This building is located close to MBNA and dowtown. Property needs updating but the structure appears very sound. Roof and exterior have been maintained. The former tenants lived in the property for more than 20 years. The price reflects the need for interior updating. School district to be verified by buyer.
ⓘ Source: listings_history table (triggers on properties + properties_extension) + one-shot
backfill from property_details.listing_events for pre-trigger history.
Tax reassessment forecast DE · Partial reset (capped growth)
- Current annual tax
- $1,463 · $122/mo
- Projected year-2 tax
- $1,645 · $137/mo
- Expected delta
- +$182/yr (+$15/mo · 12.4%)
ⓘ Screening estimate from a state-policy table — verify with the county assessor before closing.
Climate risk First Street
- Flood 1/10 Low FEMA zone X (unshaded) · 0% chance over 30 yrs
- Wildfire 1/10 Low
- Heat 8/10 Severe 7 d/yr ≥103°F today · 16 d/yr by 30 yrs out
- Wind 6/10 Major 27% chance of damaging wind over 30 yrs
- Air quality 3/10 Moderate 3 unhealthy d/yr today · 5 by 30 yrs out
Nearby sold comps map
Loading sold comps map…
Walkable amenities ~0.75 mi
Loading nearby amenities…
Taxation est. · year 1
- Rental income
- $58,176
- − Mortgage interest
- −$17,645
- − Property taxes
- −$1,463
- − Insurance
- −$1,575
- − Repairs & maintenance
- −$4,654
- − Management
- −$4,654
- − Depreciation
- −$9,164
- Taxable income
- $19,021
- Est. tax owed @ 24.0%
- −$4,565
- After-tax cash flow
- $18,533/yr
For passive investors: Depreciation is non-cash, so a rental often shows a tax loss while cash-flowing — sheltering income. Rental losses are passive: they offset passive income freely, and up to $25,000/yr can offset ordinary (W-2) income if you actively participate and your MAGI is under $100k (phasing out to $0 by $150k); unused losses carry forward. On sale, claimed depreciation is recaptured at up to 25%, and gains may owe capital-gains tax (a 1031 exchange can defer both). Figures are a year-1 estimate at your 24.0% rate — not tax advice; consult a CPA.
Schools (NCES district)
- District
- Christina School District
- NCES district ID
- 1000200
- Math proficiency
- 22% ▼ -12.00%
- Reading proficiency
- 33% ▼ -5.00%
- Median HH income
- $58,838
- Composite
- 24.93/100
- National rank
- #7567
- State rank
- #18 of 26 in DE
Livability — Wilmington
- Score
- 64/100
- State rank
- #52
- US rank
- #14251
Category grades
Schools grade is shown separately in the Schools card above.
Census & demographics
- Census place
- Wilmington, DE
- County
- New Castle County · 483,412 people
- City population
- 173,480
- Metro
- Philadelphia-Camden-Wilmington, PA-NJ-DE-MD
- Population (ZIP)
- 16,327
- Household income
- $52,810
- Rent vs Own
- Severe rent burden
- 919.0
Population outlook (New Castle County) Hauer SSP2
- Today (2025)
- 594,686 people
- By 2030
- 609,164 · +2.4%
- By 2040
- 632,154 · +6.3%
- By 2050
- 649,068 · +9.1%
- By 2075
- 687,771 · +15.7%
- By 2100
- 694,961 · +16.9%
Race, ethnicity, and origin ACS 2023
- Neighborhood character
- Predominantly Black (67%)
- Race & ethnicity
- Black 67% White 15% Hispanic / Latino 9% Two or more races 7% Asian 4%
- Hispanic origin (detail)
- Mexican 3% Puerto Rican 4%
- Common ancestry
- Romanian 1% Slovak 1% Italian 1%
- Foreign-born
- 9% · Canada, China, Vietnam
- Languages at home
- 87% English-only · Spanish 7% Other Indo-European 2% Chinese 1%
Political lean MEDSL · New Castle
- 2024 margin
- Solid D (+32.6) · D 65.5% · R 32.9% · Other 1.6%
- 2008→2024 swing
- -8.1pp toward R · 2008: 40.6pp · 2024: 32.6pp
- All cycles
- 2024: D+32.6 2020: D+37.1 2016: D+29.6 2012: D+34.1 2008: D+40.6
Not yet ingested
- Civics
- —
Market trends
- HPI YoY
- ▼ -112.65%
- Current HPI
- 151.1288
- Rent YoY
- ▲ 1.59%
- Metro
- Philadelphia-Camden-Wilmington, PA-NJ-DE-MD
- State GDP YoY
- —
- F500 in state
- 0
Price history
+281.8% since first listed8 events — show timeline
- 2026-05-22 Coming Soon $315,000 BRIGHT MLS
- 2019-06-24 Sold (Public Records) $129,900 Public Records
- 2019-06-21 Sold (MLS) $129,900 BRIGHT MLS
- 2019-05-22 Contingent — BRIGHT MLS
- 2019-05-13 Listed $129,900 BRIGHT MLS
- 2003-09-03 Sold (MLS) $82,500 BRIGHT MLS
- 2003-07-28 Listing Removed — BRIGHT MLS
- 2003-06-04 Listed $82,500 BRIGHT MLS
Property tax history
+3.9%/yrLatest (2024): $1,463 · +2.6% YoY. Source: county tax records.
Cash-flow waterfall
monthlySold comps — $/sqft
last 12 mo · ≤1 miLoading sold comps…