22681 Prospect Hts · Pine Mountain Lake, CA
Flood risk 1/10 · Minimal
- FEMA flood zone
- D
- Chance of flooding over 30 yrs
- 0.0%
- Est. flood insurance / yr
- $544 – $1,084
Fire risk 7/10 · Major
- Est. fire insurance / yr
- $659 – $1,223
Heat risk 5/10 · Moderate
- Hot days now (above 95°F)
- 8 days/yr
- Hot days in 30 yrs
- 20 days/yr
Wind risk 1/10 · Minimal
- Chance of severe wind over 30 yrs
- —
Air-quality risk 10/10 · Severe
- Unhealthy air days now
- 28 days/yr
- Unhealthy air days in 30 yrs
- 34 days/yr
Risk factors via First Street. Map © Google.
Why this score? — see what drove the C+ grade
The composite is a weighted blend of 9 inputs, each scored 0–100. Each bar is that input's sub-score; the figure is the points it added to the 100-point composite (weight × sub-score).
- Cash flow +28.6/30.0
- DSCR +10.0/10.0
- 1% rule +8.3/10.0
- ARV discount +7.5/15.0
- Schools +2.7/10.0
- Livability +2.7/5.0
- Rent growth +2.5/5.0
- Condition / age +2.5/5.0
- Appreciation +0.0/10.0
$159,900
🖨 Deal sheet (PDF) 📄 Offer letter ✓ Due diligence
Listing remarks
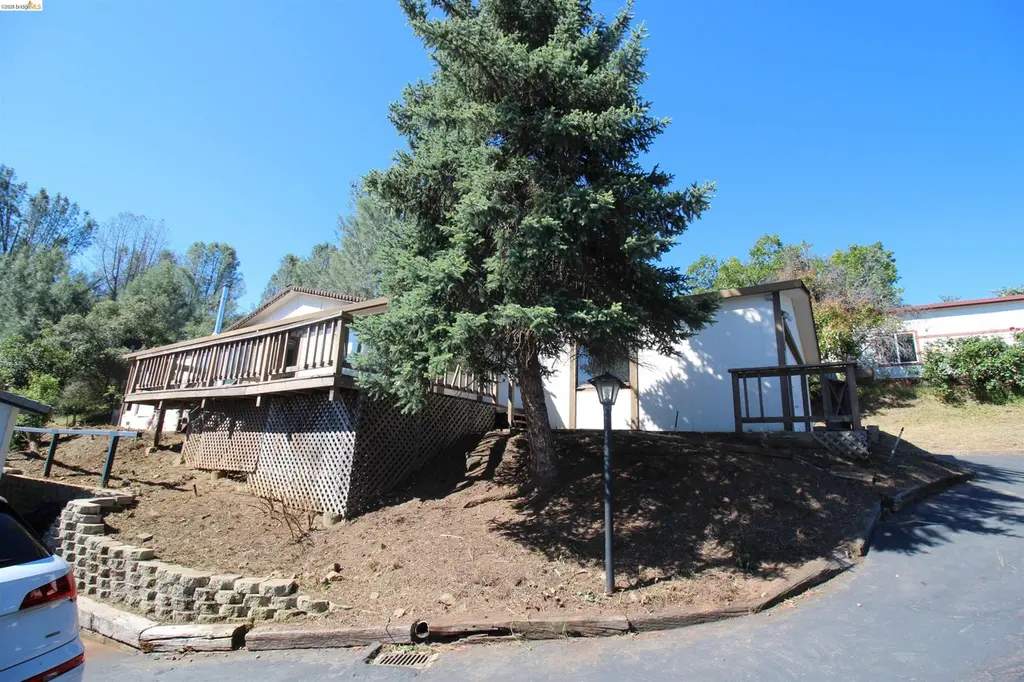
Located in the 55+ community of Yosemite Vista Estates in Groveland, this home offers comfortable living with scenic views and a peaceful foothill setting. Featuring an original interior with great potential to update to your personal style, the home includes a functional floor plan, spacious living area, and abundant natural light. Enjoy relaxing on the deck while taking in the surrounding views and mountain atmosphere. Just a short drive to Yosemite National Park and outdoor recreation.
Key facts
- Spacious living area
- Deck
- Scenic views
Tags
Property features AI
Finance
- HOA & community: Homeowners association with clubhouse and pool; Monthly HOA fee of $142; Senior community
Exterior
- Parking: Attached garage; 2 covered parking spaces; 2 garage spaces
- Utilities: Private water
- Home design: Manufactured home; Single-story (street level listing: 3 bedrooms, 2 baths); Built in 1986
- Construction: Wood siding; Shingle roof
- Exterior features: Deck; Patio; Community pool; Rectangular lot
Interior
- Kitchen: Dishwasher; Gas range; Disposal; Solid surface countertops
- Bedrooms: 3 bedrooms
- Flooring: Vinyl; Carpet
- Bathrooms: 2 full bathrooms
- Heating & cooling: Propane heating; Central air; Ceiling fans
- Interior features: Dining area; Solid surface counters; Free-standing fireplace
- Laundry & utility: Laundry room
Neighborhood map
What this means for you Summary
Snapshot
- This is a 3-bed/2.0-bath single-family listed at $160k.
Deal economics
- At list price, monthly cash flow is $525 ($6k/yr) — positive.
- The deal already cash-flows at list — no discount required.
- Meets the 1% rule at list price ($2k rent vs $160k).
- Recommended offer: $155k (3.0% below list) — sets the bar for market timing.
- Cap rate 10.2% vs local median 3.4% in Pine Mountain Lake — top-decile yield for the area; either an underpriced asset or a hidden risk that comps aren't pricing in. Stress-test before assuming the spread holds.
Location & tenants
- Location reads 54/100 on livability (#896 in CA) — a working-class tenant base; expect higher turnover. Strengths: crime A, housing B; Watch: employment C-, schools D, amenities F.
- Big Oak Flat-Groveland Unified (rural): math 15% / reading 40% proficiency, ranked #1,094 of 1,400 in CA (top 78%) — low school quality limits family demand, transient renter base, plan for 1-2y turnover.
- Market conditions: 236 active listings in the ZIP; 60 units permitted in Tuolumne County in 2024 (0 in 5+ unit buildings).
Forward outlook
- Local home prices are declining (-3.0%/yr); year-one equity from $1k of loan paydown is wiped out by about $5k of value loss. Plan a longer hold.
- Tuolumne County population projected at -15% by 2050 — secular population decline; favor cash flow + early exit over multi-decade hold.
- At projected returns (-3.0% appreciation + 3.0% rent growth), your $45k cash investment doubles in ~9 years — after that, you're playing with house money.
Negotiation context
- It's been on market 32 days — a 3% lower offer ($155k) is reasonable based on typical stale-listing flexibility.
Risks & watch-outs
- Climate carrying-cost: major wildfire risk; extreme-heat days projected 8→20/yr by 2055 (HVAC capex compounding) — expect insurance premiums to compound above CPI over the hold.
Questions for the listing agent
- It's been on market 32 days. Have you received any prior offers? Is the seller open to a 3% concession, seller financing, or rate buy-down credit?
- What does the HOA fee cover, when was the last increase, and are there any pending special assessments or reserve-fund shortfalls?
- Is there a deadline driving the sale (1031 exchange, divorce, estate, relocation)? That informs how much negotiation room exists.
- Schools are D-rated, which usually means shorter tenancies and higher turnover. Who's the typical renter profile here, and what's been the actual vacancy rate?
- What's the average days-on-market for RENTAL listings here right now (not sales)? A rising rental-DOM trend means longer vacancies and softer asking-rent achievability than the comps imply.
- What's the recent tenant-quality profile in this submarket — average credit score on applications, eviction rate, late-payment / NSF rate, and stable-employment percentage? A property-management company in the area should have these aggregated.
- How much new for-sale + rental construction is in the pipeline within 1–3 miles? Heavy new supply typically softens prices + rents 12–24 months out; constrained supply supports both.
Investment metrics
- 1% rule
- 1.33% ✓
- Cap rate
- 10.24%
- Cash-on-cash
- 14.08%
- DSCR
- 1.63
- GRM
- 6.3
CMA / ARV
No comps found within radius.
Projected returns pro-forma
-3.0% appreciation · 3.0% rent growth · sell at horizon
- IRR
- 4.4%
- Equity multiple
- 1.17×
- Total profit
- $7,608
- Equity at exit
- $23,842
- IRR
- 13.9%
- Equity multiple
- 2.12×
- Total profit
- $49,950
- Equity at exit
- $13,825
Cash invested: $44,772 (down + closing). Projections, not guarantees.
Landlord ↔ Tenant lean methodology
- Overall (STATE)
- 18 Strongly Tenant-Friendly
- State California
- 18 Strongly Tenant-Friendly · D+13
- County
- — inherits STATE
- City
- — inherits STATE
ZIP-level market 95321
- Active inventory
- 236
- Price-to-rent
- 6.3×
Monthly cashflow live
- Estimated rent
- $2,120 medium interval (Pro) →
- Mortgage (P&I)
- −$839
- Tax from tax record
- −$102 /mo · $1,230/yr
- Insurance
- −$67
- HOA
- −$142
- Vacancy / Maint / Mgmt
- −$445
- Net cashflow
- $525
Break-even live
Sensitivity live
| Price | -10% $616 | -5% $571 | +0% $525 | +5% $480 | +10% $435 |
|---|---|---|---|---|---|
| Rent | -10% $358 | -5% $442 | +0% $525 | +5% $609 | +10% $693 |
| Rate | -1.0pp $606 | -0.5pp $566 | base $525 | +0.5pp $484 | +1.0pp $442 |
UW: 25.0% down · 7.5% · 30yr · 1.5% tax · 5.0% vac · 8.0% maint · 8.0% mgmt
Financing live
Cash to close
- Down payment
- $39,975
- Closing costs
- $4,797
- Reserves months
- —
- Total cash needed
- —
Loan-product check · same deal, 3 products live
Conventional
25% down · 7.5% · 30yr
- Down + closing
- —
- Monthly P&I
- —
- Monthly cashflow
- —
- DSCR
- —
- Eligible?
- —
Personal DTI + credit; lowest rate.
DSCR
20% down · 8.5% · 30yr
- Down + closing
- —
- Monthly P&I
- —
- Monthly cashflow
- —
- DSCR
- —
- Eligible?
- —
No personal income docs; deal must DSCR.
Hard money
10% down · 12.0% · 12mo
- Down + closing
- —
- Monthly P&I
- —
- Monthly cashflow
- —
- DSCR
- —
- Eligible?
- —
Short-term bridge; refi at stabilization.
HOA detail
- Monthly dues
- $142 · $1,704/yr
Listing history 20 events
-
2026-06-21days on market $159,900 Active 32 DOM
-
2026-06-19days on market $159,900 Active 30 DOM
-
2026-06-18days on market $159,900 Active 29 DOM
-
2026-06-17days on market $159,900 Active 28 DOM
-
2026-06-16days on market $159,900 Active 27 DOM
-
2026-06-15days on market $159,900 Active 26 DOM
-
2026-06-14days on market $159,900 Active 24 DOM
-
2026-06-12days on market $159,900 Active 23 DOM
-
2026-06-09days on market $159,900 Active 20 DOM
-
2026-06-08days on market $159,900 Active 19 DOM
-
2026-06-07days on market $159,900 Active 18 DOM
-
2026-06-07days on market $159,900 Active 17 DOM
-
2026-06-04days on market $159,900 Active 14 DOM
-
2026-06-02days on market $159,900 Active 13 DOM
-
2026-06-01days on market $159,900 Active 12 DOM
-
2026-05-31days on market $159,900 Active 11 DOM
-
2026-05-31days on market $159,900 Active 10 DOM
-
2026-05-20$159,900 Active
-
2000-01-28soldstatus $255,000
-
1999-12-27soldstatus $255,000
ⓘ Source: listings_history table (triggers on properties + properties_extension) + one-shot
backfill from property_details.listing_events for pre-trigger history.
Tax reassessment forecast CA · Resets to sale price
- Current annual tax
- $1,230 · $102/mo
- Projected year-2 tax
- $1,230 · $102/mo
- Expected delta
- $0/yr ($0/mo · 0.0%)
ⓘ Screening estimate from a state-policy table — verify with the county assessor before closing.
Climate risk First Street
- Flood 1/10 Low FEMA zone D · 0% chance over 30 yrs
- Wildfire 7/10 Severe
- Heat 5/10 Major 8 d/yr ≥95°F today · 20 d/yr by 30 yrs out
- Wind 1/10 Low
- Air quality 10/10 Extreme 28 unhealthy d/yr today · 34 by 30 yrs out
Nearby sold comps map
Loading sold comps map…
Walkable amenities ~0.75 mi
Loading nearby amenities…
Taxation est. · year 1
- Rental income
- $25,443
- − Mortgage interest
- −$8,957
- − Property taxes
- −$1,230
- − Insurance
- −$800
- − Repairs & maintenance
- −$2,035
- − Management
- −$2,035
- − HOA
- −$1,704
- − Depreciation
- −$4,652
- Taxable income
- $4,030
- Est. tax owed @ 24.0%
- −$967
- After-tax cash flow
- $5,337/yr
For passive investors: Depreciation is non-cash, so a rental often shows a tax loss while cash-flowing — sheltering income. Rental losses are passive: they offset passive income freely, and up to $25,000/yr can offset ordinary (W-2) income if you actively participate and your MAGI is under $100k (phasing out to $0 by $150k); unused losses carry forward. On sale, claimed depreciation is recaptured at up to 25%, and gains may owe capital-gains tax (a 1031 exchange can defer both). Figures are a year-1 estimate at your 24.0% rate — not tax advice; consult a CPA.
Schools (NCES district)
- District
- Big Oak Flat-Groveland Unified
- NCES district ID
- 0691137
- Math proficiency
- 15% ▬ 0.00%
- Reading proficiency
- 40% ▲ 5.00%
- Median HH income
- $52,027
- Composite
- 27.21/100
- National rank
- #12450
- State rank
- #1094 of 1400 in CA
Livability — Pine Mountain Lake
- Score
- 54/100
- State rank
- #896
- US rank
- #23898
Category grades
Schools grade is shown separately in the Schools card above.
Census & demographics
- Census place
- Pine Mountain Lake, CA
- Population (ZIP)
- 3,870
Population outlook (Tuolumne County) Hauer SSP2
- Today (2025)
- 50,349 people
- By 2030
- 48,708 · -3.3%
- By 2040
- 45,284 · -10.1%
- By 2050
- 42,575 · -15.4%
- By 2075
- 36,827 · -26.9%
- By 2100
- 30,369 · -39.7%
Race, ethnicity, and origin ACS 2023
- Neighborhood character
- Predominantly White (79%)
- Race & ethnicity
- White 79% Hispanic / Latino 11% Two or more races 7% Asian 3%
- Hispanic origin (detail)
- Mexican 8%
- Common ancestry
- Slovak 6% Serbian 4% Scotch-Irish 4%
- Foreign-born
- 11% · Canada, South Korea
- Languages at home
- 86% English-only · Spanish 8% Other Indo-European 3% Korean 1%
Political lean MEDSL · Tuolumne
- 2024 margin
- Strong R (+21.9) · D 37.9% · R 59.7% · Other 2.4%
- 2008→2024 swing
- -9.2pp toward R · 2008: -12.7pp · 2024: -21.9pp
- All cycles
- 2024: R+21.9 2020: R+18.8 2016: R+20.9 2012: R+15.9 2008: R+12.7
Not yet ingested
- Civics
- —
Market trends
- HPI YoY
- ▼ -124.27%
- Current HPI
- 137.7561
- Rent YoY
- —
- Metro
- —
- State GDP YoY
- ▲ 3.21%
- F500 in state
- 116
Industry mix (Fortune 500 HQ in CA)
| Industry | F500 HQs | Revenue |
|---|---|---|
| Technology | 27 | $1,492B |
|
||
| Financial Services | 3 | $174B |
|
||
| Retail | 3 | $44B |
|
||
| Insurance | 3 | $26B |
|
||
| Media / Entertainment | 2 | $115B |
|
||
| Pharmaceuticals / Biotech | 2 | $62B |
|
||
Price history
-37.3% since first listed3 events — show timeline
- 2026-05-20 Listed $159,900 bridgeMLS, Bay East AOR, or Contra Costa AOR
- 2000-01-28 Sold (Public Records) $255,000 Public Records
- 1999-12-27 Sold (Public Records) $255,000 Public Records
Property tax history
+4.9%/yrLatest (2025): $1,230 · -0.6% YoY. Source: county tax records.
Cash-flow waterfall
monthlySold comps — $/sqft
last 12 mo · ≤1 miLoading sold comps…