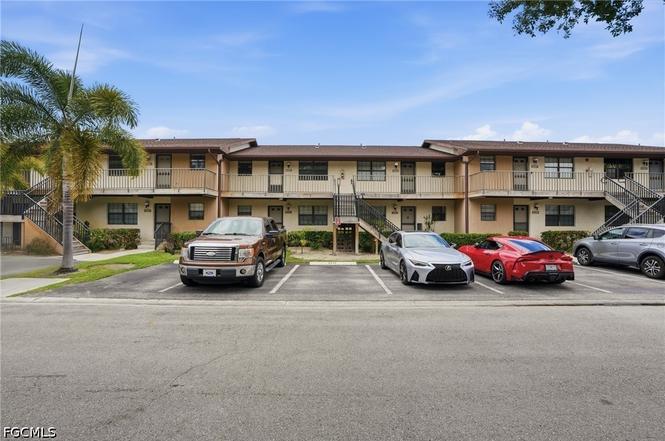
5323 Treetops Dr Unit T203 · Naples Manor, FL
Flood risk 9/10 · Severe
- FEMA flood zone
- AE
- Chance of flooding over 30 yrs
- 0.99%
- Est. flood insurance / yr
- $1,737 – $8,500
Fire risk 3/10 · Minor
- Est. fire insurance / yr
- $947 – $1,759
Heat risk 10/10 · Severe
- Hot days now (above 107°F)
- 8 days/yr
- Hot days in 30 yrs
- 31 days/yr
Wind risk 10/10 · Severe
- Chance of severe wind over 30 yrs
- 99.0%
Air-quality risk 2/10 · Minimal
- Unhealthy air days now
- 2 days/yr
- Unhealthy air days in 30 yrs
- 2 days/yr
Risk factors via First Street. Map © Google.
Why this score? — see what drove the C grade
The composite is a weighted blend of 9 inputs, each scored 0–100. Each bar is that input's sub-score; the figure is the points it added to the 100-point composite (weight × sub-score).
- Cash flow +20.8/30.0
- 1% rule +8.3/10.0
- ARV discount +7.5/15.0
- DSCR +6.6/10.0
- Schools +5.0/10.0
- Rent growth +3.9/5.0
- Livability +3.3/5.0
- Condition / age +2.5/5.0
- Appreciation +0.0/10.0
$174,999
🖨 Deal sheet 📄 Offer letter ✓ Due diligence
Listing remarks
INVESTOR'S OPPORTUNITY!!!! Welcome to this beautifully updated 2-bedroom, 2-bath condo located in the desirable Woodgate at Naples community. This second-floor unit offers peaceful lake views from the screened lanai, making it the perfect spot to relax and enjoy the Florida lifestyle. Inside, you’ll find updated flooring throughout, fresh paint, and a remodeled kitchen featuring quartz countertops, modern cabinetry, a tiled backsplash, and newer appliances. The spacious primary bedroom includes a walk-in closet, while the second bedroom provides plenty of space for guests, family, or a home office. Additional updates include a newer A/C (2020) and water heater (2024), giving buyers ad
Key facts
- Quartz countertops
- Lake views
- Modern cabinetry
Tags
Property features AI
Finance
- Financial info: Pet policy: conditional; call for details; Maximum of 1 pet with maximum weight 20 lbs
- HOA & community: Quarterly association fee; Association fee covers grounds maintenance; Community amenities: clubhouse, pool, vehicle wash area, management; 96 units in the community; Condo hotel community near hotel/motel
Exterior
- Parking: Vehicle wash area (community)
- Utilities: Public water; Public sewer; Cable available
- Home design: Condo unit; 2 stories (building); Entry level: 2; Faces north; South exposure
- Construction: Block, concrete and vinyl siding construction; Shingle roof; Resale property
- Exterior features: Patio; Open porch; Sprinkler/irrigation; Community pool; Lakefront
Interior
- Kitchen: Cooktop; Range; Microwave; Dishwasher; Refrigerator; Freezer
- Bedrooms: Entry level: 2
- Flooring: Tile
- Bathrooms: 2 full bathrooms
- Heating & cooling: Central heating (electric); Central air; Ceiling fan(s); Electric cooling
- Interior features: Pantry; Walk-in closet(s); Split bedrooms; Single hung windows; Unfurnished
- Laundry & utility: Dryer
Neighborhood map
What this means for you Summary
Snapshot
- This is a 2-bed/2.0-bath condo listed at $175k.
Deal economics
- At list price, monthly cash flow is $-186 ($-2k/yr) — negative.
- To cash-flow at today's rent, offer at most $142k (18.8% below list).
- Meets the 1% rule at list price ($2k rent vs $175k).
- Recommended offer: $142k (18.8% below list) — sets the bar for cash-flow.
Location & tenants
- Location reads 66/100 on livability (#615 in FL) — a middle-class / working-renter tenant base. Strengths: housing A+, health & safety A+, cost of living B+; Watch: schools F, amenities F, commute F.
- Collier (suburban): math 60% / reading 56% proficiency, ranked #16 of 73 in FL (top 22%) — acceptable for families but not a draw, mixed tenant base, ~2y average lease.
- Market conditions: Rents rising fast (+5.6%/yr); 597 active listings in the ZIP; 20 comparable units currently listed for rent nearby; rentals at typical pace (median 23d on market — plan ~3-4 weeks tenant-placement turnaround); solid renter incomes; 3,520 units permitted in Collier County in 2024 (959 in 5+ unit buildings).
- This rent runs 34% of the median local income ($82k/yr) — at the standard rent-burdened threshold; future hikes will face affordability resistance.
Forward outlook
- Local home prices are declining (-3.0%/yr); year-one equity from $1k of loan paydown is wiped out by about $5k of value loss. Plan a longer hold.
- Collier County population projected at +30% by 2050 — long-run rental-demand tailwind backs the buy-and-hold thesis.
Negotiation context
- Only 7 days on market — expect competitive offers; lowballing is unlikely to land.
- 4 sale attempts since 3y ago with the ask held roughly flat each time — persistent listings suggest the price (not the market) is what's stuck; bring a comps-based counter.
- Current owner paid $78k; list at $175k implies a 126% gain — meaningful room to come down on a strong offer.
Risks & watch-outs
- Watch-outs: flood insurance adds $427/mo; HOA is 21% of rent.
- Climate carrying-cost: in FEMA flood zone AE (mandatory federal flood insurance); severe wind risk, 99% chance of damaging wind over 30y; extreme-heat days projected 8→31/yr by 2055 (HVAC capex compounding) — expect insurance premiums to compound above CPI over the hold.
Questions for the listing agent
- What do current leases actually rent for vs. the listed asking? Can we see a recent rent roll and the last 12 months of T-12 income?
- What's the actual annual flood-insurance premium (NFIP or private), and is the property in a SFHA with mandatory coverage?
- What does the HOA fee cover, when was the last increase, and are there any pending special assessments or reserve-fund shortfalls?
- Any open or pending special assessments — roof, HVAC, plumbing, elevator, façade? What's the per-unit balance and payoff schedule, and is the seller paying it off at close or rolling it to the buyer?
- Is there a deadline driving the sale (1031 exchange, divorce, estate, relocation)? That informs how much negotiation room exists.
- Schools are F-rated, which usually means shorter tenancies and higher turnover. Who's the typical renter profile here, and what's been the actual vacancy rate?
- What's the average days-on-market for RENTAL listings here right now (not sales)? A rising rental-DOM trend means longer vacancies and softer asking-rent achievability than the comps imply.
- What's the recent tenant-quality profile in this submarket — average credit score on applications, eviction rate, late-payment / NSF rate, and stable-employment percentage? A property-management company in the area should have these aggregated.
- How much new apartment / multifamily construction is in the pipeline within 1–3 miles? Heavy new supply (>2% of stock underway) typically softens rents 12–24 months out; light construction supports rent growth.
Investment metrics
- 1% rule
- 1.33% ✓
- Cap rate
- 7.94%
- Cash-on-cash
- 5.88%
- DSCR
- 1.26
- GRM
- 6.3
CMA / ARV
No comps found within radius.
Projected returns pro-forma
-3.0% appreciation · 5.59% rent growth · sell at horizon
- IRR
- -18.7%
- Equity multiple
- 0.32×
- Total profit
- $-33,465
- Equity at exit
- $26,093
- IRR
- -3.9%
- Equity multiple
- 0.69×
- Total profit
- $-15,290
- Equity at exit
- $15,131
Cash invested: $49,000 (down + closing). Projections, not guarantees.
Landlord ↔ Tenant lean methodology
- Overall (STATE)
- 87 Strongly Landlord-Friendly
- State Florida
- 87 Strongly Landlord-Friendly · R+3
- County
- — inherits STATE
- City
- — inherits STATE
ZIP-level market 34113
- Rents YoY
- 5.6%
- Active inventory
- 597
- Price-to-rent
- 6.3×
Monthly cashflow live
- Estimated rent
- $2,330 high interval (Pro) →
- Mortgage (P&I)
- −$918
- Tax from tax record
- −$127 /mo · $1,526/yr
- Insurance
- −$73
- Flood insurance flood zone
- −$427 /mo · $5,118/yr
- HOA
- −$483
- Vacancy / Maint / Mgmt
- −$489
- Net cashflow
- $-186
Break-even live
UW: 25.0% down · 7.5% · 30yr · 1.5% tax · 5.0% vac · 8.0% maint · 8.0% mgmt
Financing live
Cash to close
- Down payment
- $43,750
- Closing costs
- $5,250
- Reserves months
- —
- Total cash needed
- —
Loan-product check · same deal, 3 products live
Conventional
25% down · 7.5% · 30yr
- Down + closing
- —
- Monthly P&I
- —
- Monthly cashflow
- —
- DSCR
- —
- Eligible?
- —
Personal DTI + credit; lowest rate.
DSCR
20% down · 8.5% · 30yr
- Down + closing
- —
- Monthly P&I
- —
- Monthly cashflow
- —
- DSCR
- —
- Eligible?
- —
No personal income docs; deal must DSCR.
Hard money
10% down · 12.0% · 12mo
- Down + closing
- —
- Monthly P&I
- —
- Monthly cashflow
- —
- DSCR
- —
- Eligible?
- —
Short-term bridge; refi at stabilization.
Rent comps 20 comps
| Address | Beds | Baths | Sqft | Rent | $/sqft | DOM | Units | Dist |
|---|---|---|---|---|---|---|---|---|
| 5339 Treetops Dr Unit 5339 Naples, FL | 2.0 | 2.0 | 806 | $2,250 | $2.79 | 23d | 1 | 0.03mi |
| 5296 Treetops Dr Unit 5296 Naples, FL | 2.0 | 2.0 | 866 | $1,495 | $1.73 | 23d | 1 | 0.05mi |
| 5254 Treetops Dr Naples, FL | 2.0 | 2.0 | 878 | $1,700 | $1.94 | 23d | 1 | 0.06mi |
| 5294 Treetops Dr Unit I203 Naples, FL | 2.0 | 2.0 | 866 | $1,600 | $1.85 | 13d | 1 | 0.06mi |
| 5361 Treetops Dr Naples, FL | 2.0 | 2.0 | 806 | $1,600 | $1.99 | 21d | 1 | 0.06mi |
| 5300 Treetops Dr Unit I206 Naples, FL | 2.0 | 2.0 | 878 | $1,850 | $2.11 | 23d | 1 | 0.06mi |
| 5300 Treetops Dr Unit 206 Naples, FL | 2.0 | 2.0 | 866 | $1,750 | $2.02 | 23d | 1 | 0.06mi |
| 5379 Treetops Dr Unit M203 Naples, FL | 2.0 | 2.0 | 950 | $1,700 | $1.79 | 23d | 1 | 0.09mi |
| 5395 Treetops Dr Unit I Naples, FL | 2.0 | 2.0 | 865 | $1,800 | $2.08 | 23d | 1 | 0.11mi |
| 5222 Treetops Dr Naples, FL | 1.0 | 1.0 | 600 | $1,800 | $3.00 | 23d | 1 | 0.13mi |
| 5324 Treetops Dr Unit G-2 Naples, FL | 2.0 | 2.0 | 878 | $1,800 | $2.05 | 13d | 1 | 0.13mi |
| 5385 Treetops Dr Unit I Naples, FL | 2.0 | 2.0 | 865 | $1,800 | $2.08 | 23d | 1 | 0.14mi |
| 11496 Sumter Grove Cir Naples, FL | 1.0–2.0 | 1.0–2.0 | 1067 | $2,134 | $2.00 | 13d | 14 | 0.39mi |
| 5314 Gilchrist St Naples, FL | 2.0 | 1.0 | 636 | $2,000 | $3.14 | 13d | 1 | 0.56mi |
| 24 Cheyenne Trl Naples, FL | 2.0 | 2.0 | 888 | $3,500 | $3.94 | 13d | 1 | 0.66mi |
| 9815 Giaveno Ct #1234 Naples, FL | 2.0 | 2.0 | 1107 | $2,000 | $1.81 | 23d | 1 | 0.81mi |
| 9723 Acqua Ct #332 Naples, FL | 2.0 | 2.0 | 1100 | $6,000 | $5.45 | 23d | 1 | 1.08mi |
| 326 Bradstrom Cir Unit 103F Naples, FL | 2.0 | 2.0 | 1113 | $1,800 | $1.62 | 23d | 1 | 1.28mi |
| 8161 Twelve Oaks Cir #512 Naples, FL | 2.0 | 2.0 | 1066 | $5,000 | $4.69 | 23d | 1 | 1.38mi |
| 9596 Trevi Ct Naples, FL | 2.0–3.0 | 2.0 | 1257 | $4,000 | $3.18 | 23d | 6 | 1.44mi |
HOA detail condo
- Monthly dues
- $483 · $5,796/yr
- Likely covers
- water
- Assessments
- None detected in remarks — confirm with the listing agent.
Listing history 6 events
-
2026-06-18days on market $174,999 Active 7 DOM
-
2026-06-17days on market $174,999 Active 6 DOM
-
2026-06-16days on market $174,999 Active 5 DOM
-
2026-06-15days on market $174,999 Active 4 DOM
-
2026-06-14remarks 693-char remark
-
2026-06-14$174,999 Active 2 DOM
ⓘ Source: listings_history table (triggers on properties + properties_extension) + one-shot
backfill from property_details.listing_events for pre-trigger history.
Tax reassessment forecast FL · Resets to sale price
- Current annual tax
- $1,526 · $127/mo
- Projected year-2 tax
- $1,526 · $127/mo
- Expected delta
- $0/yr ($0/mo · -0.0%)
ⓘ Screening estimate from a state-policy table — verify with the county assessor before closing.
Climate risk First Street
- Flood 9/10 Extreme FEMA zone AE · 99% chance over 30 yrs
- Wildfire 3/10 Moderate
- Heat 10/10 Extreme 8 d/yr ≥107°F today · 31 d/yr by 30 yrs out
- Wind 10/10 Extreme 99% chance of damaging wind over 30 yrs
- Air quality 2/10 Low 2 unhealthy d/yr today · 2 by 30 yrs out
Nearby sold comps map
Loading sold comps map…
Walkable amenities ~0.75 mi
Loading nearby amenities…
Taxation est. · year 1
- Rental income
- $27,962
- − Mortgage interest
- −$9,803
- − Property taxes
- −$1,526
- − Insurance
- −$5,993
- − Repairs & maintenance
- −$2,237
- − Management
- −$2,237
- − HOA
- −$5,796
- − Depreciation
- −$5,091
- Taxable loss
- −$4,720
- Est. tax savings @ 24.0%
- +$1,133
- After-tax cash flow
- $-1,105/yr
For passive investors: Depreciation is non-cash, so a rental often shows a tax loss while cash-flowing — sheltering income. Rental losses are passive: they offset passive income freely, and up to $25,000/yr can offset ordinary (W-2) income if you actively participate and your MAGI is under $100k (phasing out to $0 by $150k); unused losses carry forward. On sale, claimed depreciation is recaptured at up to 25%, and gains may owe capital-gains tax (a 1031 exchange can defer both). Figures are a year-1 estimate at your 24.0% rate — not tax advice; consult a CPA.
Schools (NCES district)
- District
- Collier
- NCES district ID
- 1200330
- Math proficiency
- 60% ▼ -4.00%
- Reading proficiency
- 56% ▼ -2.00%
- Median HH income
- $58,275
- Composite
- 50.23/100
- National rank
- #1892
- State rank
- #16 of 73 in FL
Livability — Naples Manor
- Score
- 66/100
- State rank
- #615
- US rank
- #11875
Category grades
Schools grade is shown separately in the Schools card above.
Census & demographics
- County
- Collier County · 396,295 people
- Metro
- Naples-Marco Island, FL
- Population (ZIP)
- 26,056
- Household income
- $81,674
- Rent vs Own
- Severe rent burden
- 954.0
Population outlook (Collier County) Hauer SSP2
- Today (2025)
- 420,858 people
- By 2030
- 450,054 · +6.9%
- By 2040
- 502,232 · +19.3%
- By 2050
- 544,932 · +29.5%
- By 2075
- 627,203 · +49.0%
- By 2100
- 659,015 · +56.6%
Race, ethnicity, and origin ACS 2023
- Neighborhood character
- Diverse neighborhood (Simpson 0.59)
- Race & ethnicity
- White 56% Hispanic / Latino 28% Black 12% Two or more races 11% Asian 2%
- Hispanic origin (detail)
- Mexican 17% Puerto Rican 3% Cuban 2%
- Common ancestry
- Hispanic 10% Romanian 3% Lithuanian 2%
- Foreign-born
- 26% · Canada, Jamaica, Vietnam
- Languages at home
- 63% English-only · Spanish 24% French/Haitian/Cajun 9% Other Indo-European 2%
Political lean MEDSL · Collier
- 2024 margin
- Solid R (+33.1) · D 33.1% · R 66.2%
- 2008→2024 swing
- -10.6pp toward R · 2008: -22.5pp · 2024: -33.1pp
- All cycles
- 2024: R+33.1 2020: R+24.7 2016: R+26.0 2012: R+30.1 2008: R+22.5
Not yet ingested
- Civics
- —
Market trends
- HPI YoY
- ▼ -194.86%
- Current HPI
- 279.4232
- Rent YoY
- ▲ 5.59%
- Metro
- Naples-Marco Island, FL
- State GDP YoY
- ▲ 3.28%
- F500 in state
- 36
Industry mix (Fortune 500 HQ in FL)
| Industry | F500 HQs | Revenue |
|---|---|---|
| Industrial Technology | 2 | $29B |
|
||
| Insurance | 2 | $17B |
|
||
| Retail | 1 | $60B |
|
||
| Technology Distribution | 1 | $58B |
|
||
| Homebuilding | 1 | $35B |
|
||
| Technology Manufacturing | 1 | $35B |
|
||
Price history
+133.6% since first listed12 events — show timeline
- 2026-06-10 Listed $174,999 FORTMLS
- 2026-05-07 Listing Removed — FORTMLS
- 2026-02-20 Price Changed $175,000 FORTMLS
- 2025-05-21 Price Changed $199,000 NAPLESMLS
- 2025-04-15 Listed $199,000 FORTMLS
- 2024-02-21 Listing Removed — NAPLESMLS
- 2024-02-20 Listed $225,000 NAPLESMLS
- 2023-10-26 Rental Removed $2,100 LISTANZA
- 2023-10-22 Listed for Rent $2,100 LISTANZA
- 2020-07-01 Sold (Public Records) $77,589 Public Records
- 2005-04-06 Sold (Public Records) $108,000 Public Records
- 2001-08-22 Sold (Public Records) $74,900 Public Records
Property tax history
+10.7%/yrLatest (2025): $1,526 · -4.7% YoY. Source: county tax records.
Cash-flow waterfall
monthlySold comps — $/sqft
last 12 mo · ≤1 miLoading sold comps…