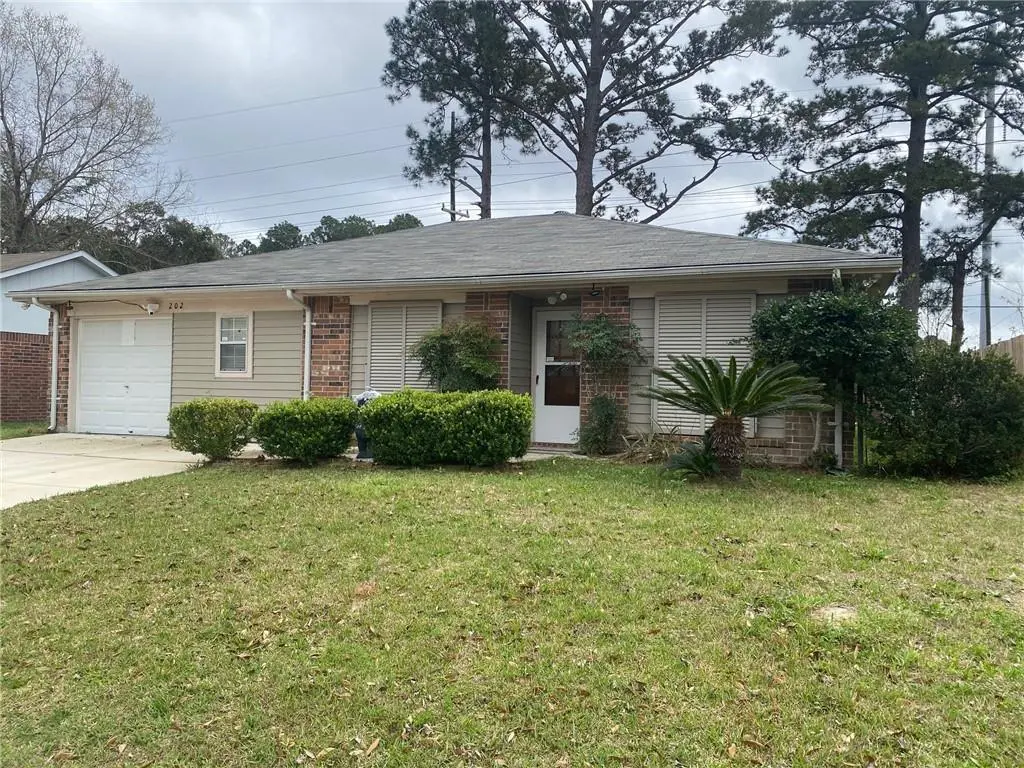
202 Almond Creek Rd · Slidell, LA
Flood risk 7/10 · Major
- FEMA flood zone
- X
- Chance of flooding over 30 yrs
- 0.85%
- Est. flood insurance / yr
- $507 – $1,088
Fire risk 5/10 · Moderate
- Est. fire insurance / yr
- $1,269 – $2,357
Heat risk 10/10 · Severe
- Hot days now (above 108°F)
- 7 days/yr
- Hot days in 30 yrs
- 21 days/yr
Wind risk 10/10 · Severe
- Chance of severe wind over 30 yrs
- 99.0%
Air-quality risk 2/10 · Minimal
- Unhealthy air days now
- 1 days/yr
- Unhealthy air days in 30 yrs
- 2 days/yr
Risk factors via First Street. Map © Google.
Why this score? — see what drove the C- grade
The composite is a weighted blend of 9 inputs, each scored 0–100. Each bar is that input's sub-score; the figure is the points it added to the 100-point composite (weight × sub-score).
- Cash flow +19.5/30.0
- ARV discount +11.7/15.0
- DSCR +6.2/10.0
- Schools +4.3/10.0
- 1% rule +4.0/10.0
- Livability +3.5/5.0
- Rent growth +2.9/5.0
- Condition / age +2.5/5.0
- Appreciation +0.0/10.0
$187,000
🖨 Deal sheet 📄 Offer letter ✓ Due diligence
Listing remarks MLS
Don't pass up this Treasure of a Home that has been totally Painted on the interior. Spacious Kitchen with Wood Cabinets, New Dishwasher, New Range Oven, and New Sink. The Living Room has Cathedral Ceilings, Tile Floors, Ceiling Fan and has lots of light coming in. Oversized Dining Area. The Primary Bedroom has Private bath and Walk in closet. The guest bedrooms are Split on the other side of Living area. Attached Garage. Covered Patio, Large Fenced Yard. Easy Access to I10 into Mississippi or New Orleans. This home DID NOT FLOOD in Katrina. New Roof after Ida. Close to the Lake for Water Sports, Great Shopping nearby and Plenty of Restaurants.
Key facts
- Tile floors
- Spacious kitchen
- New range oven
Tags
Neighborhood map
What this means for you Summary
Snapshot
- This is a 3-bed/2.0-bath single-family listed at $187k.
Deal economics
- At list price, monthly cash flow is $146 ($2k/yr) — positive.
- The deal already cash-flows at list — no discount required.
- To meet the 1% rule (rent ≥ 1% of price), the offer needs to be $169k (9.7% below list).
- Recommended offer: $169k (9.7% below list) — sets the bar for 1% rule.
- Cap rate 7.7% vs local median 5.9% in Slidell — meaningfully above typical; check what's discounted (condition, days-on-market, listing class) to confirm the premium yield is real.
Location & tenants
- Location reads 70/100 on livability (#57 in LA) — a middle-class / working-renter tenant base. Strengths: cost of living A+, housing A+, health & safety A+; Watch: amenities F, commute F.
- St. Tammany Parish (suburban): math 43% / reading 55% proficiency, ranked #11 of 98 in LA (top 11%) — families likely to look elsewhere, expect single-tenant / working-renter base with shorter leases.
- Market conditions: Rents rising (+1.7%/yr); 589 active listings in the ZIP; 18 comparable units currently listed for rent nearby; rentals at typical pace (median 17d on market — plan ~3-4 weeks tenant-placement turnaround); solid renter incomes; 1,064 units permitted in St. Tammany Parish in 2024 (0 in 5+ unit buildings).
Forward outlook
- Local home prices are declining (-3.0%/yr); year-one equity from $1k of loan paydown is wiped out by about $6k of value loss. Plan a longer hold.
- St. Tammany County population projected at +27% by 2050 — long-run rental-demand tailwind backs the buy-and-hold thesis.
Negotiation context
- It's been on market 78 days — a 6% lower offer ($176k) is reasonable based on typical stale-listing flexibility.
- 8 sale attempts since 23y ago; this cycle's ask is 17377% above the opening price — seller raised mid-cycle; expect resistance to lowballs.
- Current owner paid $99k; list at $187k implies a 89% gain — meaningful room to come down on a strong offer.
Risks & watch-outs
- Watch-outs: flood insurance adds $66/mo.
- Climate carrying-cost: major flood risk; severe wind risk, 99% chance of damaging wind over 30y; moderate wildfire risk; extreme-heat days projected 7→21/yr by 2055 (HVAC capex compounding) — expect insurance premiums to compound above CPI over the hold.
Questions for the listing agent
- It's been on market 78 days. Have you received any prior offers? Is the seller open to a 10% concession, seller financing, or rate buy-down credit?
- What's the actual annual flood-insurance premium (NFIP or private), and is the property in a SFHA with mandatory coverage?
- Why hasn't it sold? Are there any deal-killer items the seller is aware of (foundation, flood, title, zoning, code violations)?
- Is there a deadline driving the sale (1031 exchange, divorce, estate, relocation)? That informs how much negotiation room exists.
- Schools are B-rated — typically a magnet for longer-tenancy family renters. What's the average tenant stay here, and is there a school-zone premium baked into asking?
- What's the average days-on-market for RENTAL listings here right now (not sales)? A rising rental-DOM trend means longer vacancies and softer asking-rent achievability than the comps imply.
- What's the recent tenant-quality profile in this submarket — average credit score on applications, eviction rate, late-payment / NSF rate, and stable-employment percentage? A property-management company in the area should have these aggregated.
- How much new for-sale + rental construction is in the pipeline within 1–3 miles? Heavy new supply typically softens prices + rents 12–24 months out; constrained supply supports both.
Investment metrics
- 1% rule
- 0.90% ✗
- Cap rate
- 7.65%
- Cash-on-cash
- 4.86%
- DSCR
- 1.22
- GRM
- 9.2
CMA / ARV
- ARV (median comp)
- $206,397
- List price
- $187,000
- Delta
- -9.40%
- Verdict
- FAIR
- Comps
- 20 within 1.0 mi
Show comp detail 12 sales within ~0.75 mi
| Address | Dist | Beds/Ba | Sqft | Sold | Price | $/sf | Match |
|---|---|---|---|---|---|---|---|
| 304 Almond Creek Rd | 0.09mi | 3/2.0 | 1,194 (-1%) | 10mo | $115,500 | $97 | 86 |
| 130 Trafalgar Sq | 0.21mi | 3/2.0 | 1,136 (-6%) | 1mo | $166,000 | $146 | 79 |
| 323 Almond Creek Rd | 0.19mi | 3/2.0 | 1,326 (+10%) | 4mo | $89,980 | $68 | 72 |
| 57360 Cedar Ave | 0.59mi | 3/2.0 | 1,231 (+2%) | 1mo | $185,900 | $151 | 68 |
| 2029 Wellington Ln | 0.37mi | 3/2.0 | 1,350 (+12%) | 1mo | $155,000 | $115 | 62 |
| 57368 Oak Ave | 0.51mi | 3/2.0 | 1,150 (-5%) | 9mo | $195,000 | $170 | 60 |
| 57343 Brookter Rd | 0.47mi | 3/2.0 | 1,306 (+8%) | 6mo | $118,000 | $90 | 60 |
| 57274 Cedar Ave | 0.48mi | 3/2.0 | 1,328 (+10%) | 6mo | $179,900 | $135 | 56 |
| 134 Foxbriar Ct | 0.36mi | 4/2.0 (+1) | 1,335 (+10%) | 7mo | $188,500 | $141 | 55 |
| 57288 Beech Ave | 0.54mi | 3/2.0 | 1,302 (+8%) | 11mo | $124,500 | $96 | 53 |
| 57343 Lillian Dr | 0.73mi | 3/2.0 | 1,318 (+9%) | 1mo | $190,000 | $144 | 50 |
| 57453 Cedar Ave | 0.75mi | 3/2.0 | 1,371 (+14%) | 3mo | $232,500 | $170 | 40 |
Match score weights: distance 35% · size 25% · config 20% · recency 20%. Top-matched comps best support the ARV.
Projected returns pro-forma
-3.0% appreciation · 1.72% rent growth · sell at horizon
- IRR
- -12.4%
- Equity multiple
- 0.56×
- Total profit
- $-23,207
- Equity at exit
- $27,882
- IRR
- -5.3%
- Equity multiple
- 0.68×
- Total profit
- $-17,001
- Equity at exit
- $16,168
Cash invested: $52,360 (down + closing). Projections, not guarantees.
Landlord ↔ Tenant lean methodology
- Overall (STATE)
- 90 Strongly Landlord-Friendly
- State Louisiana
- 90 Strongly Landlord-Friendly · R+12
- County
- — inherits STATE
- City
- — inherits STATE
ZIP-level market 70461
- Home prices YoY
- -33.0%
- Rents YoY
- 1.7%
- Active inventory
- 589
- Price-to-rent
- 9.2×
Monthly cashflow live
- Estimated rent
- $1,688 high interval (Pro) →
- Mortgage (P&I)
- −$981
- Tax from tax record
- −$63 /mo · $753/yr
- Insurance
- −$78
- Flood insurance flood zone
- −$66 /mo · $798/yr
- HOA
- −$0
- Vacancy / Maint / Mgmt
- −$354
- Net cashflow
- $146
Break-even live
UW: 25.0% down · 7.5% · 30yr · 1.5% tax · 5.0% vac · 8.0% maint · 8.0% mgmt
Financing live
Cash to close
- Down payment
- $46,750
- Closing costs
- $5,610
- Reserves months
- —
- Total cash needed
- —
Loan-product check · same deal, 3 products live
Conventional
25% down · 7.5% · 30yr
- Down + closing
- —
- Monthly P&I
- —
- Monthly cashflow
- —
- DSCR
- —
- Eligible?
- —
Personal DTI + credit; lowest rate.
DSCR
20% down · 8.5% · 30yr
- Down + closing
- —
- Monthly P&I
- —
- Monthly cashflow
- —
- DSCR
- —
- Eligible?
- —
No personal income docs; deal must DSCR.
Hard money
10% down · 12.0% · 12mo
- Down + closing
- —
- Monthly P&I
- —
- Monthly cashflow
- —
- DSCR
- —
- Eligible?
- —
Short-term bridge; refi at stabilization.
Rent comps 18 comps
| Address | Beds | Baths | Sqft | Rent | $/sqft | DOM | Units | Dist |
|---|---|---|---|---|---|---|---|---|
| 1805 Brookter St Slidell, LA | 3.0 | 2.0 | 1027 | $1,650 | $1.61 | 3d | 1 | 0.36mi |
| 128 Foxbriar Ct Slidell, LA | 3.0 | 2.0 | 1395 | $1,650 | $1.18 | 44d | 1 | 0.38mi |
| 1402 Shakespeare Ct Slidell, LA | 4.0 | 2.0 | 1347 | $1,725 | $1.28 | 44d | 1 | 0.48mi |
| 57389 Brookter Rd Slidell, LA | 2.0 | 1.0 | 971 | $1,200 | $1.24 | 20d | 1 | 0.55mi |
| 1000 Clairise Ct Slidell, LA | 3.0 | 2.0 | 1319 | $1,900 | $1.44 | 44d | 1 | 0.61mi |
| 221 Bella Sera Ln Slidell, LA | 3.0 | 2.0 | 1028 | $1,525 | $1.48 | 12d | 1 | 0.64mi |
| 57376 Beech Ave Slidell, LA | 2.0 | 1.5 | 1000 | $1,350 | $1.35 | 17d | 1 | 0.64mi |
| 57376 Beech Ave Slidell, LA | 2.0 | 1.5 | 1004 | $1,350 | $1.34 | 14d | 1 | 0.64mi |
| 577 Panther Dr Slidell, LA | 3.0 | 2.0 | 1483 | $1,850 | $1.25 | 3d | 1 | 0.79mi |
| 1640 Town Center Pkwy Slidell, LA | 3.0 | 1.0–2.0 | 959 | $1,895 | $1.98 | 2d | 46 | 0.90mi |
| 141 Hoover Dr Unit 224 Slidell, LA | 2.0 | 1.0 | 775 | $1,299 | $1.68 | 3d | 1 | 0.94mi |
| 141 Hoover Dr Unit 105 Slidell, LA | 2.0 | 1.0 | 775 | $1,375 | $1.77 | 44d | 1 | 0.95mi |
| 141 Hoover Dr Unit 222 Slidell, LA | 2.0 | 1.0 | 775 | $1,299 | $1.68 | 44d | 1 | 0.95mi |
| 141 Hoover Dr Apt 111 Slidell, LA | 2.0 | 1.0 | 775 | $1,325 | $1.71 | 44d | 1 | 0.95mi |
| 1303 Town Center Pkwy Slidell, LA | 3.0 | 1.0–2.0 | 990 | $1,825 | $1.84 | 2d | 31 | 1.05mi |
| 2009 Beth Dr Slidell, LA | 3.0 | 2.0 | 1500 | $1,750 | $1.17 | 3d | 1 | 1.26mi |
| 1733 Mary Dr Slidell, LA | 3.0 | 2.0 | 1349 | $1,650 | $1.22 | 44d | 1 | 1.42mi |
| 1731 Mary Dr Slidell, LA | 3.0 | 2.0 | 1200 | $1,650 | $1.38 | 3d | 1 | 1.43mi |
Listing history 13 events
-
2026-04-15historical $1,070
-
2026-04-11$1,070
-
2026-03-07$187,000 Active 652-char remark
Show marketing remark (653 chars)
Don't pass up this Treasure of a Home that has been totally Painted on the interior. Spacious Kitchen with Wood Cabinets, New Dishwasher, New Range Oven, and New Sink. The Living Room has Cathedral Ceilings, Tile Floors, Ceiling Fan and has lots of light coming in. Oversized Dining Area. The Primary Bedroom has Private bath and Walk in closet. The guest bedrooms are Split on the other side of Living area. Attached Garage. Covered Patio, Large Fenced Yard. Easy Access to I10 into Mississippi or New Orleans. This home DID NOT FLOOD in Katrina. New Roof after Ida. Close to the Lake for Water Sports, Great Shopping nearby and Plenty of Restaurants.
-
2026-03-07$187,000 Active 653-char remark
Show marketing remark (653 chars)
Don't pass up this Treasure of a Home that has been totally Painted on the interior. Spacious Kitchen with Wood Cabinets, New Dishwasher, New Range Oven, and New Sink. The Living Room has Cathedral Ceilings, Tile Floors, Ceiling Fan and has lots of light coming in. Oversized Dining Area. The Primary Bedroom has Private bath and Walk in closet. The guest bedrooms are Split on the other side of Living area. Attached Garage. Covered Patio, Large Fenced Yard. Easy Access to I10 into Mississippi or New Orleans. This home DID NOT FLOOD in Katrina. New Roof after Ida. Close to the Lake for Water Sports, Great Shopping nearby and Plenty of Restaurants.
-
2025-07-27$193,000 Active
-
2005-05-13soldstatus $99,000
-
2005-05-11soldstatus $99,000
-
2005-02-10$103,900
-
2005-02-10$103,900
-
2003-06-03soldstatus $93,300
-
2003-05-22soldstatus $93,300
-
2003-03-13$89,900
-
2003-03-13$89,900
ⓘ Source: listings_history table (triggers on properties + properties_extension) + one-shot
backfill from property_details.listing_events for pre-trigger history.
Tax reassessment forecast LA · Resets to sale price
- Current annual tax
- $753 · $63/mo
- Projected year-2 tax
- $1,028 · $86/mo
- Expected delta
- +$276/yr (+$23/mo · 36.6%)
ⓘ Screening estimate from a state-policy table — verify with the county assessor before closing.
Climate risk First Street
- Flood 7/10 Severe FEMA zone X · 85% chance over 30 yrs
- Wildfire 5/10 Major
- Heat 10/10 Extreme 7 d/yr ≥108°F today · 21 d/yr by 30 yrs out
- Wind 10/10 Extreme 99% chance of damaging wind over 30 yrs
- Air quality 2/10 Low 1 unhealthy d/yr today · 2 by 30 yrs out
Nearby sold comps map
Loading sold comps map…
Walkable amenities ~0.75 mi
Loading nearby amenities…
Taxation est. · year 1
- Rental income
- $20,255
- − Mortgage interest
- −$10,475
- − Property taxes
- −$753
- − Insurance
- −$1,732
- − Repairs & maintenance
- −$1,620
- − Management
- −$1,620
- − Depreciation
- −$5,440
- Taxable loss
- −$1,386
- Est. tax savings @ 24.0%
- +$333
- After-tax cash flow
- $2,081/yr
For passive investors: Depreciation is non-cash, so a rental often shows a tax loss while cash-flowing — sheltering income. Rental losses are passive: they offset passive income freely, and up to $25,000/yr can offset ordinary (W-2) income if you actively participate and your MAGI is under $100k (phasing out to $0 by $150k); unused losses carry forward. On sale, claimed depreciation is recaptured at up to 25%, and gains may owe capital-gains tax (a 1031 exchange can defer both). Figures are a year-1 estimate at your 24.0% rate — not tax advice; consult a CPA.
Schools (NCES district)
- District
- St. Tammany Parish
- NCES district ID
- 2201650
- Math proficiency
- 43% ▼ -32.00%
- Reading proficiency
- 55% ▼ -26.00%
- Median HH income
- $61,752
- Composite
- 43.04/100
- National rank
- #3098
- State rank
- #11 of 98 in LA
Livability — Slidell
- Score
- 70/100
- State rank
- #57
- US rank
- #7673
Category grades
Schools grade is shown separately in the Schools card above.
Census & demographics
- County
- Saint Tammany Parish · 228,296 people
- City population
- 95,511
- Metro
- New Orleans-Metairie, LA
- Population (ZIP)
- 34,808
- Household income
- $89,003
- Rent vs Own
- Severe rent burden
- 328.0
Population outlook (St. Tammany County) Hauer SSP2
- Today (2025)
- 286,725 people
- By 2030
- 304,175 · +6.1%
- By 2040
- 336,203 · +17.3%
- By 2050
- 364,590 · +27.2%
- By 2075
- 433,362 · +51.1%
- By 2100
- 470,333 · +64.0%
Race, ethnicity, and origin ACS 2023
- Neighborhood character
- Diverse neighborhood (Simpson 0.63)
- Race & ethnicity
- White 55% Black 24% Two or more races 14% Hispanic / Latino 11% Asian 3%
- Hispanic origin (detail)
- Common ancestry
- Lithuanian 9% Italian 1% Romanian 1%
- Foreign-born
- 8% · Canada, China, Vietnam
- Languages at home
- 89% English-only · Spanish 7% Chinese 1% Vietnamese 1%
Political lean MEDSL · St. Tammany
- 2024 margin
- Solid R (+43.8) · D 27.3% · R 71.1% · Other 1.6%
- 2008→2024 swing
- +9.6pp toward D · 2008: -53.4pp · 2024: -43.8pp
- All cycles
- 2024: R+43.8 2020: R+44.2 2016: R+50.8 2012: R+52.2 2008: R+53.4
Not yet ingested
- Civics
- —
Market trends
- HPI YoY
- ▼ -74.47%
- Current HPI
- 151.3353
- Rent YoY
- ▲ 1.72%
- Metro
- New Orleans-Metairie, LA
- State GDP YoY
- ▲ 3.29%
- F500 in state
- 10
Industry mix (Fortune 500 HQ in LA)
| Industry | F500 HQs | Revenue |
|---|---|---|
| Telecommunications | 2 | $23B |
|
||
| Utilities | 1 | $12B |
|
||
| Wholesale / Distribution | 1 | $5B |
|
||
| Advertising | 1 | $2B |
|
||
Price history
-98.8% since first listed13 events — show timeline
- 2026-04-15 Rental Removed $1,070 RENTSPREE
- 2026-04-11 Listed for Rent $1,070 RENTSPREE
- 2026-03-07 Listed $187,000 GSREIN
- 2026-03-07 Listed $187,000 AcadianaMLS
- 2025-07-27 Listed $193,000 AcadianaMLS
- 2005-05-13 Sold (Public Records) $99,000 Public Records
- 2005-05-11 Sold (MLS) $99,000 GSREIN
- 2005-02-10 Listed $103,900 AcadianaMLS
- 2005-02-10 Listed $103,900 GSREIN
- 2003-06-03 Sold (Public Records) $93,300 Public Records
- 2003-05-22 Sold (MLS) $93,300 GSREIN
- 2003-03-13 Listed $89,900 GSREIN
- 2003-03-13 Listed $89,900 AcadianaMLS
Property tax history
-5.2%/yrLatest (2025): $753 · -3.8% YoY. Source: county tax records.
Cash-flow waterfall
monthlySold comps — $/sqft
last 12 mo · ≤1 miLoading sold comps…