121 Branch St · Fairborn, OH
Flood risk 1/10 · Minimal
- FEMA flood zone
- X (unshaded)
- Chance of flooding over 30 yrs
- 0.0%
- Est. flood insurance / yr
- $507 – $1,088
Fire risk 1/10 · Minimal
- Est. fire insurance / yr
- $713 – $1,323
Heat risk 3/10 · Minor
- Hot days now (above 101°F)
- 7 days/yr
- Hot days in 30 yrs
- 18 days/yr
Wind risk 2/10 · Minimal
- Chance of severe wind over 30 yrs
- —
Air-quality risk 4/10 · Minor
- Unhealthy air days now
- 4 days/yr
- Unhealthy air days in 30 yrs
- 5 days/yr
Risk factors via First Street. Map © Google.
Why this score? — see what drove the C- grade
The composite is a weighted blend of 9 inputs, each scored 0–100. Each bar is that input's sub-score; the figure is the points it added to the 100-point composite (weight × sub-score).
- Cash flow +19.5/30.0
- ARV discount +7.5/15.0
- DSCR +6.1/10.0
- 1% rule +5.2/10.0
- Condition / age +4.0/5.0
- Rent growth +3.9/5.0
- Schools +3.6/10.0
- Livability +3.6/5.0
- Appreciation +0.0/10.0
$131,900
🖨 Deal sheet 📄 Offer letter ✓ Due diligence
Listing remarks
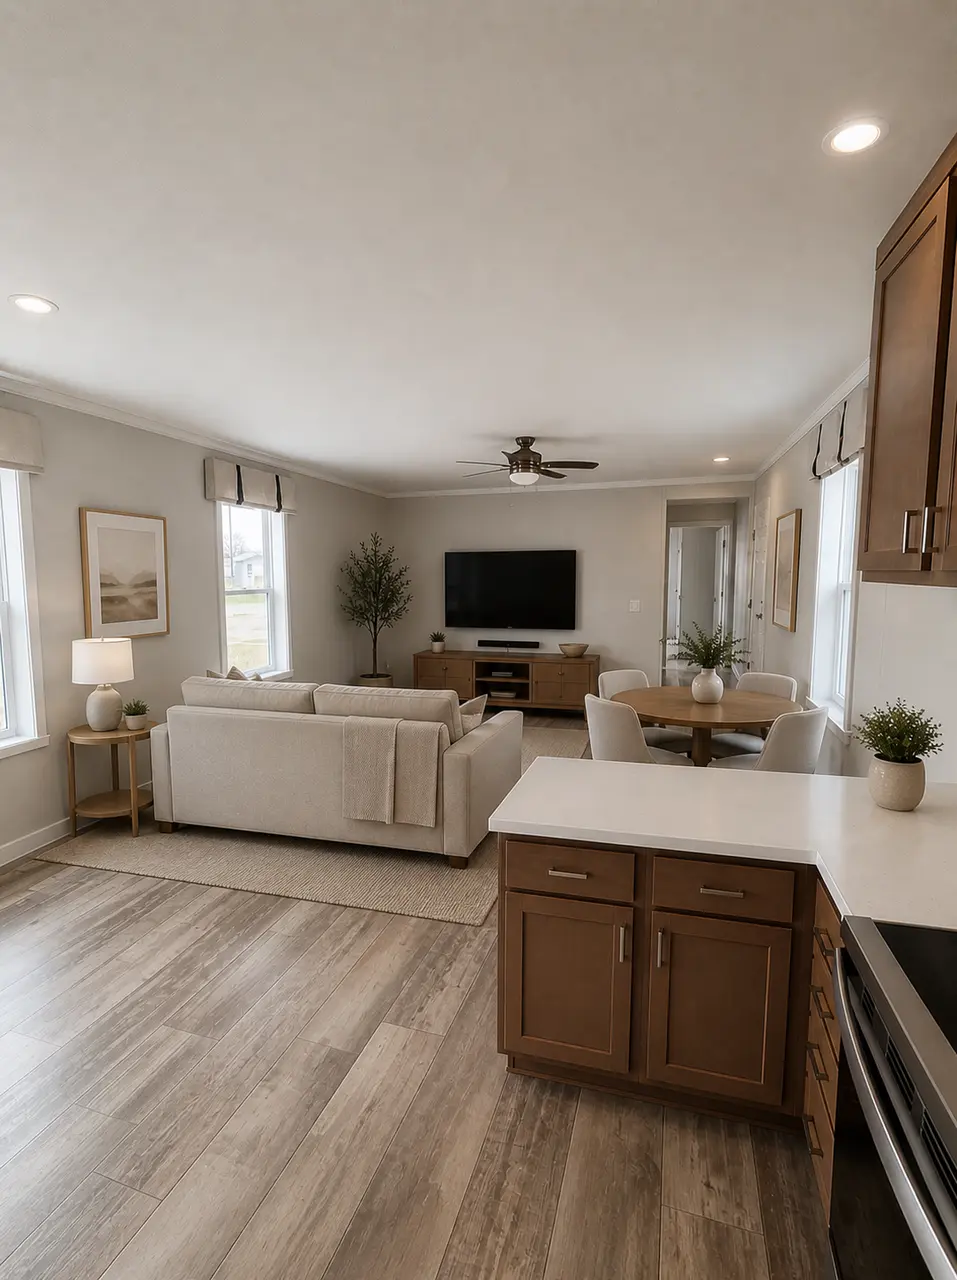
Enjoy comfortable, low-maintenance living in the welcoming 55+ community of Red Oak Mobile Home Park. This brand new manufactured home is thoughtfully designed for both style and functionality, offering modern upgrades, generous space, and a peaceful neighborhood setting. Home Features: 2 Bedrooms | 2 Full Bathrooms 1,150 sq ft of open, functional living space New driveway, and can install an awning and carport Deluxe kitchen with island counter and stainless steel appliances, including: Dishwasher Range Microwave Garbage disposal Side-by-side refrigerator with ice & amp; water dispenser Large primary bathroom, and second bathroom with tub/shower combination Upgraded finishes throughout
Key facts
- Modern upgrades
- Deluxe kitchen
- Built 2025
Tags
Neighborhood map
What this means for you Summary
Snapshot
- This is a 2-bed/2.0-bath other listed at $132k. Condition is rated good.
Deal economics
- At list price, monthly cash flow is $149 ($2k/yr) — positive.
- The deal already cash-flows at list — no discount required.
- Meets the 1% rule at list price ($1k rent vs $132k).
- Recommended offer: $130k (1.5% below list) — sets the bar for market timing.
- Cap rate 7.6% vs local median 3.7% in Fairborn — top-decile yield for the area; either an underpriced asset or a hidden risk that comps aren't pricing in. Stress-test before assuming the spread holds.
Location & tenants
- Location reads 72/100 on livability (#374 in OH) — a middle-class / working-renter tenant base. Strengths: cost of living A+, housing A+; Watch: health & safety C-, schools D+, employment D+.
- Fairborn City (suburban): math 36% / reading 49% proficiency, ranked #520 of 656 in OH (top 79%) — families likely to look elsewhere, expect single-tenant / working-renter base with shorter leases.
- Market conditions: Rents rising fast (+5.8%/yr); 180 active listings in the ZIP; 17 comparable units currently listed for rent nearby; rentals leasing fast (median 3d on market — plan ~1-2 weeks tenant-placement turnaround); 797 units permitted in Greene County in 2024 (148 in 5+ unit buildings).
Forward outlook
- Local home prices are declining (-3.0%/yr); year-one equity from $912 of loan paydown is wiped out by about $4k of value loss. Plan a longer hold.
Negotiation context
- It's been on market 30 days — a 2% lower offer ($130k) is reasonable based on typical stale-listing flexibility.
Questions for the listing agent
- Is there a deadline driving the sale (1031 exchange, divorce, estate, relocation)? That informs how much negotiation room exists.
- Schools are D-rated, which usually means shorter tenancies and higher turnover. Who's the typical renter profile here, and what's been the actual vacancy rate?
- What's the average days-on-market for RENTAL listings here right now (not sales)? A rising rental-DOM trend means longer vacancies and softer asking-rent achievability than the comps imply.
- What's the recent tenant-quality profile in this submarket — average credit score on applications, eviction rate, late-payment / NSF rate, and stable-employment percentage? A property-management company in the area should have these aggregated.
- How much new for-sale + rental construction is in the pipeline within 1–3 miles? Heavy new supply typically softens prices + rents 12–24 months out; constrained supply supports both.
Investment metrics
- 1% rule
- 1.02% ✓
- Cap rate
- 7.65%
- Cash-on-cash
- 4.83%
- DSCR
- 1.21
- GRM
- 8.2
CMA / ARV
No comps found within radius.
Projected returns pro-forma
-3.0% appreciation · 5.75% rent growth · sell at horizon
- IRR
- -5.7%
- Equity multiple
- 0.78×
- Total profit
- $-8,072
- Equity at exit
- $19,667
- IRR
- 7.0%
- Equity multiple
- 1.59×
- Total profit
- $21,807
- Equity at exit
- $11,404
Cash invested: $36,932 (down + closing). Projections, not guarantees.
Landlord ↔ Tenant lean methodology
- Overall (STATE)
- 73 Landlord-Friendly
- State Ohio
- 73 Landlord-Friendly · R+6
- County
- — inherits STATE
- City
- — inherits STATE
ZIP-level market 45324
- Rents YoY
- 5.8%
- Active inventory
- 180
- Price-to-rent
- 8.2×
Monthly cashflow live
- Estimated rent
- $1,342 high interval (Pro) →
- Mortgage (P&I)
- −$692
- Tax est. 1.5%
- −$165 /mo · $1,978/yr
- Insurance
- −$55
- HOA
- −$0
- Vacancy / Maint / Mgmt
- −$282
- Net cashflow
- $149
Break-even live
UW: 25.0% down · 7.5% · 30yr · 1.5% tax · 5.0% vac · 8.0% maint · 8.0% mgmt
Financing live
Cash to close
- Down payment
- $32,975
- Closing costs
- $3,957
- Reserves months
- —
- Total cash needed
- —
Loan-product check · same deal, 3 products live
Conventional
25% down · 7.5% · 30yr
- Down + closing
- —
- Monthly P&I
- —
- Monthly cashflow
- —
- DSCR
- —
- Eligible?
- —
Personal DTI + credit; lowest rate.
DSCR
20% down · 8.5% · 30yr
- Down + closing
- —
- Monthly P&I
- —
- Monthly cashflow
- —
- DSCR
- —
- Eligible?
- —
No personal income docs; deal must DSCR.
Hard money
10% down · 12.0% · 12mo
- Down + closing
- —
- Monthly P&I
- —
- Monthly cashflow
- —
- DSCR
- —
- Eligible?
- —
Short-term bridge; refi at stabilization.
Rent comps 17 comps
| Address | Beds | Baths | Sqft | Rent | $/sqft | DOM | Units | Dist |
|---|---|---|---|---|---|---|---|---|
| 18 Old Yellow Springs Rd Fairborn, OH | 1.0–3.0 | 1.0–2.0 | 805 | $1,025 | $1.27 | 14d | 9 | 0.17mi |
| 427 Sycamore Dr Fairborn, OH | 2.0 | 2.5 | 1397 | $1,600 | $1.15 | 19d | 1 | 0.24mi |
| 712 Hidden Valley Ct Fairborn, OH | 2.0 | 2.5 | 1428 | $1,325 | $0.93 | 2d | 1 | 0.55mi |
| 165 W Funderburg Rd Fairborn, OH | 2.0 | 1.0 | 827 | $995 | $1.20 | 2d | 2 | 0.85mi |
| 55 Truman Dr Fairborn, OH | 3.0 | 1.0 | 1354 | $1,545 | $1.14 | 43d | 1 | 0.86mi |
| 281 Orville St Fairborn, OH | 2.0 | 1.0 | 850 | $899 | $1.06 | 14d | 1 | 1.04mi |
| 454 Glenhaven Way Fairborn, OH | 2.0 | 2.0 | 1311 | $2,100 | $1.60 | 3d | 1 | 1.10mi |
| 2394 New Germany Trebein Rd Unit 305 Beavercreek, OH | 2.0 | 2.0 | 1098 | $1,750 | $1.59 | 2d | 1 | 1.11mi |
| 408 Patterson St Fairborn, OH | 3.0 | 1.0 | 988 | $1,400 | $1.42 | 11d | 1 | 1.14mi |
| 2250 Warbler Ln Fairborn, OH | 2.0 | 2.0 | 1233 | $1,906 | $1.55 | 2d | 12 | 1.27mi |
| 1647 Stewart Blvd Unit 1645 Fairborn, OH | 2.0 | 1.5 | 1024 | $900 | $0.88 | 23d | 1 | 1.31mi |
| 1802 Montgomery Ave #1804 Fairborn, OH | 2.0 | 1.0 | 806 | $975 | $1.21 | 23d | 1 | 1.31mi |
| 1636 Wilbur Ave Unit 1636 Fairborn, OH | 2.0 | 1.0 | 1440 | $850 | $0.59 | 3d | 1 | 1.34mi |
| 2335 Long Vista Ln Fairborn, OH | 2.0 | 2.0 | 1366 | $1,732 | $1.27 | 2d | 11 | 1.35mi |
| 1529 Miami Ave Fairborn, OH | 2.0 | 1.0 | 900 | $1,000 | $1.11 | 3d | 1 | 1.37mi |
| 1527 Miami Ave Fairborn, OH | 2.0 | 1.0 | 900 | $1,100 | $1.22 | 3d | 1 | 1.38mi |
| 351 Gilbert Ave Unit 351 Fairborn, OH | 2.0 | 1.0 | 1352 | $775 | $0.57 | 23d | 1 | 1.48mi |
Listing history 2 events
-
2026-05-31days on market $131,900 Active 30 DOM
-
2026-05-01$131,900 Active 1176-char remark
ⓘ Source: listings_history table (triggers on properties + properties_extension) + one-shot
backfill from property_details.listing_events for pre-trigger history.
Climate risk First Street
- Flood 1/10 Low FEMA zone X (unshaded) · 0% chance over 30 yrs
- Wildfire 1/10 Low
- Heat 3/10 Moderate 7 d/yr ≥101°F today · 18 d/yr by 30 yrs out
- Wind 2/10 Low
- Air quality 4/10 Moderate 4 unhealthy d/yr today · 5 by 30 yrs out
Nearby sold comps map
Loading sold comps map…
Walkable amenities ~0.75 mi
Loading nearby amenities…
Taxation est. · year 1
- Rental income
- $16,104
- − Mortgage interest
- −$7,388
- − Property taxes
- −$1,978
- − Insurance
- −$660
- − Repairs & maintenance
- −$1,288
- − Management
- −$1,288
- − Depreciation
- −$3,837
- Taxable loss
- −$336
- Est. tax savings @ 24.0%
- +$81
- After-tax cash flow
- $1,864/yr
For passive investors: Depreciation is non-cash, so a rental often shows a tax loss while cash-flowing — sheltering income. Rental losses are passive: they offset passive income freely, and up to $25,000/yr can offset ordinary (W-2) income if you actively participate and your MAGI is under $100k (phasing out to $0 by $150k); unused losses carry forward. On sale, claimed depreciation is recaptured at up to 25%, and gains may owe capital-gains tax (a 1031 exchange can defer both). Figures are a year-1 estimate at your 24.0% rate — not tax advice; consult a CPA.
Condition & rehab AI · 1 photo
This brand new manufactured home is in excellent condition with modern upgrades and low-maintenance living. It offers a spacious and stylish interior with a good ROI for both resale and rental.
Value-add opportunities
- Both Landscaping and curb appeal improvements — Enhances curb appeal and can attract more buyers
- Both Add awning and carport — Provides additional outdoor living space and can increase rental value
Renovation cost estimate screening
Value-add ROI direction
- Both Landscaping and curb appeal improvements — Enhances curb appeal and can attract more buyers ↑
- Both Add awning and carport — Provides additional outdoor living space and can increase rental value ↑
ⓘ Cost ranges are severity-bucket heuristics (US national rule-of-thumb). Get contractor quotes + a written scope before underwriting a rehab budget.
Schools (NCES district)
- District
- Fairborn City
- NCES district ID
- 3904396
- Math proficiency
- 36% ▼ -17.00%
- Reading proficiency
- 49% ▼ -10.00%
- Median HH income
- $45,091
- Composite
- 36.05/100
- National rank
- #4772
- State rank
- #520 of 656 in OH
Livability — Fairborn
- Score
- 72/100
- State rank
- #374
- US rank
- #6101
Category grades
Schools grade is shown separately in the Schools card above.
Census & demographics
- Census place
- Fairborn, OH
- County
- Greene County · 132,120 people
- City population
- 41,194
- Metro
- Dayton-Kettering, OH
- Population (ZIP)
- 41,194
- Household income
- $64,979
- Rent vs Own
- Severe rent burden
- 1472.0
Population outlook (Greene County) Hauer SSP2
- Today (2025)
- 170,301 people
- By 2030
- 171,840 · +0.9%
- By 2040
- 171,408 · +0.7%
- By 2050
- 167,806 · -1.5%
- By 2075
- 154,430 · -9.3%
- By 2100
- 138,669 · -18.6%
Race, ethnicity, and origin ACS 2023
- Neighborhood character
- Predominantly White (78%)
- Race & ethnicity
- White 78% Two or more races 9% Black 8% Hispanic / Latino 3% Asian 2%
- Common ancestry
- Lithuanian 2% Slovak 2% Italian 1%
- Foreign-born
- 6% · Canada, China
- Languages at home
- 94% English-only · Spanish 1% German/W. Germanic 1% Other Indo-European 1%
Political lean MEDSL · Greene
- 2024 margin
- R (+19.8) · D 39.5% · R 59.3% · Other 1.2%
- 2008→2024 swing
- -1.4pp toward R · 2008: -18.4pp · 2024: -19.8pp
- All cycles
- 2024: R+19.8 2020: R+19.5 2016: R+24.5 2012: R+21.8 2008: R+18.4
Not yet ingested
- Civics
- —
Market trends
- HPI YoY
- ▼ -157.48%
- Current HPI
- 228.0801
- Rent YoY
- ▲ 5.75%
- Metro
- Dayton-Kettering, OH
- State GDP YoY
- ▲ 1.98%
- F500 in state
- 48
Industry mix (Fortune 500 HQ in OH)
| Industry | F500 HQs | Revenue |
|---|---|---|
| Insurance | 3 | $145B |
|
||
| Industrial Machinery | 3 | $49B |
|
||
| Financial Services | 3 | $24B |
|
||
| Consumer Goods | 2 | $93B |
|
||
| Aerospace / Defense | 2 | $47B |
|
||
| Utilities | 2 | $33B |
|
||
Cash-flow waterfall
monthlySold comps — $/sqft
last 12 mo · ≤1 miLoading sold comps…