 Multi-family
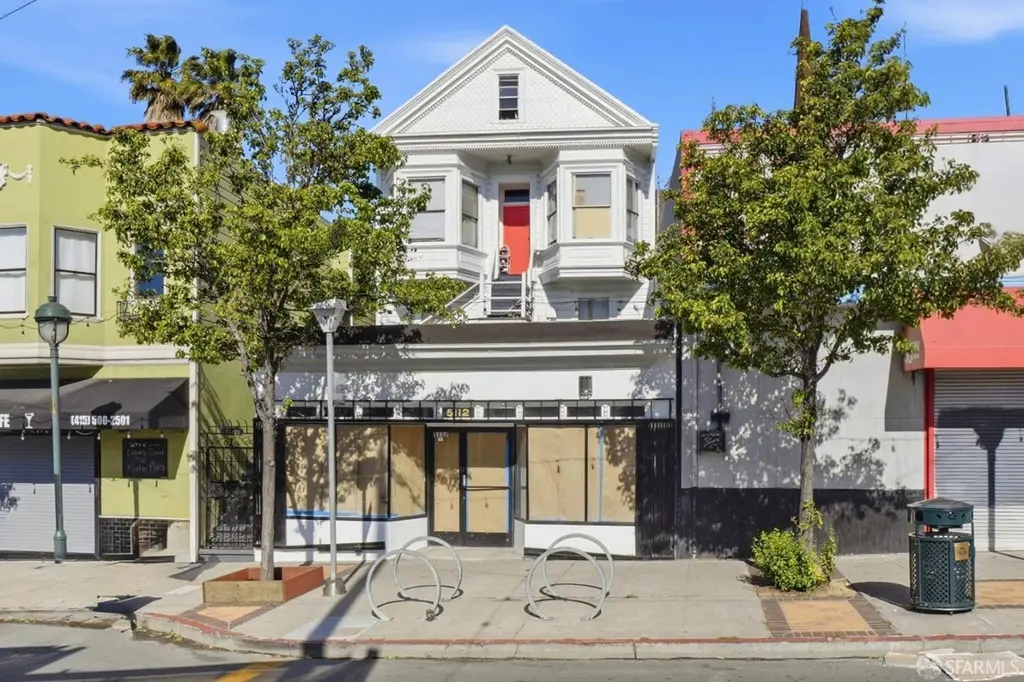
5110-5112 3rd St · San Francisco, CA
Flood risk No data
- FEMA flood zone
- —
- Chance of flooding over 30 yrs
- —
- Est. flood insurance / yr
- —
Fire risk No data
- Est. fire insurance / yr
- —
Heat risk No data
- Hot days now (above threshold)
- —
- Hot days in 30 yrs
- —
Wind risk No data
- Chance of severe wind over 30 yrs
- —
Air-quality risk No data
- Unhealthy air days now
- —
- Unhealthy air days in 30 yrs
- —
Risk factors via First Street. Map © Google.
Why this score? — see what drove the C- grade
The composite is a weighted blend of 9 inputs, each scored 0–100. Each bar is that input's sub-score; the figure is the points it added to the 100-point composite (weight × sub-score).
- Cash flow +18.7/30.0
- ARV discount +7.5/15.0
- DSCR +5.9/10.0
- 1% rule +5.0/10.0
- Schools +5.0/10.0
- Livability +3.8/5.0
- Rent growth +2.5/5.0
- Condition / age +2.2/5.0
- Appreciation +0.0/10.0
$1,250,000
🖨 Deal sheet (PDF) 📄 Offer letter ✓ Due diligence
Multi-family units
County records classify this as Multi-Family (2-4 Unit). Listing-text estimate: 1 unit. estimate disagrees with records
Listing remarks
5110-5112 Third Street is a three-unit mixed-use property in San Francisco's Bayview neighborhood, featuring two residential units (one 2BD/1BA and one 3BD/1BA) and one ground-floor commercial space. The retail unit will be delivered vacant, offering immediate lease-up or owner-user potential. Both residential units are occupied at below-market rents, providing significant upside through future turnover. Located along the Third Street commercial corridor with strong pedestrian and vehicle exposure, the property benefits from convenient access to the Muni Metro T Third Street line and neighborhood amenities serving Bayview, Bayshore, and Silver Terrace. A compelling value-add opportunity wit
Key facts
- Immediate lease-up
- Mixed-use property
- 2,794 sq ft lot
Tags
Property features AI
Finance
- Other: Building area approximately 3,125 (assessor auto-fill)
- Financial info: Three units total: two leased, one vacant
- HOA & community: No association fee
Exterior
- Utilities: Gas on a separate meter; Electric on a separate meter
- Home design: Residential income, mixed-use property; Duplex subtype; Commercial unit plus two apartment units
- Construction: Built in 1905
- Exterior features: Lot features: none noted; Lot size about 2,794 sq ft (0.0641 acres)
Interior
- Bedrooms: 4 bedrooms total; Unit 2: 2-bedroom apartment; Unit 3: 2-bedroom apartment
- Bathrooms: 1 full bathroom total; Unit 2: 2 bathrooms; Unit 3: 1 bathroom
- Interior features: Mixed-use residential income property with commercial space; Three or more levels
Neighborhood map
What this means for you Summary
Snapshot
- This is a 4-bed/1.0-bath multifamily listed at $1.25M. Condition is rated fair.
Deal economics
- At list price, monthly cash flow is $1k ($15k/yr) — positive.
- The deal already cash-flows at list — no discount required.
- To meet the 1% rule (rent ≥ 1% of price), the offer needs to be $1.25M (0.1% below list).
- Recommended offer: $1.23M (1.5% below list) — sets the bar for market timing.
- Cap rate 7.5% vs local median 2.1% in San Francisco — top-decile yield for the area; either an underpriced asset or a hidden risk that comps aren't pricing in. Stress-test before assuming the spread holds.
Location & tenants
- Location reads 76/100 on livability (#90 in CA, #3,143 nationally) — a middle-class / working-renter tenant base. Strengths: amenities A+, commute A+, employment A+; Watch: crime F, cost of living F.
- San Francisco Unified (urban): math 50% / reading 56% proficiency, ranked #322 of 1,400 in CA (top 23%) — acceptable for families but not a draw, mixed tenant base, ~2y average lease.
- Market conditions: 95 active listings in the ZIP; 2 comparable units currently listed for rent nearby; solid renter incomes; 750 units permitted in San Francisco County in 2024 (688 in 5+ unit buildings).
- At $12,489/mo this rent would consume 186% of the median local household income ($81k/yr) (locally 1605% of renters already pay >50% of income on rent) — very limited rent-growth headroom before tenants either downsize or default.
Forward outlook
- Local home prices are declining (-3.0%/yr); year-one equity from $9k of loan paydown is wiped out by about $38k of value loss. Plan a longer hold.
- San Francisco County population projected at +39% by 2050 — long-run rental-demand tailwind backs the buy-and-hold thesis.
Negotiation context
- It's been on market 18 days — a 2% lower offer ($1.23M) is reasonable based on typical stale-listing flexibility.
- 5 sale attempts since 33y ago with the ask held roughly flat each time — persistent listings suggest the price (not the market) is what's stuck; bring a comps-based counter.
- Current owner paid $500k; list at $1.25M implies a 150% gain — meaningful room to come down on a strong offer.
Risks & watch-outs
- Watch-outs: built in 1905 — expect roof / HVAC / electrical / plumbing capex.
Questions for the listing agent
- Have any recent inspections been done? Can we get a copy of the seller's disclosures and any deferred-maintenance estimates?
- Built in 1905 — when were the roof, HVAC, electrical panel, plumbing, and water heater last replaced?
- Is there a deadline driving the sale (1031 exchange, divorce, estate, relocation)? That informs how much negotiation room exists.
- Schools are B-rated — typically a magnet for longer-tenancy family renters. What's the average tenant stay here, and is there a school-zone premium baked into asking?
- Crime grade is F in this area — have there been break-ins, vandalism, or insurance claims at this property in the last 3 years? What carrier currently insures it and at what premium?
- What's the average days-on-market for RENTAL listings here right now (not sales)? A rising rental-DOM trend means longer vacancies and softer asking-rent achievability than the comps imply.
- What's the recent tenant-quality profile in this submarket — average credit score on applications, eviction rate, late-payment / NSF rate, and stable-employment percentage? A property-management company in the area should have these aggregated.
- How much new apartment / multifamily construction is in the pipeline within 1–3 miles? Heavy new supply (>2% of stock underway) typically softens rents 12–24 months out; light construction supports rent growth.
Investment metrics
- 1% rule
- 1.00% ✗
- Cap rate
- 7.47%
- Cash-on-cash
- 4.21%
- DSCR
- 1.19
- GRM
- 8.3
CMA / ARV
No comps found within radius.
Projected returns pro-forma
-3.0% appreciation · 3.0% rent growth · sell at horizon
- IRR
- -9.7%
- Equity multiple
- 0.65×
- Total profit
- $-124,163
- Equity at exit
- $186,379
- IRR
- -0.3%
- Equity multiple
- 0.98×
- Total profit
- $-6,656
- Equity at exit
- $108,077
Cash invested: $350,000 (down + closing). Projections, not guarantees.
Landlord ↔ Tenant lean methodology
- Overall (CITY)
- 0 Strongly Tenant-Friendly
- State California
- 18 Strongly Tenant-Friendly · D+13
- County
- — inherits STATE
- City San Francisco
- 0 Strongly Tenant-Friendly · D+57
ZIP-level market 94124
- Active inventory
- 95
- Price-to-rent
- 25.8×
Monthly cashflow live
- Estimated rent
- $12,489 high interval (Pro) →
- Mortgage (P&I)
- −$6,555
- Tax est. 1.5%
- −$1,562 /mo · $18,750/yr
- Insurance
- −$521
- HOA
- −$0
- Vacancy / Maint / Mgmt
- −$2,623
- Net cashflow
- $1,228
Break-even live
Sensitivity live
| Price | -10% $2,092 | -5% $1,660 | +0% $1,228 | +5% $796 | +10% $364 |
|---|---|---|---|---|---|
| Rent | -10% $241 | -5% $735 | +0% $1,228 | +5% $1,721 | +10% $2,214 |
| Rate | -1.0pp $1,857 | -0.5pp $1,546 | base $1,228 | +0.5pp $904 | +1.0pp $574 |
3-unit breakdown (identical units grouped — click to expand)
| Units | Beds | Baths | Est. rent |
|---|---|---|---|
| 1× unit | 2 | 1 | $4,035 |
| 1× unit | 3 | 1 | $4,678 |
| 1× unit | 0 | 0 | $3,776 |
| Total (3 units) | $12,489 | ||
UW: 25.0% down · 7.5% · 30yr · 1.5% tax · 5.0% vac · 8.0% maint · 8.0% mgmt
Financing live
Cash to close
- Down payment
- $312,500
- Closing costs
- $37,500
- Reserves months
- —
- Total cash needed
- —
Loan-product check · same deal, 3 products live
Conventional
25% down · 7.5% · 30yr
- Down + closing
- —
- Monthly P&I
- —
- Monthly cashflow
- —
- DSCR
- —
- Eligible?
- —
Personal DTI + credit; lowest rate.
DSCR
20% down · 8.5% · 30yr
- Down + closing
- —
- Monthly P&I
- —
- Monthly cashflow
- —
- DSCR
- —
- Eligible?
- —
No personal income docs; deal must DSCR.
Hard money
10% down · 12.0% · 12mo
- Down + closing
- —
- Monthly P&I
- —
- Monthly cashflow
- —
- DSCR
- —
- Eligible?
- —
Short-term bridge; refi at stabilization.
Rent comps 2 comps
| Address | Beds | Baths | Sqft | Rent | $/sqft | DOM | Units | Dist |
|---|---|---|---|---|---|---|---|---|
| 848 Girard St San Francisco, CA | 3.0 | 1.0 | 3544 | $3,500 | $0.99 | 21d | 1 | 0.91mi |
| 66 Mill St San Francisco, CA | 3.0 | 2.0 | 2150 | $5,295 | $2.46 | 45d | 1 | 1.20mi |
Listing history 12 events
-
2026-06-21days on market $1,250,000 Active 18 DOM
-
2026-06-18days on market $1,250,000 Active 15 DOM
-
2026-06-17days on market $1,250,000 Active 14 DOM
-
2026-06-16days on market $1,250,000 Active 13 DOM
-
2026-06-15days on market $1,250,000 Active 12 DOM
-
2026-06-13days on market $1,250,000 Active 10 DOM
-
2026-06-13days on market $1,250,000 Active 9 DOM
-
2026-06-09days on market $1,250,000 Active 6 DOM
-
2026-06-08days on market $1,250,000 Active 5 DOM
-
2026-06-07days on market $1,250,000 Active 4 DOM
-
2026-06-04remarks 699-char remark
-
2026-06-04$1,250,000 Active 1 DOM
ⓘ Source: listings_history table (triggers on properties + properties_extension) + one-shot
backfill from property_details.listing_events for pre-trigger history.
Nearby sold comps map
Loading sold comps map…
Walkable amenities ~0.75 mi
Loading nearby amenities…
Taxation est. · year 1
- Rental income
- $149,868
- − Mortgage interest
- −$70,019
- − Property taxes
- −$18,750
- − Insurance
- −$6,250
- − Repairs & maintenance
- −$11,989
- − Management
- −$11,989
- − Depreciation
- −$36,364
- Taxable loss
- −$5,494
- Est. tax savings @ 24.0%
- +$1,319
- After-tax cash flow
- $16,053/yr
For passive investors: Depreciation is non-cash, so a rental often shows a tax loss while cash-flowing — sheltering income. Rental losses are passive: they offset passive income freely, and up to $25,000/yr can offset ordinary (W-2) income if you actively participate and your MAGI is under $100k (phasing out to $0 by $150k); unused losses carry forward. On sale, claimed depreciation is recaptured at up to 25%, and gains may owe capital-gains tax (a 1031 exchange can defer both). Figures are a year-1 estimate at your 24.0% rate — not tax advice; consult a CPA.
Condition & rehab AI · 14 photos
This three-unit property requires moderate renovations to its interiors and exteriors, with a focus on updating the kitchen and bathrooms and improving the landscaping. These updates will significantly enhance its resale and rental value.
Repairs flagged
- Major Kitchen cabinets — Significant wear and tear, requiring replacement or major repair.
- Major Bathroom fixtures — Outdated and worn, requiring replacement or major repair.
- Moderate Exterior siding — Weathered and peeling, requiring repainting or replacement.
- Major Paint — Chipped and stained, requiring repainting.
- Major Landscaping — Overgrown and unkempt, requiring trimming and planting.
Value-add opportunities
- Both Paint and renovate kitchen and bathrooms — Fresh paint and updated fixtures will significantly improve the home's appearance and functionality, attracting both buyers and renters.
- Both Landscaping and exterior repainting — A fresh look and well-maintained landscaping will enhance curb appeal and attract potential buyers and renters.
Renovation cost estimate screening
| Repair item | Severity | Est. cost |
|---|---|---|
| Kitchen cabinets · Significant wear and tear, requiring replacement or major repair. | Major | $15,000–50,000 |
| Bathroom fixtures · Outdated and worn, requiring replacement or major repair. | Major | $15,000–50,000 |
| Exterior siding · Weathered and peeling, requiring repainting or replacement. | Moderate | $3,000–15,000 |
| Paint · Chipped and stained, requiring repainting. | Major | $15,000–50,000 |
| Landscaping · Overgrown and unkempt, requiring trimming and planting. | Major | $15,000–50,000 |
| Total estimated repair cost · 5 items | $63,000–215,000 |
Value-add ROI direction
- Both Paint and renovate kitchen and bathrooms — Fresh paint and updated fixtures will significantly improve the home's appearance and functionality, attracting both buyers and renters. ↑
- Both Landscaping and exterior repainting — A fresh look and well-maintained landscaping will enhance curb appeal and attract potential buyers and renters. ↑
ⓘ Cost ranges are severity-bucket heuristics (US national rule-of-thumb). Get contractor quotes + a written scope before underwriting a rehab budget.
Schools (NCES district)
- District
- San Francisco Unified
- NCES district ID
- 0634410
- Math proficiency
- 50% ▬ 0.00%
- Reading proficiency
- 56% ▲ 1.00%
- Median HH income
- $81,249
- Composite
- 50.14/100
- National rank
- #4088
- State rank
- #322 of 1400 in CA
Livability — San Francisco
- Score
- 76/100
- State rank
- #90
- US rank
- #3143
Category grades
Schools grade is shown separately in the Schools card above.
Census & demographics
- Census place
- San Francisco, CA
- County
- San Francisco County · 827,552 people
- City population
- 827,552
- Metro
- San Francisco-Oakland-Berkeley, CA
- Population (ZIP)
- 34,475
- Household income
- $80,509
- Rent vs Own
- Severe rent burden
- 1605.0
Population outlook (San Francisco County) Hauer SSP2
- Today (2025)
- 1,030,936 people
- By 2030
- 1,110,409 · +7.7%
- By 2040
- 1,270,010 · +23.2%
- By 2050
- 1,435,001 · +39.2%
- By 2075
- 1,779,074 · +72.6%
- By 2100
- 1,966,767 · +90.8%
Race, ethnicity, and origin ACS 2023
- Neighborhood character
- Highly diverse neighborhood (Simpson 0.74)
- Race & ethnicity
- Asian 36% Black 25% Hispanic / Latino 25% Two or more races 9% White 8% Pacific Islander 2%
- Hispanic origin (detail)
- Mexican 11%
- Common ancestry
- Italian 1% Lithuanian 1%
- Foreign-born
- 37% · China, Canada, Vietnam
- Languages at home
- 47% English-only · Chinese 24% Spanish 20% Vietnamese 2%
Political lean MEDSL · San Francisco
- 2024 margin
- Solid D (+64.8) · D 80.3% · R 15.5% · Other 4.1%
- 2008→2024 swing
- -5.7pp toward R · 2008: 70.5pp · 2024: 64.8pp
- All cycles
- 2024: D+64.8 2020: D+72.5 2016: D+76.1 2012: D+70.2 2008: D+70.5
Not yet ingested
- Civics
- —
Market trends
- HPI YoY
- ▼ -909.13%
- Current HPI
- 275.3568
- Rent YoY
- —
- Metro
- San Francisco-Oakland-Berkeley, CA
- State GDP YoY
- ▲ 3.21%
- F500 in state
- 116
Industry mix (Fortune 500 HQ in CA)
| Industry | F500 HQs | Revenue |
|---|---|---|
| Technology | 27 | $1,492B |
|
||
| Financial Services | 3 | $174B |
|
||
| Retail | 3 | $44B |
|
||
| Insurance | 3 | $26B |
|
||
| Media / Entertainment | 2 | $115B |
|
||
| Pharmaceuticals / Biotech | 2 | $62B |
|
||
Price history
+380.9% since first listed7 events — show timeline
- 2026-06-01 Listed $1,250,000 San Francisco MLS
- 2003-09-03 Sold (MLS) $500,000 San Francisco MLS
- 2003-05-12 Delisted — San Francisco MLS
- 2003-03-28 Listed $525,000 San Francisco MLS
- 1995-01-10 Listed $238,000 San Francisco MLS
- 1994-06-22 Listed $239,000 San Francisco MLS
- 1993-08-06 Listed $259,950 San Francisco MLS
Cash-flow waterfall
monthlySold comps — $/sqft
last 12 mo · ≤1 miLoading sold comps…