 11-Plex
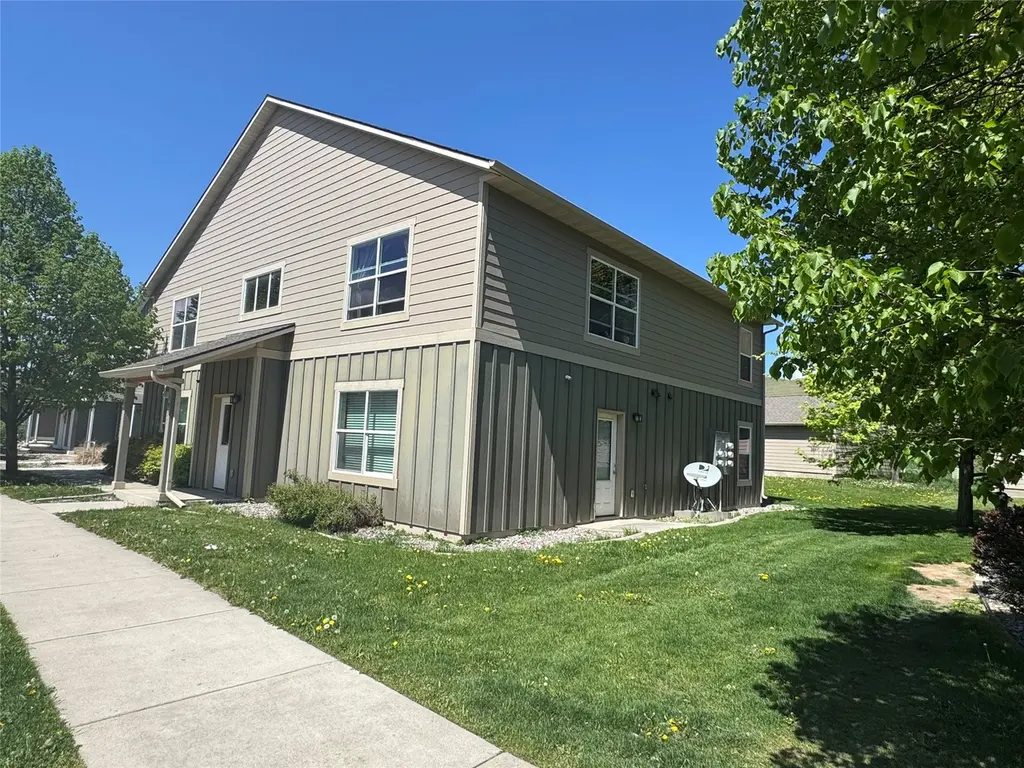
4971 Potter Park Loop · Missoula, MT
Flood risk 4/10 · Minor
- FEMA flood zone
- X (unshaded)
- Chance of flooding over 30 yrs
- 0.22%
- Est. flood insurance / yr
- $507 – $1,088
Fire risk 8/10 · Major
- Est. fire insurance / yr
- $918 – $1,706
Heat risk 3/10 · Minor
- Hot days now (above 91°F)
- 7 days/yr
- Hot days in 30 yrs
- 16 days/yr
Wind risk 1/10 · Minimal
- Chance of severe wind over 30 yrs
- —
Air-quality risk 10/10 · Severe
- Unhealthy air days now
- 26 days/yr
- Unhealthy air days in 30 yrs
- 30 days/yr
Risk factors via First Street. Map © Google.
Why this score? — see what drove the B grade
The composite is a weighted blend of 9 inputs, each scored 0–100. Each bar is that input's sub-score; the figure is the points it added to the 100-point composite (weight × sub-score).
- Cash flow +30.0/30.0
- 1% rule +10.0/10.0
- DSCR +10.0/10.0
- ARV discount +7.5/15.0
- Livability +4.0/5.0
- Schools +3.5/10.0
- Rent growth +3.1/5.0
- Condition / age +2.5/5.0
- Appreciation +0.0/10.0
$975,000
🖨 Deal sheet (PDF) 📄 Offer letter ✓ Due diligence
Multi-family units
County records classify this as Multi-Family (2-4 Unit). Listing-text estimate: 11 units. estimate disagrees with records
Listing remarks MLS
Remarks: For video tour, plat, financials etc. . go to www. missoula4plex.com Being built now. .. .Very nice 2 bedroom 1 bath four plexes with garages, landscaping, underground sprinklers along with washer & dryer hook ups inside each unit. Gross rents are $3400+ per month. Great rental properties priced right!
Key facts
- Dishwasher
- Refrigerator
- 1-car garage
Tags
Property features AI
Exterior
- Parking: Garage with 4 spaces; Alley access and on-street parking available
- Utilities: Public water; Public sewer; Electricity connected; Phone connected
- Home design: Quadruplex residential income property; Two stories
- Construction: Concrete foundation
- Exterior features: Level lot; Asphalt road frontage on a city street; Publicly maintained road; Has a view; Park nearby
Interior
- Kitchen: Dishwasher; Range; Refrigerator
- Bedrooms: Four units with 2 bedrooms each
- Bathrooms: Four units with 1 bathroom each
- Interior features: Dishwasher; Range; Refrigerator; Concrete basement (no finished basement)
- Laundry & utility: Washer hookup; Electric dryer hookup
Neighborhood map
What this means for you Summary
Snapshot
- This is a 11 × 3-bed/?-bath units multifamily listed at $975k.
Deal economics
- At list price, monthly cash flow is $7k ($82k/yr) — positive. Per door: $621/mo.
- The deal already cash-flows at list — no discount required.
- Meets the 1% rule at list price ($17k rent vs $975k).
- Cap rate 14.7% vs local median 1.7% in Missoula — top-decile yield for the area; either an underpriced asset or a hidden risk that comps aren't pricing in. Stress-test before assuming the spread holds.
Location & tenants
- Location reads 79/100 on livability (#17 in MT, #2,351 nationally) — a middle-class / working-renter tenant base. Strengths: amenities A+, commute A+, health & safety A+; Watch: employment C-, crime F.
- Missoula H S (urban): math 31% / reading 52% proficiency, ranked #53 of 116 in MT (top 46%) — families likely to look elsewhere, expect single-tenant / working-renter base with shorter leases.
- Zoned schools: Hellgate Elem Lower Grades (math 47% / reading 57%, grade C-, #69 of 293 statewide, top 27%, 338 students, 0% FRL); Hellgate Middle School (math 46% / reading 64%, grade B-, #14 of 146 statewide, top 9%, 329 students, 0% FRL); Big Sky High School (math 21% / reading 37%, grade F, #74 of 132 statewide, top 56%, 1,186 students, 0% FRL).
- Market conditions: Rents rising (+2.4%/yr); 246 active listings in the ZIP; solid renter incomes; 773 units permitted in Missoula County in 2024 (354 in 5+ unit buildings).
- At $16,518/mo this rent would consume 247% of the median local household income ($80k/yr) (locally 1022% of renters already pay >50% of income on rent) — very limited rent-growth headroom before tenants either downsize or default.
Forward outlook
- Local home prices are declining (-3.0%/yr); year-one equity from $7k of loan paydown is wiped out by about $29k of value loss. Plan a longer hold.
- Missoula County population projected at +23% by 2050 — long-run rental-demand tailwind backs the buy-and-hold thesis.
- At projected returns (-3.0% appreciation + 2.4% rent growth), your $273k cash investment doubles in ~5 years — after that, you're playing with house money.
Negotiation context
- Only 9 days on market — expect competitive offers; lowballing is unlikely to land.
- 2 sale attempts since 13y ago with the ask held roughly flat each time — persistent listings suggest the price (not the market) is what's stuck; bring a comps-based counter.
Risks & watch-outs
- Climate carrying-cost: severe wildfire risk — expect insurance premiums to compound above CPI over the hold.
Questions for the listing agent
- Can we see the unit-by-unit rent roll, current vacancy, and any below-market leases? What's the average tenancy length?
- What capital expenditures (roof, boiler, parking lot, exteriors) have been made in the last 5 years, and what's planned in the next 2?
- Is there a deadline driving the sale (1031 exchange, divorce, estate, relocation)? That informs how much negotiation room exists.
- Schools are B-rated — typically a magnet for longer-tenancy family renters. What's the average tenant stay here, and is there a school-zone premium baked into asking?
- Crime grade is F in this area — have there been break-ins, vandalism, or insurance claims at this property in the last 3 years? What carrier currently insures it and at what premium?
- What's the average days-on-market for RENTAL listings here right now (not sales)? A rising rental-DOM trend means longer vacancies and softer asking-rent achievability than the comps imply.
- What's the recent tenant-quality profile in this submarket — average credit score on applications, eviction rate, late-payment / NSF rate, and stable-employment percentage? A property-management company in the area should have these aggregated.
- How much new apartment / multifamily construction is in the pipeline within 1–3 miles? Heavy new supply (>2% of stock underway) typically softens rents 12–24 months out; light construction supports rent growth.
Investment metrics
- 1% rule
- 1.69% ✓
- Cap rate
- 14.70%
- Cash-on-cash
- 30.02%
- DSCR
- 2.34
- GRM
- 4.9
CMA / ARV
No comps found within radius.
Projected returns pro-forma
-3.0% appreciation · 2.35% rent growth · sell at horizon
- IRR
- 23.9%
- Equity multiple
- 1.98×
- Total profit
- $266,208
- Equity at exit
- $145,376
- IRR
- 31.4%
- Equity multiple
- 3.74×
- Total profit
- $748,192
- Equity at exit
- $84,300
Cash invested: $273,000 (down + closing). Projections, not guarantees.
Landlord ↔ Tenant lean methodology
- Overall (STATE)
- 82 Strongly Landlord-Friendly
- State Montana
- 82 Strongly Landlord-Friendly · R+11
- County
- — inherits STATE
- City
- — inherits STATE
ZIP-level market 59808
- Rents YoY
- 2.4%
- Active inventory
- 246
- Price-to-rent
- 54.1×
Monthly cashflow live
- Estimated rent
- $16,518 medium interval (Pro) →
- Mortgage (P&I)
- −$5,113
- Tax from tax record
- −$700 /mo · $8,400/yr
- Insurance
- −$406
- HOA
- −$0
- Lot rent
- −$0
- Vacancy / Maint / Mgmt
- −$3,469
- Net cashflow
- $6,830
Break-even live
Sensitivity live
| Price | -10% $7,382 | -5% $7,106 | +0% $6,830 | +5% $6,554 | +10% $6,278 |
|---|---|---|---|---|---|
| Rent | -10% $5,525 | -5% $6,177 | +0% $6,830 | +5% $7,482 | +10% $8,135 |
| Rate | -1.0pp $7,321 | -0.5pp $7,078 | base $6,830 | +0.5pp $6,577 | +1.0pp $6,320 |
11-unit breakdown (identical units grouped — click to expand)
| Units | Beds | Baths | Est. rent |
|---|---|---|---|
| 11× units | 3 | — | $16,522 |
| #1 | 3 | — | $1,502 |
| #2 | 3 | — | $1,502 |
| #3 | 3 | — | $1,502 |
| #4 | 3 | — | $1,502 |
| #5 | 3 | — | $1,502 |
| #6 | 3 | — | $1,502 |
| #7 | 3 | — | $1,502 |
| #8 | 3 | — | $1,502 |
| #9 | 3 | — | $1,502 |
| #10 | 3 | — | $1,502 |
| #11 | 3 | — | $1,502 |
| Total (11 units) | $16,518 | ||
UW: 25.0% down · 7.5% · 30yr · 1.5% tax · 5.0% vac · 8.0% maint · 8.0% mgmt
Financing live
Cash to close
- Down payment
- $243,750
- Closing costs
- $29,250
- Reserves months
- —
- Total cash needed
- —
Loan-product check · same deal, 3 products live
Conventional
25% down · 7.5% · 30yr
- Down + closing
- —
- Monthly P&I
- —
- Monthly cashflow
- —
- DSCR
- —
- Eligible?
- —
Personal DTI + credit; lowest rate.
DSCR
20% down · 8.5% · 30yr
- Down + closing
- —
- Monthly P&I
- —
- Monthly cashflow
- —
- DSCR
- —
- Eligible?
- —
No personal income docs; deal must DSCR.
Hard money
10% down · 12.0% · 12mo
- Down + closing
- —
- Monthly P&I
- —
- Monthly cashflow
- —
- DSCR
- —
- Eligible?
- —
Short-term bridge; refi at stabilization.
Listing history 7 events
-
2026-06-22days on market $975,000 Active 9 DOM
-
2026-06-19days on market $975,000 Active 7 DOM
-
2026-06-18days on market $975,000 Active 6 DOM
-
2026-06-17days on market $975,000 Active 5 DOM
-
2026-06-16days on market $975,000 Active 4 DOM
-
2026-06-15days on market $975,000 Active 3 DOM
-
2026-06-13$975,000 Active 1 DOM
ⓘ Source: listings_history table (triggers on properties + properties_extension) + one-shot
backfill from property_details.listing_events for pre-trigger history.
Tax reassessment forecast MT · Resets to sale price
- Current annual tax
- $8,400 · $700/mo
- Projected year-2 tax
- $8,400 · $700/mo
- Expected delta
- $0/yr ($0/mo · 0.0%)
ⓘ Screening estimate from a state-policy table — verify with the county assessor before closing.
Climate risk First Street
- Flood 4/10 Moderate FEMA zone X (unshaded) · 22% chance over 30 yrs
- Wildfire 8/10 Severe
- Heat 3/10 Moderate 7 d/yr ≥91°F today · 16 d/yr by 30 yrs out
- Wind 1/10 Low
- Air quality 10/10 Extreme 26 unhealthy d/yr today · 30 by 30 yrs out
Nearby sold comps map
Loading sold comps map…
Walkable amenities ~0.75 mi
Loading nearby amenities…
Taxation est. · year 1
- Rental income
- $198,216
- − Mortgage interest
- −$54,615
- − Property taxes
- −$8,400
- − Insurance
- −$4,875
- − Repairs & maintenance
- −$15,857
- − Management
- −$15,857
- − Depreciation
- −$28,364
- Taxable income
- $70,248
- Est. tax owed @ 24.0%
- −$16,859
- After-tax cash flow
- $65,100/yr
For passive investors: Depreciation is non-cash, so a rental often shows a tax loss while cash-flowing — sheltering income. Rental losses are passive: they offset passive income freely, and up to $25,000/yr can offset ordinary (W-2) income if you actively participate and your MAGI is under $100k (phasing out to $0 by $150k); unused losses carry forward. On sale, claimed depreciation is recaptured at up to 25%, and gains may owe capital-gains tax (a 1031 exchange can defer both). Figures are a year-1 estimate at your 24.0% rate — not tax advice; consult a CPA.
Schools (NCES district)
- District
- Missoula H S
- NCES district ID
- 3018540
- Math proficiency
- 31% ▼ -8.00%
- Reading proficiency
- 52% ▼ -1.00%
- Median HH income
- $41,814
- Composite
- 34.87/100
- National rank
- #5087
- State rank
- #53 of 116 in MT
Livability — Missoula
- Score
- 79/100
- State rank
- #17
- US rank
- #2351
Category grades
Schools grade is shown separately in the Schools card above.
Census & demographics
- Census place
- Missoula, MT
- County
- Missoula County · 100,878 people
- City population
- 100,878
- Metro
- Missoula, MT
- Population (ZIP)
- 23,574
- Household income
- $80,239
- Rent vs Own
- Severe rent burden
- 1022.0
Population outlook (Missoula County) Hauer SSP2
- Today (2025)
- 127,248 people
- By 2030
- 133,571 · +5.0%
- By 2040
- 144,833 · +13.8%
- By 2050
- 156,753 · +23.2%
- By 2075
- 189,373 · +48.8%
- By 2100
- 217,637 · +71.0%
Race, ethnicity, and origin ACS 2023
- Neighborhood character
- Predominantly White (87%)
- Race & ethnicity
- White 87% Two or more races 5% Hispanic / Latino 3% Asian 3% Native American 2%
- Common ancestry
- Portuguese 6% Lithuanian 3% Italian 3%
- Foreign-born
- 3% · Canada
- Languages at home
- 94% English-only · Other Asian/Pacific 2% Spanish 2% Russian/Polish/Slavic 1%
Political lean MEDSL · Missoula
- 2024 margin
- Strong D (+21.4) · D 59.0% · R 37.5% · Other 3.5%
- 2008→2024 swing
- -5.3pp toward R · 2008: 26.7pp · 2024: 21.4pp
- All cycles
- 2024: D+21.4 2020: D+23.6 2016: D+15.8 2012: D+18.7 2008: D+26.7
Not yet ingested
- Civics
- —
Market trends
- HPI YoY
- ▼ -165.87%
- Current HPI
- 269.9288
- Rent YoY
- ▲ 2.35%
- Metro
- Missoula, MT
- State GDP YoY
- ▲ 3.41%
- F500 in state
- 2
Industry mix (Fortune 500 HQ in MT)
| Industry | F500 HQs | Revenue |
|---|---|---|
| Technology / Analytics | 1 | $2B |
|
||
Price history
+156.6% since first listed5 events — show timeline
- 2026-06-12 Price Changed $975,000 MRMLS
- 2026-06-12 Listed $950,000 MRMLS
- 2023-06-13 Rental Removed — RENT.
- 2014-05-27 Sold (MLS) — MRMLS
- 2013-03-27 Listed $379,900 MRMLS
Property tax history
+6.4%/yrLatest (2025): $8,400 · +2.8% YoY. Source: county tax records.
Cash-flow waterfall
monthlySold comps — $/sqft
last 12 mo · ≤1 miLoading sold comps…