528 E Jefferson St · Van Alstyne, TX
Flood risk 1/10 · Minimal
- FEMA flood zone
- X (unshaded)
- Chance of flooding over 30 yrs
- 0.0%
- Est. flood insurance / yr
- $507 – $1,088
Fire risk 6/10 · Moderate
- Est. fire insurance / yr
- $1,222 – $2,270
Heat risk 7/10 · Major
- Hot days now (above 110°F)
- 7 days/yr
- Hot days in 30 yrs
- 22 days/yr
Wind risk 5/10 · Moderate
- Chance of severe wind over 30 yrs
- 26.0%
Air-quality risk 3/10 · Minor
- Unhealthy air days now
- 2 days/yr
- Unhealthy air days in 30 yrs
- 3 days/yr
Risk factors via First Street. Map © Google.
Why this score? — see what drove the C- grade
The composite is a weighted blend of 9 inputs, each scored 0–100. Each bar is that input's sub-score; the figure is the points it added to the 100-point composite (weight × sub-score).
- ARV discount +15.0/15.0
- Cash flow +14.0/30.0
- 1% rule +5.5/10.0
- Schools +5.3/10.0
- DSCR +4.2/10.0
- Livability +3.8/5.0
- Rent growth +2.5/5.0
- Condition / age +2.5/5.0
- Appreciation +0.0/10.0
$119,000
🖨 Deal sheet 📄 Offer letter ✓ Due diligence
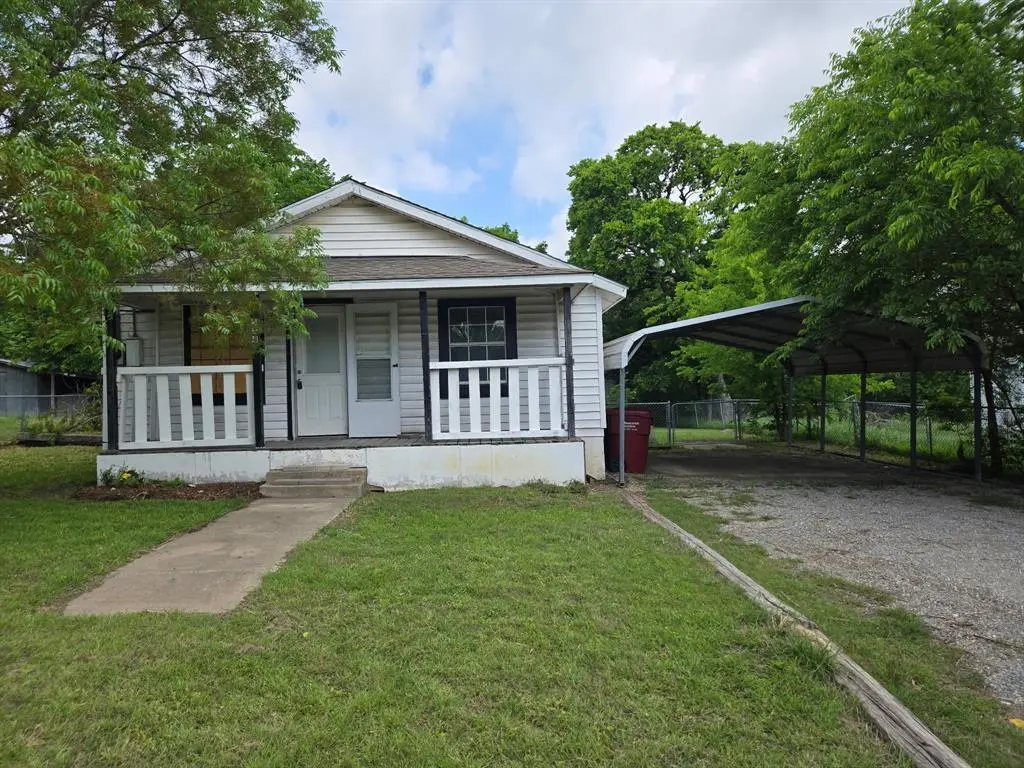
Listing remarks
Prime investment opportunity or a blank canvas for the visionary buyer at 528 East Jefferson. This property is ready for a complete renovation and is priced accordingly, offering tremendous location, lot size, and potential. Sold in as-is condition. The lot size is 8,587 sq ft. , with a current appraised value of over $99,000.00 just for the land (Grayson County Appraiser District). The current tax value on the existing structures and lot is over $160,000.00. Perfectly situated one block from vibrant downtown Van Alstyne, Texas, a community rooted in history and geared towards the future. Van Alstyne offers a unique blend of small-town charm, suburban convenience, and good schools, making i
Key facts
- Complete renovation
- Lot size
- 8,581 sq ft lot
Tags
Property features AI
Finance
- Other: Property is listed as residential, single family; status Active Under Contract
- Financial info: No second mortgage listed; Loan type: Treat As Clear
- HOA & community: No homeowners association
Exterior
- Parking: No covered or carport spaces listed; Other parking features
- Utilities: City water; City sewer; Not in a municipal utility district
- Home design: Single-family residence; Residential property; Built in 1940; One story
- Construction: Year built: 1940
- Exterior features: Lot of approximately 0.197 acres; Lot recorded by assessor; Subdivision: OTP Van Alstyne Add
Interior
- Kitchen: Other appliances
- Bedrooms: 2 bedrooms (primary bedroom on main level)
- Bathrooms: 1 full bathroom
- Interior features: One-level layout; Living area of 826; One living area; One dining area; Other interior features
- Laundry & utility: No specific laundry details provided
Neighborhood map
What this means for you Summary
Snapshot
- This is a 2-bed/1.0-bath single-family listed at $119k.
Deal economics
- At list price, monthly cash flow is $15 ($185/yr) — positive.
- The deal already cash-flows at list — no discount required.
- Meets the 1% rule at list price ($1k rent vs $119k).
- Recommended offer: $115k (3.0% below list) — sets the bar for market timing.
- Cap rate 6.4% vs local median 2.7% in Van Alstyne — top-decile yield for the area; either an underpriced asset or a hidden risk that comps aren't pricing in. Stress-test before assuming the spread holds.
Location & tenants
- Location reads 75/100 on livability (#134 in TX, #3,950 nationally) — a middle-class / working-renter tenant base. Strengths: crime A+, employment A+, cost of living A+; Watch: amenities F, commute F, health & safety F.
- Van Alstyne ISD (rural): math 62% / reading 59% proficiency, ranked #51 of 826 in TX (top 6%) — acceptable for families but not a draw, mixed tenant base, ~2y average lease.
- Market conditions: 624 active listings in the ZIP; 6 comparable units currently listed for rent nearby; rentals lingering (median 44d on market — plan ~5-8 weeks vacancy on turnover, expect pricing pressure); 50% of comp listings sitting > 30 days — soft ceiling on asking rent; high-income renter base; 2,272 units permitted in Grayson County in 2024 (750 in 5+ unit buildings).
- This rent is only 13% of the median local income ($112k/yr) — well below the 30% rent-burden line; pricing power to push rent on renewal without tenant pushback.
Forward outlook
- Local home prices are declining (-3.0%/yr); year-one equity from $823 of loan paydown is wiped out by about $4k of value loss. Plan a longer hold.
- Grayson County population projected at +12% by 2050 — modest demand growth; plan on rents tracking national, not racing it.
Negotiation context
- It's been on market 52 days — a 3% lower offer ($115k) is reasonable based on typical stale-listing flexibility.
- 2 sale attempts with the ask held roughly flat each time — persistent listings suggest the price (not the market) is what's stuck; bring a comps-based counter.
Risks & watch-outs
- Watch-outs: property tax is 3.0% of price; built in 1940 — expect roof / HVAC / electrical / plumbing capex.
- Climate carrying-cost: moderate wind risk, 26% chance of damaging wind over 30y; major wildfire risk; extreme-heat days projected 7→22/yr by 2055 (HVAC capex compounding) — expect insurance premiums to compound above CPI over the hold.
Questions for the listing agent
- It's been on market 52 days. Have you received any prior offers? Is the seller open to a 3% concession, seller financing, or rate buy-down credit?
- Built in 1940 — when were the roof, HVAC, electrical panel, plumbing, and water heater last replaced?
- Property tax is high relative to price — has the assessment been appealed recently, and will the sale trigger a re-assessment?
- Is there a deadline driving the sale (1031 exchange, divorce, estate, relocation)? That informs how much negotiation room exists.
- Schools are B-rated — typically a magnet for longer-tenancy family renters. What's the average tenant stay here, and is there a school-zone premium baked into asking?
- What's the average days-on-market for RENTAL listings here right now (not sales)? A rising rental-DOM trend means longer vacancies and softer asking-rent achievability than the comps imply.
- What's the recent tenant-quality profile in this submarket — average credit score on applications, eviction rate, late-payment / NSF rate, and stable-employment percentage? A property-management company in the area should have these aggregated.
- How much new for-sale + rental construction is in the pipeline within 1–3 miles? Heavy new supply typically softens prices + rents 12–24 months out; constrained supply supports both.
Investment metrics
- 1% rule
- 1.05% ✓
- Cap rate
- 6.45%
- Cash-on-cash
- 0.56%
- DSCR
- 1.02
- GRM
- 7.9
CMA / ARV
- ARV (median comp)
- $189,479
- List price
- $119,000
- Delta
- -37.20%
- Verdict
- UNDERPRICED
- Comps
- 20 within 1.0 mi
Show comp detail 3 sales within ~0.75 mi
| Address | Dist | Beds/Ba | Sqft | Sold | Price | $/sf | Match |
|---|---|---|---|---|---|---|---|
| 528 E Jefferson St | 0.00mi | 2/1.0 | 826 (0%) | 0mo | $119,000 | $144 | 100 |
| 226 Baldwin St | 0.40mi | 2/1.0 | 752 (-9%) | 14mo | $135,000 | $180 | 54 |
| 841 S Burk St | 0.48mi | 2/1.0 | 875 (+6%) | 16mo | $244,999 | $280 | 54 |
Match score weights: distance 35% · size 25% · config 20% · recency 20%. Top-matched comps best support the ARV.
Projected returns pro-forma
-3.0% appreciation · 3.0% rent growth · sell at horizon
- IRR
- -15.3%
- Equity multiple
- 0.45×
- Total profit
- $-18,189
- Equity at exit
- $17,743
- IRR
- -6.6%
- Equity multiple
- 0.58×
- Total profit
- $-14,122
- Equity at exit
- $10,289
Cash invested: $33,320 (down + closing). Projections, not guarantees.
Landlord ↔ Tenant lean methodology
- Overall (STATE)
- 87 Strongly Landlord-Friendly
- State Texas
- 87 Strongly Landlord-Friendly · R+5
- County
- — inherits STATE
- City
- — inherits STATE
ZIP-level market 75495
- Home prices YoY
- -10.4%
- Active inventory
- 624
- Price-to-rent
- 7.9×
Monthly cashflow live
- Estimated rent
- $1,250 high interval (Pro) →
- Mortgage (P&I)
- −$624
- Tax from tax record
- −$299 /mo · $3,583/yr
- Insurance
- −$50
- HOA
- −$0
- Vacancy / Maint / Mgmt
- −$263
- Net cashflow
- $15
Break-even live
UW: 25.0% down · 7.5% · 30yr · 1.5% tax · 5.0% vac · 8.0% maint · 8.0% mgmt
Financing live
Cash to close
- Down payment
- $29,750
- Closing costs
- $3,570
- Reserves months
- —
- Total cash needed
- —
Loan-product check · same deal, 3 products live
Conventional
25% down · 7.5% · 30yr
- Down + closing
- —
- Monthly P&I
- —
- Monthly cashflow
- —
- DSCR
- —
- Eligible?
- —
Personal DTI + credit; lowest rate.
DSCR
20% down · 8.5% · 30yr
- Down + closing
- —
- Monthly P&I
- —
- Monthly cashflow
- —
- DSCR
- —
- Eligible?
- —
No personal income docs; deal must DSCR.
Hard money
10% down · 12.0% · 12mo
- Down + closing
- —
- Monthly P&I
- —
- Monthly cashflow
- —
- DSCR
- —
- Eligible?
- —
Short-term bridge; refi at stabilization.
Rent comps 6 comps
| Address | Beds | Baths | Sqft | Rent | $/sqft | DOM | Units | Dist |
|---|---|---|---|---|---|---|---|---|
| 653 N Henry Hynds Expy Van Alstyne, TX | 2.0 | 1.0 | 575 | $999 | $1.74 | 17d | 3 | 0.93mi |
| 15 Henry Hynds Expy Unit 15 Van Alstyne, TX | 2.0 | 1.0 | 750 | $999 | $1.33 | 43d | 1 | 0.95mi |
| 500 U.S. 75 Unit 1 Van Alstyne, TX | 2.0 | 1.0 | 750 | $999 | $1.33 | 24d | 1 | 1.00mi |
| 500 U.S. 75 Unit 35 Van Alstyne, TX | 1.0 | 1.0 | 600 | $899 | $1.50 | 20d | 1 | 1.00mi |
| 500 U.S. 75 Unit 6 Van Alstyne, TX | 1.0 | 1.0 | 600 | $899 | $1.50 | 43d | 1 | 1.00mi |
| 500 U.S. 75 Unit 9 Van Alstyne, TX | 2.0 | 1.0 | 750 | $999 | $1.33 | 43d | 1 | 1.00mi |
Listing history 15 events
-
2026-06-15status $119,000 Pending 52 DOM
-
2026-06-15days on market $119,000 Active Option Contract 52 DOM
-
2026-06-13days on market $119,000 Active Option Contract 50 DOM
-
2026-06-13days on market $119,000 Active Option Contract 49 DOM
-
2026-06-09days on market $119,000 Active Option Contract 46 DOM
-
2026-06-08days on market $119,000 Active Option Contract 45 DOM
-
2026-06-07days on market $119,000 Active Option Contract 44 DOM
-
2026-06-04days on market $119,000 Active Option Contract 41 DOM
-
2026-06-03statusdays on market $119,000 Active Option Contract 40 DOM
-
2026-06-02days on market $119,000 Active 39 DOM
-
2026-06-01days on market $119,000 Active 38 DOM
-
2026-05-31days on market $119,000 Active 37 DOM
-
2026-04-22$119,000 Active 743-char remark
-
2006-04-27soldstatus
-
1998-08-04soldstatus
ⓘ Source: listings_history table (triggers on properties + properties_extension) + one-shot
backfill from property_details.listing_events for pre-trigger history.
Tax reassessment forecast TX · Resets to sale price
- Current annual tax
- $3,583 · $299/mo
- Projected year-2 tax
- $3,583 · $299/mo
- Expected delta
- $0/yr ($0/mo · 0.0%)
ⓘ Screening estimate from a state-policy table — verify with the county assessor before closing.
Climate risk First Street
- Flood 1/10 Low FEMA zone X (unshaded) · 0% chance over 30 yrs
- Wildfire 6/10 Major
- Heat 7/10 Severe 7 d/yr ≥110°F today · 22 d/yr by 30 yrs out
- Wind 5/10 Major 26% chance of damaging wind over 30 yrs
- Air quality 3/10 Moderate 2 unhealthy d/yr today · 3 by 30 yrs out
Nearby sold comps map
Loading sold comps map…
Walkable amenities ~0.75 mi
Loading nearby amenities…
Taxation est. · year 1
- Rental income
- $15,003
- − Mortgage interest
- −$6,666
- − Property taxes
- −$3,583
- − Insurance
- −$595
- − Repairs & maintenance
- −$1,200
- − Management
- −$1,200
- − Depreciation
- −$3,462
- Taxable loss
- −$1,704
- Est. tax savings @ 24.0%
- +$409
- After-tax cash flow
- $594/yr
For passive investors: Depreciation is non-cash, so a rental often shows a tax loss while cash-flowing — sheltering income. Rental losses are passive: they offset passive income freely, and up to $25,000/yr can offset ordinary (W-2) income if you actively participate and your MAGI is under $100k (phasing out to $0 by $150k); unused losses carry forward. On sale, claimed depreciation is recaptured at up to 25%, and gains may owe capital-gains tax (a 1031 exchange can defer both). Figures are a year-1 estimate at your 24.0% rate — not tax advice; consult a CPA.
Schools (NCES district)
- District
- Van Alstyne ISD
- NCES district ID
- 4843890
- Math proficiency
- 62% ▼ -1.00%
- Reading proficiency
- 59% ▼ -2.00%
- Median HH income
- $68,451
- Composite
- 53.28/100
- National rank
- #1491
- State rank
- #51 of 826 in TX
Livability — Van Alstyne
- Score
- 75/100
- State rank
- #134
- US rank
- #3950
Category grades
Schools grade is shown separately in the Schools card above.
Census & demographics
- Census place
- Van Alstyne, TX
- County
- Grayson County · 108,053 people
- City population
- 11,120
- Metro
- Sherman-Denison, TX
- Population (ZIP)
- 11,120
- Household income
- $111,563
- Rent vs Own
- Severe rent burden
- 93.0
Population outlook (Grayson County) Hauer SSP2
- Today (2025)
- 134,540 people
- By 2030
- 138,653 · +3.1%
- By 2040
- 145,958 · +8.5%
- By 2050
- 151,218 · +12.4%
- By 2075
- 161,802 · +20.3%
- By 2100
- 159,036 · +18.2%
Race, ethnicity, and origin ACS 2023
- Neighborhood character
- Predominantly White (70%)
- Race & ethnicity
- White 70% Hispanic / Latino 20% Two or more races 15% Black 4%
- Hispanic origin (detail)
- Mexican 19%
- Common ancestry
- Lithuanian 5% Slovak 3% Italian 2%
- Foreign-born
- 9% · Canada
- Languages at home
- 83% English-only · Spanish 15% Russian/Polish/Slavic 1% Tagalog/Filipino 1%
Political lean MEDSL · Grayson
- 2024 margin
- Solid R (+54.3) · D 22.5% · R 76.7%
- 2008→2024 swing
- -16.4pp toward R · 2008: -37.9pp · 2024: -54.3pp
- All cycles
- 2024: R+54.3 2020: R+49.9 2016: R+53.1 2012: R+48.0 2008: R+37.9
Not yet ingested
- Civics
- —
Market trends
- HPI YoY
- ▼ -32.06%
- Current HPI
- 274.6361
- Rent YoY
- —
- Metro
- Sherman-Denison, TX
- State GDP YoY
- ▲ 3.95%
- F500 in state
- 110
Industry mix (Fortune 500 HQ in TX)
| Industry | F500 HQs | Revenue |
|---|---|---|
| Energy | 16 | $1,198B |
|
||
| Technology | 5 | $198B |
|
||
| Engineering / Construction | 4 | $72B |
|
||
| Energy Services | 3 | $60B |
|
||
| Utilities | 3 | $41B |
|
||
| Healthcare | 2 | $330B |
|
||
Price history
8 events — show timeline
- 2026-06-15 Pending — NTREIS
- 2026-06-15 Sold (MLS) — NTREIS
- 2026-06-03 Contingent — NTREIS
- 2026-05-23 Relisted — NTREIS
- 2026-05-19 Contingent — NTREIS
- 2026-04-22 Listed $119,000 NTREIS
- 2006-04-27 Sold (Public Records) — Public Records
- 1998-08-04 Sold (Public Records) — Public Records
Property tax history
+6.0%/yrLatest (2025): $3,583 · +17.1% YoY. Source: county tax records.
Cash-flow waterfall
monthlySold comps — $/sqft
last 12 mo · ≤1 miLoading sold comps…