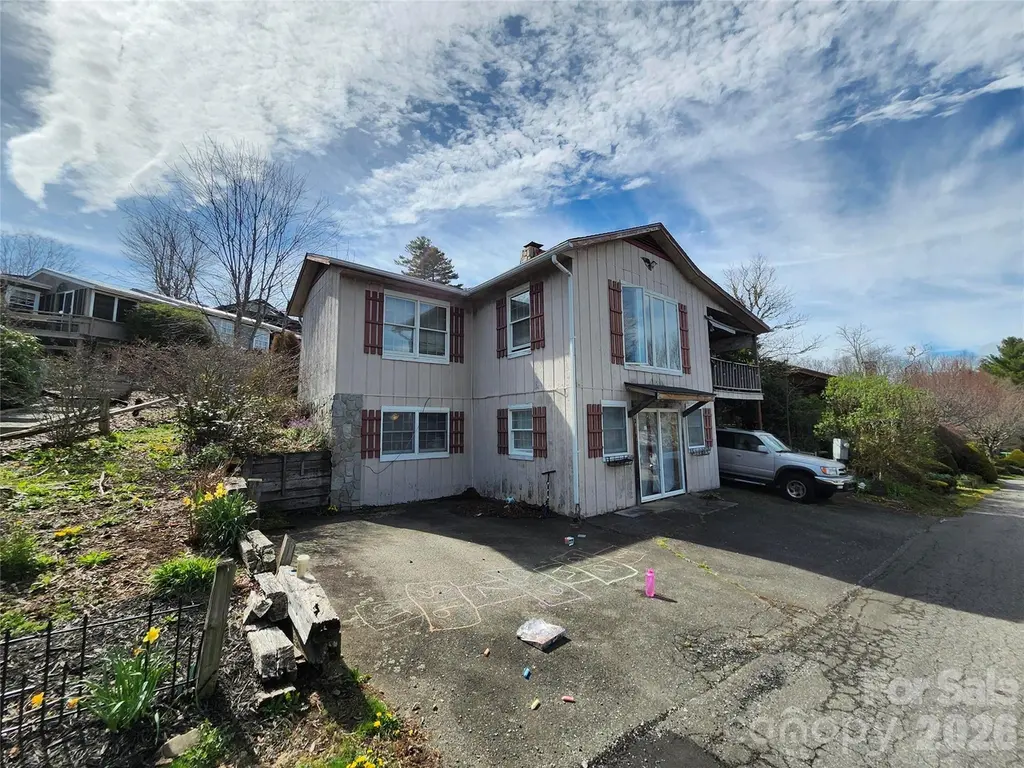
316 Snowshoe Loop · Linville, NC
Flood risk 1/10 · Minimal
- FEMA flood zone
- X (unshaded)
- Chance of flooding over 30 yrs
- 0.0%
- Est. flood insurance / yr
- $473 – $860
Fire risk 3/10 · Minor
- Est. fire insurance / yr
- $906 – $1,684
Heat risk 1/10 · Minimal
- Hot days now (above 87°F)
- 7 days/yr
- Hot days in 30 yrs
- 21 days/yr
Wind risk 2/10 · Minimal
- Chance of severe wind over 30 yrs
- —
Air-quality risk 3/10 · Minor
- Unhealthy air days now
- 2 days/yr
- Unhealthy air days in 30 yrs
- 2 days/yr
Risk factors via First Street. Map © Google.
Why this score? — see what drove the D+ grade
The composite is a weighted blend of 9 inputs, each scored 0–100. Each bar is that input's sub-score; the figure is the points it added to the 100-point composite (weight × sub-score).
- ARV discount +15.0/15.0
- Cash flow +13.0/30.0
- Schools +4.1/10.0
- 1% rule +4.0/10.0
- DSCR +3.9/10.0
- Rent growth +2.5/5.0
- Livability +2.5/5.0
- Condition / age +2.5/5.0
- Appreciation +0.0/10.0
$250,000
🖨 Deal sheet 📄 Offer letter ✓ Due diligence
Listing remarks
Investment Opportunity in Land Harbor – High-Equity Potential! Discover a premier "blank canvas" in the desirable Land Harbor community. Being sold strictly as-is, it is the perfect project for an investor or DIYer looking to create a custom mountain retreat. 700 sq ft unfinished basement has bedrooms and plumbing, just needs heat added and flooring to be added to total area. Due to the current as-is state of the home—including necessary roof, foundation, and interior repairs—it will require some effort but it is also a diamond in the rough for the right buyer. ? High-demand area with strong resale value. ? Complete creative control over finishes. Bring your con
Key facts
- Unfinished basement
- Strong resale value
- 4,356 sq ft lot
Tags
Property features AI
Finance
- Other: Property type: Residential — Single Family Residence; Lot about 0.1 acre
- HOA & community: HOA in place; dues required; Annual association fee of $3,940; Pets allowed
Exterior
- Parking: Attached garage (1 garage space, main-level garage)
- Utilities: City water available; Public sewer available; Power/source information not specified
- Home design: Single-family residence; Site-built construction; One level; Wood construction
- Construction: Wood construction; Basement foundation
- Exterior features: Publicly maintained paved/asphalt road access; No waterfront
Interior
- Kitchen: Dishwasher; Disposal; Electric cooktop; Electric oven; Refrigerator
- Bedrooms: 4 bedrooms total — 2 on the main level and 2 in the basement
- Bathrooms: 2 full bathrooms and 1 half bathroom
- Heating & cooling: Oil heating with baseboard; No central air conditioning
- Interior features: 11 total rooms; Finished basement
- Laundry & utility: Washer and dryer included; Laundry located inside
Neighborhood map
What this means for you Summary
Snapshot
- This is a 4-bed/2.0-bath single-family listed at $250k.
Deal economics
- At list price, monthly cash flow is $-16 ($-186/yr) — negative.
- To cash-flow at today's rent, offer at most $247k (1.1% below list).
- To meet the 1% rule (rent ≥ 1% of price), the offer needs to be $225k (10.0% below list).
- Recommended offer: $225k (10.0% below list) — sets the bar for 1% rule.
- Cap rate 6.2% vs local median 1.9% in Linville — top-decile yield for the area; either an underpriced asset or a hidden risk that comps aren't pricing in. Stress-test before assuming the spread holds.
Location & tenants
- Location reads: area grade D — affects rentability + tenant quality, not the cash-flow math above.
- Avery County Schools (rural): math 47% / reading 52% proficiency, ranked #70 of 178 in NC (top 39%) — families likely to look elsewhere, expect single-tenant / working-renter base with shorter leases.
- Market conditions: 207 active listings in the ZIP; 1 comparable units currently listed for rent nearby; 95 units permitted in Avery County in 2024 (0 in 5+ unit buildings).
Forward outlook
- Local home prices are declining (-3.0%/yr); year-one equity from $2k of loan paydown is wiped out by about $8k of value loss. Plan a longer hold.
- Avery County population projected to shrink 10% by 2050 — rents likely to lag national; underwrite the cash flow, not the appreciation.
Negotiation context
- It's been on market 44 days — a 3% lower offer ($242k) is reasonable based on typical stale-listing flexibility.
- Current owner paid $170k; 47% above their basis — modest negotiation headroom, anchor on the comps not their cost.
Questions for the listing agent
- What do current leases actually rent for vs. the listed asking? Can we see a recent rent roll and the last 12 months of T-12 income?
- It's been on market 44 days. Have you received any prior offers? Is the seller open to a 10% concession, seller financing, or rate buy-down credit?
- What does the HOA fee cover, when was the last increase, and are there any pending special assessments or reserve-fund shortfalls?
- Is there a deadline driving the sale (1031 exchange, divorce, estate, relocation)? That informs how much negotiation room exists.
- The area grade is low — what's the realistic commute time and amenity access for the typical tenant pool here? Any planned neighborhood developments (good or bad) we should know about?
- What's the average days-on-market for RENTAL listings here right now (not sales)? A rising rental-DOM trend means longer vacancies and softer asking-rent achievability than the comps imply.
- What's the recent tenant-quality profile in this submarket — average credit score on applications, eviction rate, late-payment / NSF rate, and stable-employment percentage? A property-management company in the area should have these aggregated.
- How much new for-sale + rental construction is in the pipeline within 1–3 miles? Heavy new supply typically softens prices + rents 12–24 months out; constrained supply supports both.
Investment metrics
- 1% rule
- 0.90% ✗
- Cap rate
- 6.22%
- Cash-on-cash
- -0.27%
- DSCR
- 0.99
- GRM
- 9.3
CMA / ARV
- ARV (on-the-fly)
- $428,676
- Comps found
- 12
Show comp detail 12 sales within ~0.75 mi
| Address | Dist | Beds/Ba | Sqft | Sold | Price | $/sf | Match |
|---|---|---|---|---|---|---|---|
| 322 Trout Brook Loop | 0.22mi | 3/2.0 (-1) | 1,645 (-1%) | 11mo | $445,000 | $271 | 74 |
| 91 Thorn Wood Loop | 0.17mi | 3/3.0 (-1) | 1,679 (+1%) | 10mo | $462,000 | $275 | 73 |
| 200 Tamarack Rd | 0.10mi | 3/3.0 (-1) | 1,754 (+5%) | 8mo | $449,000 | $256 | 71 |
| 183 Rhododendron Loop | 0.17mi | 3/2.5 (-1) | 1,562 (-6%) | 7mo | $573,255 | $367 | 68 |
| 283 Spring Brook Rd | 0.46mi | 3/2.0 (-1) | 1,750 (+5%) | 9mo | $365,000 | $209 | 58 |
| 31 Larkspur Rd | 0.16mi | 3/2.0 (-1) | 1,896 (+14%) | 11mo | $569,500 | $300 | 56 |
| 114 Goldfinch Rd | 0.44mi | 3/3.0 (-1) | 1,797 (+8%) | 3mo | $450,000 | $250 | 56 |
| 69 Galax Loop | 0.63mi | 3/2.5 (-1) | 1,649 (-1%) | 17mo | $465,000 | $282 | 48 |
| 145 Teaberry Ln | 0.45mi | 3/2.0 (-1) | 1,476 (-12%) | 9mo | $295,000 | $200 | 47 |
| 45 Pine Ridge Loop | 0.29mi | 3/3.0 (-1) | 1,878 (+13%) | 12mo | $300,000 | $160 | 46 |
| 100 Harbor Ln | 0.74mi | 3/3.0 (-1) | 1,680 (+1%) | 11mo | $256,000 | $152 | 46 |
| 154 Ash Loop | 0.55mi | 3/2.5 (-1) | 1,890 (+13%) | 11mo | $485,000 | $257 | 36 |
Match score weights: distance 35% · size 25% · config 20% · recency 20%. Top-matched comps best support the ARV.
Projected returns pro-forma
-3.0% appreciation · 3.0% rent growth · sell at horizon
- IRR
- -16.7%
- Equity multiple
- 0.41×
- Total profit
- $-41,426
- Equity at exit
- $37,276
- IRR
- -8.5%
- Equity multiple
- 0.47×
- Total profit
- $-37,045
- Equity at exit
- $21,615
Cash invested: $70,000 (down + closing). Projections, not guarantees.
Landlord ↔ Tenant lean methodology
- Overall (STATE)
- 85 Strongly Landlord-Friendly
- State North Carolina
- 85 Strongly Landlord-Friendly · R+3
- County
- — inherits STATE
- City
- — inherits STATE
ZIP-level market 28657
- Home prices YoY
- -21.1%
- Active inventory
- 207
- Price-to-rent
- 9.3×
Monthly cashflow live
- Estimated rent
- $2,250 medium interval (Pro) →
- Mortgage (P&I)
- −$1,311
- Tax from tax record
- −$50 /mo · $598/yr
- Insurance
- −$104
- HOA
- −$328
- Vacancy / Maint / Mgmt
- −$472
- Net cashflow
- $-16
Break-even live
UW: 25.0% down · 7.5% · 30yr · 1.5% tax · 5.0% vac · 8.0% maint · 8.0% mgmt
Financing live
Cash to close
- Down payment
- $62,500
- Closing costs
- $7,500
- Reserves months
- —
- Total cash needed
- —
Loan-product check · same deal, 3 products live
Conventional
25% down · 7.5% · 30yr
- Down + closing
- —
- Monthly P&I
- —
- Monthly cashflow
- —
- DSCR
- —
- Eligible?
- —
Personal DTI + credit; lowest rate.
DSCR
20% down · 8.5% · 30yr
- Down + closing
- —
- Monthly P&I
- —
- Monthly cashflow
- —
- DSCR
- —
- Eligible?
- —
No personal income docs; deal must DSCR.
Hard money
10% down · 12.0% · 12mo
- Down + closing
- —
- Monthly P&I
- —
- Monthly cashflow
- —
- DSCR
- —
- Eligible?
- —
Short-term bridge; refi at stabilization.
Rent comps 1 comps
| Address | Beds | Baths | Sqft | Rent | $/sqft | DOM | Units | Dist |
|---|---|---|---|---|---|---|---|---|
| 825 Highland Hills Rd Newland, NC | 3.0 | 3.0 | 1750 | $2,250 | $1.29 | 13d | 1 | 0.93mi |
HOA detail
- Monthly dues
- $328 · $3,936/yr
Listing history 16 events
-
2026-06-18days on market $250,000 Active 44 DOM
-
2026-06-17days on market $250,000 Active 43 DOM
-
2026-06-16days on market $250,000 Active 42 DOM
-
2026-06-15days on market $250,000 Active 41 DOM
-
2026-06-13days on market $250,000 Active 39 DOM
-
2026-06-12days on market $250,000 Active 38 DOM
-
2026-06-09days on market $250,000 Active 35 DOM
-
2026-06-08days on market $250,000 Active 34 DOM
-
2026-06-07days on market $250,000 Active 33 DOM
-
2026-06-07days on market $250,000 Active 32 DOM
-
2026-06-04days on market $250,000 Active 29 DOM
-
2026-06-02days on market $250,000 Active 28 DOM
-
2026-06-01days on market $250,000 Active 27 DOM
-
2026-05-31days on market $250,000 Active 26 DOM
-
2026-05-05$250,000 Active
-
2008-02-04soldstatus $170,000
ⓘ Source: listings_history table (triggers on properties + properties_extension) + one-shot
backfill from property_details.listing_events for pre-trigger history.
Tax reassessment forecast NC · Resets to sale price
- Current annual tax
- $598 · $50/mo
- Projected year-2 tax
- $2,050 · $171/mo
- Expected delta
- +$1,452/yr (+$121/mo · 242.8%)
ⓘ Screening estimate from a state-policy table — verify with the county assessor before closing.
Climate risk First Street
- Flood 1/10 Low FEMA zone X (unshaded) · 0% chance over 30 yrs
- Wildfire 3/10 Moderate
- Heat 1/10 Low 7 d/yr ≥87°F today · 21 d/yr by 30 yrs out
- Wind 2/10 Low
- Air quality 3/10 Moderate 2 unhealthy d/yr today · 2 by 30 yrs out
Nearby sold comps map
Loading sold comps map…
Walkable amenities ~0.75 mi
Loading nearby amenities…
Taxation est. · year 1
- Rental income
- $27,000
- − Mortgage interest
- −$14,004
- − Property taxes
- −$598
- − Insurance
- −$1,250
- − Repairs & maintenance
- −$2,160
- − Management
- −$2,160
- − HOA
- −$3,936
- − Depreciation
- −$7,273
- Taxable loss
- −$4,381
- Est. tax savings @ 24.0%
- +$1,051
- After-tax cash flow
- $865/yr
For passive investors: Depreciation is non-cash, so a rental often shows a tax loss while cash-flowing — sheltering income. Rental losses are passive: they offset passive income freely, and up to $25,000/yr can offset ordinary (W-2) income if you actively participate and your MAGI is under $100k (phasing out to $0 by $150k); unused losses carry forward. On sale, claimed depreciation is recaptured at up to 25%, and gains may owe capital-gains tax (a 1031 exchange can defer both). Figures are a year-1 estimate at your 24.0% rate — not tax advice; consult a CPA.
Schools (NCES district)
- District
- Avery County Schools
- NCES district ID
- 3700300
- Math proficiency
- 47% ▼ -2.00%
- Reading proficiency
- 52% ▲ 1.00%
- Median HH income
- $36,713
- Composite
- 41.09/100
- National rank
- #3571
- State rank
- #70 of 178 in NC
Livability — Linville
No livability data for this city. (Only ~50 U.S. cities are tracked.)
Census & demographics
- Population (ZIP)
- 8,098
Population outlook (Avery County) Hauer SSP2
- Today (2025)
- 17,283 people
- By 2030
- 16,979 · -1.8%
- By 2040
- 16,222 · -6.1%
- By 2050
- 15,581 · -9.8%
- By 2075
- 14,499 · -16.1%
- By 2100
- 13,463 · -22.1%
Race, ethnicity, and origin ACS 2023
- Neighborhood character
- Predominantly White (95%)
- Race & ethnicity
- White 95% Hispanic / Latino 4% Two or more races 2%
- Common ancestry
- Serbian 13% Slovak 7% Lithuanian 2%
- Foreign-born
- 2% · Canada
- Languages at home
- 98% English-only · Spanish 2%
Political lean MEDSL · Avery
- 2024 margin
- Solid R (+52.4) · D 23.4% · R 75.8%
- 2008→2024 swing
- -8.3pp toward R · 2008: -44.1pp · 2024: -52.4pp
- All cycles
- 2024: R+52.4 2020: R+52.7 2016: R+56.5 2012: R+50.2 2008: R+44.1
Not yet ingested
- Civics
- —
Market trends
- HPI YoY
- ▼ -57.50%
- Current HPI
- 214.8543
- Rent YoY
- —
- Metro
- —
- State GDP YoY
- ▲ 3.28%
- F500 in state
- 26
Industry mix (Fortune 500 HQ in NC)
| Industry | F500 HQs | Revenue |
|---|---|---|
| Financial Services | 2 | $213B |
|
||
| Retail | 2 | $95B |
|
||
| Industrial Conglomerate | 1 | $38B |
|
||
| Metals / Steel | 1 | $35B |
|
||
| Utilities | 1 | $30B |
|
||
| Industrial Machinery | 1 | $19B |
|
||
Price history
+47.1% since first listed2 events — show timeline
- 2026-05-05 Listed $250,000 CANOPYMLS as Distributed by MLS Grid
- 2008-02-04 Sold (Public Records) $170,000 Public Records
Property tax history
-1.0%/yrLatest (2025): $598 · +0.0% YoY. Source: county tax records.
Cash-flow waterfall
monthlySold comps — $/sqft
last 12 mo · ≤1 miLoading sold comps…