 🌊 Lakefront
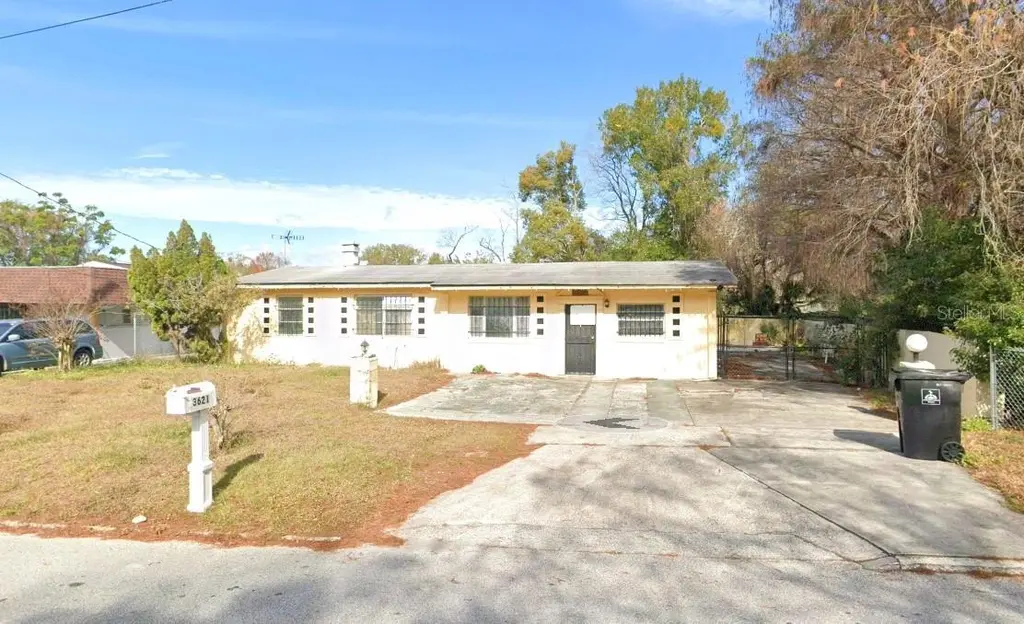
3621 Wilts St · Orlando, FL
Flood risk 1/10 · Minimal
- FEMA flood zone
- X (unshaded)
- Chance of flooding over 30 yrs
- 0.0%
- Est. flood insurance / yr
- $507 – $1,088
Fire risk 1/10 · Minimal
- Est. fire insurance / yr
- $947 – $1,759
Heat risk 8/10 · Major
- Hot days now (above 108°F)
- 7 days/yr
- Hot days in 30 yrs
- 23 days/yr
Wind risk 9/10 · Severe
- Chance of severe wind over 30 yrs
- 99.0%
Air-quality risk 1/10 · Minimal
- Unhealthy air days now
- 0 days/yr
- Unhealthy air days in 30 yrs
- 0 days/yr
Risk factors via First Street. Map © Google.
Why this score? — see what drove the C grade
The composite is a weighted blend of 9 inputs, each scored 0–100. Each bar is that input's sub-score; the figure is the points it added to the 100-point composite (weight × sub-score).
- Cash flow +23.2/30.0
- DSCR +7.5/10.0
- ARV discount +7.5/15.0
- 1% rule +4.7/10.0
- Livability +4.3/5.0
- Schools +4.1/10.0
- Rent growth +2.9/5.0
- Condition / age +2.5/5.0
- Appreciation +0.0/10.0
$199,999
🖨 Deal sheet (PDF) 📄 Offer letter ✓ Due diligence
Listing remarks
One or more photo(s) has been virtually staged. Seller reserves the right to accept an offer prior to the deadline. This is an INCREDIBLE OPPORTUNITY priced aggressively in the rapidly evolving Washington Shores area of Orlando, where continued redevelopment and strong demand are driving increasing investor activity and neighborhood improvement. Situated just minutes from Downtown Orlando, this property offers exceptional upside in a location that continues to benefit from expansion, revitalization, and proximity to major employment hubs. Positioned on an oversized lot just under half an acre, the property features a spacious setting with mature trees, a fenced yard, and additional structu
Key facts
- Established area
- Value-add potential
- Large lot
Tags
Property features AI
Finance
- Other: Zoning: R-1A
- Financial info: Property is homesteaded; No lease restrictions reported
- HOA & community: No HOA; Community features include street lights; Pets allowed
Exterior
- Parking: No parking information provided
- Security: Smoke detector(s)
- Utilities: Public water; Public sewer; Electricity connected; Water connected; Sewer connected
- Home design: Single-family residence; Residential property; Fixer condition; One story; South facing; Slab foundation
- Construction: Block and concrete construction; Shingle roof; Built on slab foundation; Approximate building area 1,614 (from public records)
- Exterior features: Front porch; Rear porch; Private mailbox; Sliding doors; Chain link and wood fencing; Shed(s); Trees and landscaping; City limits lot, level, with sidewalk and paved access; Public maintained paved road
Interior
- Kitchen: Range; Refrigerator
- Bedrooms: 3 bedrooms
- Flooring: Carpet; Ceramic tile
- Bathrooms: 1 full bathroom; 1 half bathroom
- Heating & cooling: Central heating (electric); Central air conditioning
- Interior features: No additional interior features listed; Formal dining room separate; Formal living room separate
- Laundry & utility: Laundry located inside
Neighborhood map
What this means for you Summary
Snapshot
- This is a 3-bed/2.0-bath single-family listed at $200k.
Deal economics
- At list price, monthly cash flow is $364 ($4k/yr) — positive.
- The deal already cash-flows at list — no discount required.
- To meet the 1% rule (rent ≥ 1% of price), the offer needs to be $194k (2.9% below list).
- Recommended offer: $194k (3.0% below list) — sets the bar for market timing.
- Cap rate 8.5% vs local median 3.0% in Orlando — top-decile yield for the area; either an underpriced asset or a hidden risk that comps aren't pricing in. Stress-test before assuming the spread holds.
Location & tenants
- Location reads 86/100 on livability (#12 in FL, #360 nationally) — a professional / high-income tenant draw. Strengths: amenities A+, commute A+, housing A+.
- Orange (suburban): math 46% / reading 51% proficiency, ranked #43 of 73 in FL (top 59%) — families likely to look elsewhere, expect single-tenant / working-renter base with shorter leases.
- Zoned schools: Washington Shores Elementary (math 27% / reading 27%, grade F, #1,969 of 2,144 statewide, top 94%, 329 students, 88% FRL); Carver Middle (math 29% / reading 27%, grade F, #486 of 571 statewide, top 86%, 721 students, 79% FRL); Jones High (math 9% / reading 25%, grade F, #597 of 667 statewide, top 90%, 1,672 students, 75% FRL) — zoned schools average 81% FRL vs 56% district-wide (24 pts higher); higher-poverty schools than district average — tighter screening recommended.
- Zoned-school proficiency averages 24% at this address vs 48% district-wide (-24 pts) — the specific schools serving this property underperform the Orange average; the district grade overstates school quality for this exact location.
- Market conditions: Rents rising (+1.4%/yr); 142 active listings in the ZIP; 22 comparable units currently listed for rent nearby; rentals at typical pace (median 26d on market — plan ~3-4 weeks tenant-placement turnaround); lower-income renter base — watch delinquency; 8,053 units permitted in Orange County in 2024 (3,133 in 5+ unit buildings).
- At $1,943/mo this rent would consume 58% of the median local household income ($41k/yr) (locally 1597% of renters already pay >50% of income on rent) — very limited rent-growth headroom before tenants either downsize or default.
Forward outlook
- Local home prices are declining (-3.0%/yr); year-one equity from $1k of loan paydown is wiped out by about $6k of value loss. Plan a longer hold.
- Orange County population projected at +52% by 2050 — long-run rental-demand tailwind backs the buy-and-hold thesis.
Negotiation context
- It's been on market 58 days — a 3% lower offer ($194k) is reasonable based on typical stale-listing flexibility.
Risks & watch-outs
- Watch-outs: built in 1956 — expect roof / HVAC / electrical / plumbing capex.
- Climate carrying-cost: severe wind risk, 99% chance of damaging wind over 30y; extreme-heat days projected 7→23/yr by 2055 (HVAC capex compounding) — expect insurance premiums to compound above CPI over the hold.
Questions for the listing agent
- It's been on market 58 days. Have you received any prior offers? Is the seller open to a 3% concession, seller financing, or rate buy-down credit?
- Built in 1956 — when were the roof, HVAC, electrical panel, plumbing, and water heater last replaced?
- Is there a deadline driving the sale (1031 exchange, divorce, estate, relocation)? That informs how much negotiation room exists.
- Schools are B-rated — typically a magnet for longer-tenancy family renters. What's the average tenant stay here, and is there a school-zone premium baked into asking?
- This sits on a lake — are riparian / water-frontage rights deeded with the parcel? Any dock permits, shoreline easements, or HOA water-use restrictions?
- What's the documented flood / surge / shoreline-erosion history here (FEMA AND non-FEMA — e.g., storm surge, creek backup, septic-field saturation)?
- Any water-quality or seasonal algae-bloom issues that affect tenant satisfaction or short-term-rental demand?
- What's the average days-on-market for RENTAL listings here right now (not sales)? A rising rental-DOM trend means longer vacancies and softer asking-rent achievability than the comps imply.
- What's the recent tenant-quality profile in this submarket — average credit score on applications, eviction rate, late-payment / NSF rate, and stable-employment percentage? A property-management company in the area should have these aggregated.
- How much new for-sale + rental construction is in the pipeline within 1–3 miles? Heavy new supply typically softens prices + rents 12–24 months out; constrained supply supports both.
Investment metrics
- 1% rule
- 0.97% ✗
- Cap rate
- 8.48%
- Cash-on-cash
- 7.80%
- DSCR
- 1.35
- GRM
- 8.6
CMA / ARV
- ARV (on-the-fly)
- $416,170
- Comps found
- 4
Show comp detail 4 sales within ~0.75 mi
| Address | Dist | Beds/Ba | Sqft | Sold | Price | $/sf | Match |
|---|---|---|---|---|---|---|---|
| 1000 S Goldwyn Ave | 0.43mi | 3/2.5 | 1,624 (+1%) | 20mo | $310,000 | $191 | 61 |
| 821 Bethune Dr | 0.51mi | 3/2.0 | 1,642 (+2%) | 21mo | $273,000 | $166 | 56 |
| 3805 Roseboro St | 0.50mi | 3/2.0 | 1,579 (-2%) | 22mo | $353,900 | $224 | 55 |
| 921 Saint George St | 0.42mi | 4/2.0 (+1) | 1,804 (+12%) | 20mo | $259,000 | $144 | 39 |
Match score weights: distance 35% · size 25% · config 20% · recency 20%. Top-matched comps best support the ARV.
Projected returns pro-forma
-3.0% appreciation · 1.42% rent growth · sell at horizon
- IRR
- -6.0%
- Equity multiple
- 0.78×
- Total profit
- $-12,377
- Equity at exit
- $29,821
- IRR
- 1.8%
- Equity multiple
- 1.12×
- Total profit
- $6,564
- Equity at exit
- $17,292
Cash invested: $56,000 (down + closing). Projections, not guarantees.
Landlord ↔ Tenant lean methodology
- Overall (STATE)
- 87 Strongly Landlord-Friendly
- State Florida
- 87 Strongly Landlord-Friendly · R+3
- County
- — inherits STATE
- City
- — inherits STATE
ZIP-level market 32805
- Home prices YoY
- -7.6%
- Rents YoY
- 1.4%
- Active inventory
- 142
- Price-to-rent
- 8.6×
Monthly cashflow live
- Estimated rent
- $1,943 high interval (Pro) →
- Mortgage (P&I)
- −$1,049
- Tax from tax record
- −$39 /mo · $468/yr
- Insurance
- −$83
- HOA
- −$0
- Vacancy / Maint / Mgmt
- −$408
- Net cashflow
- $364
Break-even live
Sensitivity live
| Price | -10% $477 | -5% $420 | +0% $364 | +5% $307 | +10% $251 |
|---|---|---|---|---|---|
| Rent | -10% $210 | -5% $287 | +0% $364 | +5% $441 | +10% $517 |
| Rate | -1.0pp $465 | -0.5pp $415 | base $364 | +0.5pp $312 | +1.0pp $259 |
UW: 25.0% down · 7.5% · 30yr · 1.5% tax · 5.0% vac · 8.0% maint · 8.0% mgmt
Financing live
Cash to close
- Down payment
- $50,000
- Closing costs
- $6,000
- Reserves months
- —
- Total cash needed
- —
Loan-product check · same deal, 3 products live
Conventional
25% down · 7.5% · 30yr
- Down + closing
- —
- Monthly P&I
- —
- Monthly cashflow
- —
- DSCR
- —
- Eligible?
- —
Personal DTI + credit; lowest rate.
DSCR
20% down · 8.5% · 30yr
- Down + closing
- —
- Monthly P&I
- —
- Monthly cashflow
- —
- DSCR
- —
- Eligible?
- —
No personal income docs; deal must DSCR.
Hard money
10% down · 12.0% · 12mo
- Down + closing
- —
- Monthly P&I
- —
- Monthly cashflow
- —
- DSCR
- —
- Eligible?
- —
Short-term bridge; refi at stabilization.
Rent comps 22 comps
| Address | Beds | Baths | Sqft | Rent | $/sqft | DOM | Units | Dist |
|---|---|---|---|---|---|---|---|---|
| 3950 Columbia St Orlando, FL | 1.0–2.0 | 1.0–2.0 | 875 | $1,416 | $1.62 | 25d | 1 | 0.24mi |
| 4118 Minoso St Orlando, FL | 3.0 | 1.0 | 1213 | $1,820 | $1.50 | 0d | 1 | 0.42mi |
| 1661 Gammon Ln Unit 1 Orlando, FL | 4.0 | 3.0 | 1511 | $2,500 | $1.65 | 25d | 1 | 0.48mi |
| 4201 Cepeda St Orlando, FL | 4.0 | 2.0 | 1500 | $1,800 | $1.20 | 25d | 1 | 0.51mi |
| 1822 Horne Ave Orlando, FL | 3.0 | 1.0 | 1249 | $1,600 | $1.28 | 25d | 1 | 0.58mi |
| 2151 S Ivey Ln Orlando, FL | 3.0 | 1.5 | 1080 | $1,993 | $1.85 | 6d | 1 | 0.85mi |
| 2419 Orange Center Blvd Orlando, FL | 3.0 | 2.0 | 1526 | $2,600 | $1.70 | 25d | 1 | 0.87mi |
| 4487 Wheatley St Orlando, FL | 4.0 | 2.0 | 1249 | $1,950 | $1.56 | 22d | 1 | 0.89mi |
| 4226 Kelly Miller Ct Orlando, FL | 3.0 | 1.0 | 1126 | $1,950 | $1.73 | 25d | 1 | 0.95mi |
| 2805 Gulfstream Ct Orlando, FL | 3.0 | 2.0 | 1574 | $2,375 | $1.51 | 16d | 1 | 0.97mi |
| 1920 Willie Mays Pkwy Orlando, FL | 4.0 | 2.0 | 1446 | $2,070 | $1.43 | 21d | 1 | 1.04mi |
| 4529 W Gore Ave Orlando, FL | 3.0 | 2.0 | 1439 | $2,549 | $1.77 | 21d | 1 | 1.05mi |
| 4655 Cepeda St Orlando, FL | 3.0 | 1.5 | 1266 | $1,695 | $1.34 | 25d | 1 | 1.08mi |
| 2751 L B McLeod Rd Unit 2751-A Orlando, FL | 3.0 | 2.0 | 1338 | $1,600 | $1.20 | 19d | 1 | 1.12mi |
| 2314 W South St Orlando, FL | 3.0 | 2.0 | 1440 | $2,000 | $1.39 | 16d | 1 | 1.16mi |
| 414 Sunset Dr Orlando, FL | 3.0 | 1.0 | 1268 | $1,850 | $1.46 | 25d | 1 | 1.23mi |
| 431 Gilman Cir Orlando, FL | 3.0 | 2.0 | 1146 | $1,626 | $1.42 | 15d | 1 | 1.25mi |
| 97 N Goldwyn Ave Orlando, FL | 3.0 | 2.0 | 1531 | $2,400 | $1.57 | 25d | 1 | 1.28mi |
| 1907 S Rio Grande Ave Orlando, FL | 3.0 | 2.0 | 1130 | $1,600 | $1.42 | 25d | 1 | 1.29mi |
| 1401 19th St Orlando, FL | 3.0 | 1.0 | 1100 | $1,800 | $1.64 | 25d | 1 | 1.37mi |
| 1816 Rendale Dr Orlando, FL | 3.0 | 2.0 | 1616 | $2,300 | $1.42 | 19d | 1 | 1.42mi |
| 1343 Croyle Dr Orlando, FL | 4.0 | 2.0 | 1273 | $1,900 | $1.49 | 25d | 1 | 1.43mi |
Listing history 19 events
-
2026-06-21days on market $199,999 Active 58 DOM
-
2026-06-18days on market $199,999 Active 55 DOM
-
2026-06-17days on market $199,999 Active 54 DOM
-
2026-06-16days on market $199,999 Active 53 DOM
-
2026-06-15days on market $199,999 Active 52 DOM
-
2026-06-13days on market $199,999 Active 50 DOM
-
2026-06-13days on market $199,999 Active 49 DOM
-
2026-06-09days on market $199,999 Active 46 DOM
-
2026-06-08days on market $199,999 Active 45 DOM
-
2026-06-07days on market $199,999 Active 44 DOM
-
2026-06-04days on market $199,999 Active 41 DOM
-
2026-06-03days on market $199,999 Active 40 DOM
-
2026-06-02days on market $199,999 Active 39 DOM
-
2026-06-02days on market $199,999 Active 38 DOM
-
2026-05-31days on market $199,999 Active 37 DOM
-
2026-05-20price $199,999
-
2026-05-12price $220,000
-
2026-05-06price $239,999
-
2026-04-24$240,000 Active
ⓘ Source: listings_history table (triggers on properties + properties_extension) + one-shot
backfill from property_details.listing_events for pre-trigger history.
Tax reassessment forecast FL · Resets to sale price
- Current annual tax
- $468 · $39/mo
- Projected year-2 tax
- $1,660 · $138/mo
- Expected delta
- +$1,192/yr (+$99/mo · 255.0%)
ⓘ Screening estimate from a state-policy table — verify with the county assessor before closing.
Climate risk First Street
- Flood 1/10 Low FEMA zone X (unshaded) · 0% chance over 30 yrs
- Wildfire 1/10 Low
- Heat 8/10 Severe 7 d/yr ≥108°F today · 23 d/yr by 30 yrs out
- Wind 9/10 Extreme 99% chance of damaging wind over 30 yrs
- Air quality 1/10 Low 0 unhealthy d/yr today · 0 by 30 yrs out
Nearby sold comps map
Loading sold comps map…
Walkable amenities ~0.75 mi
Loading nearby amenities…
Taxation est. · year 1
- Rental income
- $23,316
- − Mortgage interest
- −$11,203
- − Property taxes
- −$468
- − Insurance
- −$1,000
- − Repairs & maintenance
- −$1,865
- − Management
- −$1,865
- − Depreciation
- −$5,818
- Taxable income
- $1,096
- Est. tax owed @ 24.0%
- −$263
- After-tax cash flow
- $4,103/yr
For passive investors: Depreciation is non-cash, so a rental often shows a tax loss while cash-flowing — sheltering income. Rental losses are passive: they offset passive income freely, and up to $25,000/yr can offset ordinary (W-2) income if you actively participate and your MAGI is under $100k (phasing out to $0 by $150k); unused losses carry forward. On sale, claimed depreciation is recaptured at up to 25%, and gains may owe capital-gains tax (a 1031 exchange can defer both). Figures are a year-1 estimate at your 24.0% rate — not tax advice; consult a CPA.
Schools (NCES district)
- District
- Orange
- NCES district ID
- 1201440
- Math proficiency
- 46% ▼ -9.00%
- Reading proficiency
- 51% ▼ -2.00%
- Median HH income
- $49,350
- Composite
- 41.47/100
- National rank
- #3461
- State rank
- #43 of 73 in FL
Livability — Orlando
- Score
- 86/100
- State rank
- #12
- US rank
- #360
Category grades
Schools grade is shown separately in the Schools card above.
Census & demographics
- Census place
- Orlando, FL
- County
- Orange County · 1,471,359 people
- City population
- 964,969
- Metro
- Orlando-Kissimmee-Sanford, FL
- Population (ZIP)
- 19,294
- Household income
- $40,515
- Rent vs Own
- Severe rent burden
- 1597.0
Population outlook (Orange County) Hauer SSP2
- Today (2025)
- 1,618,226 people
- By 2030
- 1,787,404 · +10.5%
- By 2040
- 2,125,621 · +31.4%
- By 2050
- 2,454,016 · +51.6%
- By 2075
- 3,173,711 · +96.1%
- By 2100
- 3,607,781 · +122.9%
Race, ethnicity, and origin ACS 2023
- Neighborhood character
- Predominantly Black (70%)
- Race & ethnicity
- Black 70% Hispanic / Latino 15% White 13% Two or more races 8%
- Hispanic origin (detail)
- Mexican 3% Puerto Rican 4% Cuban 1% Dominican 3%
- Common ancestry
- Hispanic 9% Russian 1%
- Foreign-born
- 16% · Canada, Jamaica
- Languages at home
- 80% English-only · Spanish 11% French/Haitian/Cajun 8%
Political lean MEDSL · Orange
- 2024 margin
- D (+13.6) · D 56.1% · R 42.5% · Other 1.3%
- 2008→2024 swing
- -5.0pp toward R · 2008: 18.6pp · 2024: 13.6pp
- All cycles
- 2024: D+13.6 2020: D+23.1 2016: D+24.6 2012: D+18.2 2008: D+18.6
Not yet ingested
- Civics
- —
Market trends
- HPI YoY
- ▼ -35.19%
- Current HPI
- 429.3242
- Rent YoY
- ▲ 1.42%
- Metro
- Orlando-Kissimmee-Sanford, FL
- State GDP YoY
- ▲ 3.28%
- F500 in state
- 36
Industry mix (Fortune 500 HQ in FL)
| Industry | F500 HQs | Revenue |
|---|---|---|
| Industrial Technology | 2 | $29B |
|
||
| Insurance | 2 | $17B |
|
||
| Retail | 1 | $60B |
|
||
| Technology Distribution | 1 | $58B |
|
||
| Homebuilding | 1 | $35B |
|
||
| Technology Manufacturing | 1 | $35B |
|
||
Price history
-16.7% since first listed4 events — show timeline
- 2026-05-20 Price Changed $199,999 Stellar MLS as Distributed by MLS Grid
- 2026-05-12 Price Changed $220,000 Stellar MLS as Distributed by MLS Grid
- 2026-05-06 Price Changed $239,999 Stellar MLS as Distributed by MLS Grid
- 2026-04-24 Listed $240,000 Stellar MLS as Distributed by MLS Grid
Property tax history
+4.9%/yrLatest (2025): $468 · +17.4% YoY. Source: county tax records.
Cash-flow waterfall
monthlySold comps — $/sqft
last 12 mo · ≤1 miLoading sold comps…