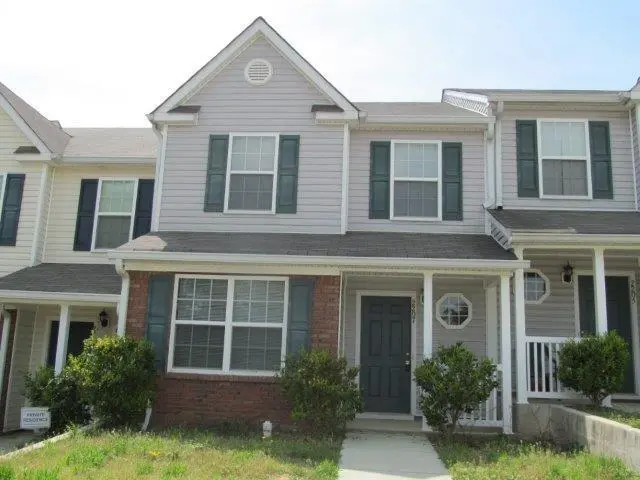
2207 Miranda Dr · Forest Park, GA
Flood risk 1/10 · Minimal
- FEMA flood zone
- X (unshaded)
- Chance of flooding over 30 yrs
- 0.0%
- Est. flood insurance / yr
- $507 – $1,088
Fire risk 1/10 · Minimal
- Est. fire insurance / yr
- $963 – $1,789
Heat risk 6/10 · Moderate
- Hot days now (above 105°F)
- 7 days/yr
- Hot days in 30 yrs
- 18 days/yr
Wind risk 6/10 · Moderate
- Chance of severe wind over 30 yrs
- 27.0%
Air-quality risk 4/10 · Minor
- Unhealthy air days now
- 4 days/yr
- Unhealthy air days in 30 yrs
- 6 days/yr
Risk factors via First Street. Map © Google.
Why this score? — see what drove the C- grade
The composite is a weighted blend of 9 inputs, each scored 0–100. Each bar is that input's sub-score; the figure is the points it added to the 100-point composite (weight × sub-score).
- Cash flow +19.5/30.0
- ARV discount +14.0/15.0
- DSCR +6.2/10.0
- 1% rule +5.3/10.0
- Livability +3.2/5.0
- Condition / age +2.5/5.0
- Rent growth +2.2/5.0
- Schools +1.3/10.0
- Appreciation +0.0/10.0
$209,000
🖨 Deal sheet 📄 Offer letter ✓ Due diligence
Listing remarks MLS
Nice spacious townhome close to everything! Main floor has a bedroom with a full bathroom. Open concept to view kitchen, Livingroom with dining area. Upstairs has 2 spare bedrooms another full bathroom. Master has private bathroom and walk in closest. This home will go conventional, FHA, Cash, VA! Clean and well kept!
Key facts
- $40 HOA
- Built 2006
- Listed 146 days
Neighborhood map
What this means for you Summary
Snapshot
- This is a 4-bed/3.0-bath townhouse listed at $209k.
Deal economics
- At list price, monthly cash flow is $236 ($3k/yr) — positive.
- The deal already cash-flows at list — no discount required.
- Meets the 1% rule at list price ($2k rent vs $209k).
- Recommended offer: $184k (12.0% below list) — sets the bar for market timing.
- Cap rate 7.7% vs local median 5.2% in Forest Park — top-decile yield for the area; either an underpriced asset or a hidden risk that comps aren't pricing in. Stress-test before assuming the spread holds.
Location & tenants
- Location reads 65/100 on livability (#209 in GA) — a middle-class / working-renter tenant base. Strengths: cost of living A+, housing A+, health & safety A-; Watch: schools F, crime F, commute F.
- Clayton County (suburban): math 11% / reading 20% proficiency, ranked #155 of 174 in GA (top 89%) — low school quality limits family demand, transient renter base, plan for 1-2y turnover; 78% free/reduced lunch — lower-income household profile, screen leases tightly.
- Market conditions: Rents soft (-1.0%/yr); 166 active listings in the ZIP; 17 comparable units currently listed for rent nearby; rentals at typical pace (median 17d on market — plan ~3-4 weeks tenant-placement turnaround); 41% of comp listings sitting > 30 days — soft ceiling on asking rent; 865 units permitted in Clayton County in 2024 (448 in 5+ unit buildings).
- At $2,152/mo this rent would consume 49% of the median local household income ($53k/yr) (locally 1956% of renters already pay >50% of income on rent) — very limited rent-growth headroom before tenants either downsize or default.
Forward outlook
- Local home prices are declining (-3.0%/yr); year-one equity from $1k of loan paydown is wiped out by about $6k of value loss. Plan a longer hold.
- Clayton County population projected at +29% by 2050 — long-run rental-demand tailwind backs the buy-and-hold thesis.
Negotiation context
- It's been on market 146 days — a 12% lower offer ($184k) is reasonable based on typical stale-listing flexibility.
- 3 sale attempts since 15y ago with the ask held roughly flat each time — persistent listings suggest the price (not the market) is what's stuck; bring a comps-based counter.
- Current owner paid $35k; list at $209k implies a 494% gain — meaningful room to come down on a strong offer.
Risks & watch-outs
- Climate carrying-cost: major wind risk, 27% chance of damaging wind over 30y; extreme-heat days projected 7→18/yr by 2055 (HVAC capex compounding) — expect insurance premiums to compound above CPI over the hold.
Questions for the listing agent
- It's been on market 146 days. Have you received any prior offers? Is the seller open to a 12% concession, seller financing, or rate buy-down credit?
- What does the HOA fee cover, when was the last increase, and are there any pending special assessments or reserve-fund shortfalls?
- Why hasn't it sold? Are there any deal-killer items the seller is aware of (foundation, flood, title, zoning, code violations)?
- Is there a deadline driving the sale (1031 exchange, divorce, estate, relocation)? That informs how much negotiation room exists.
- Schools are F-rated, which usually means shorter tenancies and higher turnover. Who's the typical renter profile here, and what's been the actual vacancy rate?
- Crime grade is F in this area — have there been break-ins, vandalism, or insurance claims at this property in the last 3 years? What carrier currently insures it and at what premium?
- What's the average days-on-market for RENTAL listings here right now (not sales)? A rising rental-DOM trend means longer vacancies and softer asking-rent achievability than the comps imply.
- What's the recent tenant-quality profile in this submarket — average credit score on applications, eviction rate, late-payment / NSF rate, and stable-employment percentage? A property-management company in the area should have these aggregated.
- How much new for-sale + rental construction is in the pipeline within 1–3 miles? Heavy new supply typically softens prices + rents 12–24 months out; constrained supply supports both.
Investment metrics
- 1% rule
- 1.03% ✓
- Cap rate
- 7.65%
- Cash-on-cash
- 4.85%
- DSCR
- 1.22
- GRM
- 8.1
CMA / ARV
- ARV (median comp)
- $244,438
- List price
- $209,000
- Delta
- -14.50%
- Verdict
- UNDERPRICED
- Comps
- 20 within 1.0 mi
Show comp detail 4 sales within ~0.75 mi
| Address | Dist | Beds/Ba | Sqft | Sold | Price | $/sf | Match |
|---|---|---|---|---|---|---|---|
| 5339 Creekview Ln | 0.15mi | 4/3.0 | 1,836 (-7%) | 1mo | $210,000 | $114 | 80 |
| 5254 Carrie Dr | 0.06mi | 3/2.5 (-1) | 1,800 (-9%) | 8mo | $249,000 | $138 | 68 |
| 5217 Carrie Dr | 0.13mi | 4/2.5 | 1,800 (-9%) | 21mo | $240,000 | $133 | 60 |
| 5354 Creekview Way | 0.14mi | 3/2.5 (-1) | 1,812 (-8%) | 19mo | $235,000 | $130 | 58 |
Match score weights: distance 35% · size 25% · config 20% · recency 20%. Top-matched comps best support the ARV.
Projected returns pro-forma
-3.0% appreciation · 0.0% rent growth · sell at horizon
- IRR
- -12.2%
- Equity multiple
- 0.57×
- Total profit
- $-25,075
- Equity at exit
- $31,163
- IRR
- -8.4%
- Equity multiple
- 0.54×
- Total profit
- $-26,644
- Equity at exit
- $18,071
Cash invested: $58,520 (down + closing). Projections, not guarantees.
Landlord ↔ Tenant lean methodology
- Overall (STATE)
- 90 Strongly Landlord-Friendly
- State Georgia
- 90 Strongly Landlord-Friendly · R+3
- County
- — inherits STATE
- City
- — inherits STATE
ZIP-level market 30260
- Home prices YoY
- -33.8%
- Rents YoY
- -1.0%
- Active inventory
- 166
- Price-to-rent
- 8.1×
Monthly cashflow live
- Estimated rent
- $2,152 high interval (Pro) →
- Mortgage (P&I)
- −$1,096
- Tax from tax record
- −$241 /mo · $2,890/yr
- Insurance
- −$87
- HOA
- −$40
- Vacancy / Maint / Mgmt
- −$452
- Net cashflow
- $236
Break-even live
UW: 25.0% down · 7.5% · 30yr · 1.5% tax · 5.0% vac · 8.0% maint · 8.0% mgmt
Financing live
Cash to close
- Down payment
- $52,250
- Closing costs
- $6,270
- Reserves months
- —
- Total cash needed
- —
Loan-product check · same deal, 3 products live
Conventional
25% down · 7.5% · 30yr
- Down + closing
- —
- Monthly P&I
- —
- Monthly cashflow
- —
- DSCR
- —
- Eligible?
- —
Personal DTI + credit; lowest rate.
DSCR
20% down · 8.5% · 30yr
- Down + closing
- —
- Monthly P&I
- —
- Monthly cashflow
- —
- DSCR
- —
- Eligible?
- —
No personal income docs; deal must DSCR.
Hard money
10% down · 12.0% · 12mo
- Down + closing
- —
- Monthly P&I
- —
- Monthly cashflow
- —
- DSCR
- —
- Eligible?
- —
Short-term bridge; refi at stabilization.
Rent comps 17 comps
| Address | Beds | Baths | Sqft | Rent | $/sqft | DOM | Units | Dist |
|---|---|---|---|---|---|---|---|---|
| 2271 Wentworth Park Dr Ellenwood, GA | 4.0 | 2.5 | 1705 | $2,119 | $1.24 | 16d | 1 | 0.07mi |
| 2314 Shady Dr Morrow, GA | 4.0 | 2.5 | 1705 | $2,179 | $1.28 | 11d | 1 | 0.25mi |
| 2401 Bethune Cir Morrow, GA | 3.0 | 2.5 | 1696 | $2,095 | $1.24 | 5d | 1 | 0.71mi |
| 4974 Summersun Dr Morrow, GA | 4.0 | 2.0 | 1935 | $2,370 | $1.22 | 1d | 1 | 0.72mi |
| 2260 Hammond Ct Ellenwood, GA | 3.0 | 2.0 | 1248 | $1,850 | $1.48 | 43d | 1 | 0.81mi |
| 5720 Buck Ct Ellenwood, GA | 3.0 | 2.0 | 1232 | $1,850 | $1.50 | 24d | 1 | 0.87mi |
| 5731 Buck Ct Ellenwood, GA | 3.0 | 2.0 | 1242 | $1,525 | $1.23 | 12d | 1 | 0.88mi |
| 2603 Old Rex Morrow Rd Ellenwood, GA | 4.0 | 3.0 | 1800 | $2,510 | $1.39 | 44d | 1 | 0.99mi |
| 5704 Wesson Dr Ellenwood, GA | 3.0 | 2.0 | 1480 | $1,710 | $1.16 | 43d | 1 | 1.00mi |
| 2617 Old Rex Morrow Rd Ellenwood, GA | 4.0 | 3.0 | 1800 | $1,950 | $1.08 | 12d | 1 | 1.02mi |
| 5789 Colt Ct Ellenwood, GA | 4.0 | 3.0 | 1877 | $2,020 | $1.08 | 43d | 1 | 1.17mi |
| 5762 Northspring Dr Ellenwood, GA | 3.0 | 2.0 | 1577 | $1,705 | $1.08 | 12d | 1 | 1.20mi |
| 2655 Old Toney Rd Ellenwood, GA | 3.0 | 1.5 | 1300 | $1,450 | $1.12 | 43d | 1 | 1.21mi |
| 2710 Luke Dr Ellenwood, GA | 4.0 | 3.0 | 2213 | $2,435 | $1.10 | 43d | 1 | 1.22mi |
| 5868 Dan Dr Ellenwood, GA | 3.0 | 2.0 | 1854 | $2,300 | $1.24 | 43d | 1 | 1.29mi |
| 2445 Rex Rd Ellenwood, GA | 1.0–3.0 | 1.0–2.0 | 1149 | $1,569 | $1.37 | 1d | 12 | 1.30mi |
| 6010 Fairfield Dr Morrow, GA | 3.0 | 1.5 | 1246 | $1,841 | $1.48 | 2d | 1 | 1.42mi |
HOA detail
- Monthly dues
- $40 · $480/yr
Listing history 12 events
-
2026-05-31days on market $209,000 Active 146 DOM
-
2026-02-18price $209,000 319-char remark
Show marketing remark (319 chars)
Nice spacious townhome close to everything! Main floor has a bedroom with a full bathroom. Open concept to view kitchen, Livingroom with dining area. Upstairs has 2 spare bedrooms another full bathroom. Master has private bathroom and walk in closest. This home will go conventional, FHA, Cash, VA! Clean and well kept!
-
2026-02-13price $209,000 319-char remark
Show marketing remark (319 chars)
Nice spacious townhome close to everything! Main floor has a bedroom with a full bathroom. Open concept to view kitchen, Livingroom with dining area. Upstairs has 2 spare bedrooms another full bathroom. Master has private bathroom and walk in closest. This home will go conventional, FHA, Cash, VA! Clean and well kept!
-
2026-01-06$215,000 New 319-char remark
Show marketing remark (319 chars)
Nice spacious townhome close to everything! Main floor has a bedroom with a full bathroom. Open concept to view kitchen, Livingroom with dining area. Upstairs has 2 spare bedrooms another full bathroom. Master has private bathroom and walk in closest. This home will go conventional, FHA, Cash, VA! Clean and well kept!
-
2026-01-05$215,000 Active 319-char remark
Show marketing remark (319 chars)
Nice spacious townhome close to everything! Main floor has a bedroom with a full bathroom. Open concept to view kitchen, Livingroom with dining area. Upstairs has 2 spare bedrooms another full bathroom. Master has private bathroom and walk in closest. This home will go conventional, FHA, Cash, VA! Clean and well kept!
-
2016-08-06price $34,900
-
2012-02-28soldstatus $35,200 Sold
-
2012-02-07historical
-
2012-02-07price $35,200
-
2012-02-02historical Pending Approval
-
2012-01-19price $34,900 Reduced
-
2011-12-15$44,900 New
ⓘ Source: listings_history table (triggers on properties + properties_extension) + one-shot
backfill from property_details.listing_events for pre-trigger history.
Tax reassessment forecast GA · Resets to sale price
- Current annual tax
- $2,890 · $241/mo
- Projected year-2 tax
- $2,890 · $241/mo
- Expected delta
- $0/yr ($0/mo · 0.0%)
ⓘ Screening estimate from a state-policy table — verify with the county assessor before closing.
Climate risk First Street
- Flood 1/10 Low FEMA zone X (unshaded) · 0% chance over 30 yrs
- Wildfire 1/10 Low
- Heat 6/10 Major 7 d/yr ≥105°F today · 18 d/yr by 30 yrs out
- Wind 6/10 Major 27% chance of damaging wind over 30 yrs
- Air quality 4/10 Moderate 4 unhealthy d/yr today · 6 by 30 yrs out
Nearby sold comps map
Loading sold comps map…
Walkable amenities ~0.75 mi
Loading nearby amenities…
Taxation est. · year 1
- Rental income
- $25,828
- − Mortgage interest
- −$11,707
- − Property taxes
- −$2,890
- − Insurance
- −$1,045
- − Repairs & maintenance
- −$2,066
- − Management
- −$2,066
- − HOA
- −$480
- − Depreciation
- −$6,080
- Taxable loss
- −$507
- Est. tax savings @ 24.0%
- +$122
- After-tax cash flow
- $2,958/yr
For passive investors: Depreciation is non-cash, so a rental often shows a tax loss while cash-flowing — sheltering income. Rental losses are passive: they offset passive income freely, and up to $25,000/yr can offset ordinary (W-2) income if you actively participate and your MAGI is under $100k (phasing out to $0 by $150k); unused losses carry forward. On sale, claimed depreciation is recaptured at up to 25%, and gains may owe capital-gains tax (a 1031 exchange can defer both). Figures are a year-1 estimate at your 24.0% rate — not tax advice; consult a CPA.
Schools (NCES district)
- District
- Clayton County
- NCES district ID
- 1301230
- Math proficiency
- 11% ▼ -13.00%
- Reading proficiency
- 20% ▼ -9.00%
- Median HH income
- $42,266
- Composite
- 13.41/100
- National rank
- #9527
- State rank
- #155 of 174 in GA
Livability — Forest Park
- Score
- 65/100
- State rank
- #209
- US rank
- #12698
Category grades
Schools grade is shown separately in the Schools card above.
Census & demographics
- County
- Clayton County · 230,153 people
- City population
- 29,210
- Metro
- Atlanta-Sandy Springs-Alpharetta, GA
- Population (ZIP)
- 28,693
- Household income
- $52,666
- Rent vs Own
- Severe rent burden
- 1956.0
Population outlook (Clayton County) Hauer SSP2
- Today (2025)
- 310,777 people
- By 2030
- 329,762 · +6.1%
- By 2040
- 368,052 · +18.4%
- By 2050
- 401,196 · +29.1%
- By 2075
- 472,488 · +52.0%
- By 2100
- 500,446 · +61.0%
Race, ethnicity, and origin ACS 2023
- Neighborhood character
- Diverse neighborhood (Simpson 0.67)
- Race & ethnicity
- Black 50% Asian 20% Hispanic / Latino 19% Two or more races 7% White 7%
- Hispanic origin (detail)
- Mexican 11% Dominican 1%
- Foreign-born
- 24% · Vietnam, Canada, South Korea
- Languages at home
- 63% English-only · Spanish 17% Vietnamese 16% Other Asian/Pacific 1%
Political lean MEDSL · Clayton
- 2024 margin
- Solid D (+69.2) · D 84.3% · R 15.1%
- 2008→2024 swing
- +2.8pp toward D · 2008: 66.4pp · 2024: 69.2pp
- All cycles
- 2024: D+69.2 2020: D+70.9 2016: D+71.9 2012: D+70.1 2008: D+66.4
Not yet ingested
- Civics
- —
Market trends
- HPI YoY
- ▼ -98.24%
- Current HPI
- 192.3741
- Rent YoY
- ▼ -1.00%
- Metro
- Atlanta-Sandy Springs-Alpharetta, GA
- State GDP YoY
- ▲ 2.66%
- F500 in state
- 28
Industry mix (Fortune 500 HQ in GA)
| Industry | F500 HQs | Revenue |
|---|---|---|
| Paper / Packaging | 2 | $29B |
|
||
| Retail | 1 | $160B |
|
||
| Transportation / Logistics | 1 | $91B |
|
||
| Airlines | 1 | $62B |
|
||
| Consumer Goods | 1 | $47B |
|
||
| Utilities | 1 | $25B |
|
||
Price history
+365.5% since first listed11 events — show timeline
- 2026-02-18 Price Changed $209,000 FMLS
- 2026-02-13 Price Changed $209,000 GAMLS
- 2026-01-06 Listed $215,000 GAMLS
- 2026-01-05 Listed $215,000 FMLS
- 2016-08-06 Price Changed $34,900 GAMLS
- 2012-02-28 Sold (MLS) $35,200 GAMLS
- 2012-02-07 Listing Removed — GAMLS
- 2012-02-07 Price Changed $35,200 GAMLS
- 2012-02-02 Contingent — GAMLS
- 2012-01-19 Price Changed $34,900 GAMLS
- 2011-12-15 Listed $44,900 GAMLS
Property tax history
+2.7%/yrLatest (2025): $2,890 · -9.2% YoY. Source: county tax records.
Cash-flow waterfall
monthlySold comps — $/sqft
last 12 mo · ≤1 miLoading sold comps…