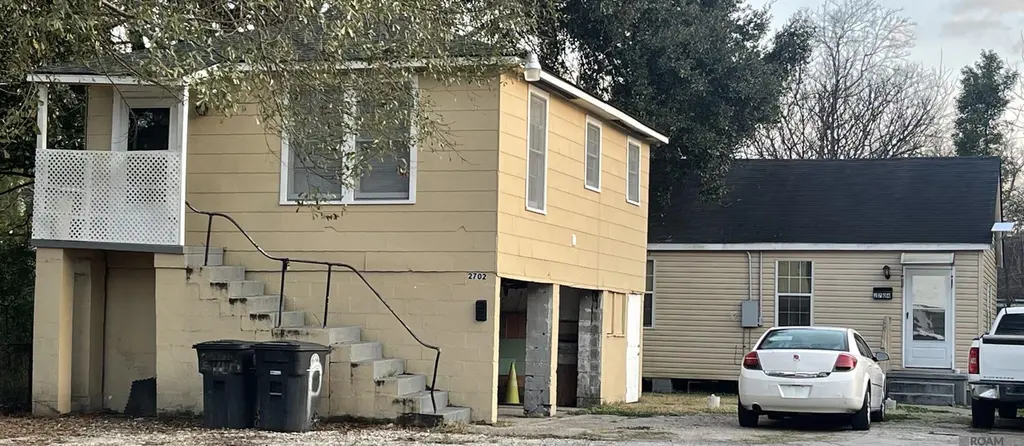
2702-2704 Iroquois St · Baton Rouge, LA
Flood risk 1/10 · Minimal
- FEMA flood zone
- X (unshaded)
- Chance of flooding over 30 yrs
- 0.0%
- Est. flood insurance / yr
- $507 – $1,088
Fire risk 1/10 · Minimal
- Est. fire insurance / yr
- $1,269 – $2,357
Heat risk 8/10 · Major
- Hot days now (above 108°F)
- 7 days/yr
- Hot days in 30 yrs
- 20 days/yr
Wind risk 9/10 · Severe
- Chance of severe wind over 30 yrs
- 99.0%
Air-quality risk 2/10 · Minimal
- Unhealthy air days now
- 1 days/yr
- Unhealthy air days in 30 yrs
- 1 days/yr
Risk factors via First Street. Map © Google.
Why this score? — see what drove the C- grade
The composite is a weighted blend of 9 inputs, each scored 0–100. Each bar is that input's sub-score; the figure is the points it added to the 100-point composite (weight × sub-score).
- Cash flow +21.3/30.0
- ARV discount +7.5/15.0
- DSCR +6.8/10.0
- 1% rule +4.3/10.0
- Livability +3.7/5.0
- Condition / age +2.5/5.0
- Schools +2.4/10.0
- Rent growth +2.2/5.0
- Appreciation +0.0/10.0
$150,000
🖨 Deal sheet (PDF) 📄 Offer letter ✓ Due diligence
Listing remarks MLS
Investor Special - Great investment opportunity with Immediate Cash Flow! This newly renovated income-producing property features two tenant-occupied units already in place. Fully tenant-occupied duplex generating income from day one. Unit 1 is a 2BR/1BA with a tenant paying $900/month, providing stable and reliable rental income. Unit 2 is a 1BR/1BA currently leased at $650/month. No vacancy concerns. Start collecting rent at closing! Ideal for investors looking to expand their portfolio with a performing asset and consistent monthly income. Strong rental demand in the area with upside potential for future rent growth. Flood Zone X. Serious investors only! DO NOT DISTURB TENANTS. Showings with a scheduled appointment only.
Key facts
- 9,147 sq ft lot
- Garage
- Listed 121 days
Neighborhood map
What this means for you Summary
Snapshot
- This is a 4-bed/2.0-bath single-family listed at $150k.
Deal economics
- At list price, monthly cash flow is $219 ($3k/yr) — positive.
- The deal already cash-flows at list — no discount required.
- To meet the 1% rule (rent ≥ 1% of price), the offer needs to be $139k (7.3% below list).
- Recommended offer: $132k (12.0% below list) — sets the bar for market timing.
- Cap rate 8.0% vs local median 4.2% in Baton Rouge — top-decile yield for the area; either an underpriced asset or a hidden risk that comps aren't pricing in. Stress-test before assuming the spread holds.
Location & tenants
- Location reads 74/100 on livability (#24 in LA, #4,535 nationally) — a middle-class / working-renter tenant base. Strengths: commute A+, cost of living A+, health & safety A+; Watch: amenities D, crime F, employment D-.
- East Baton Rouge Parish (urban): math 22% / reading 34% proficiency, ranked #47 of 98 in LA (top 48%) — low school quality limits family demand, transient renter base, plan for 1-2y turnover; 77% free/reduced lunch — lower-income household profile, screen leases tightly.
- Zoned schools: Capitol Elementary School (math 22% / reading 22%, grade F, #415 of 646 statewide, top 67%, 300 students, 94% FRL); Capitol Middle School (math 4% / reading 10%, grade F, #212 of 218 statewide, top 97%, 580 students, 87% FRL); Liberty High School (math 50% / reading 74%, grade B-, #15 of 265 statewide, top 6%, 1,208 students, 60% FRL) — zoned schools at 80% FRL track the district average.
- Market conditions: Rents soft (-1.2%/yr); 155 active listings in the ZIP; 20 comparable units currently listed for rent nearby; rentals at typical pace (median 26d on market — plan ~3-4 weeks tenant-placement turnaround); lower-income renter base — watch delinquency; 2,252 units permitted in East Baton Rouge Parish in 2024 (440 in 5+ unit buildings).
- At $1,390/mo this rent would consume 66% of the median local household income ($25k/yr) (locally 1980% of renters already pay >50% of income on rent) — very limited rent-growth headroom before tenants either downsize or default.
Forward outlook
- Local home prices are declining (-3.0%/yr); year-one equity from $1k of loan paydown is wiped out by about $4k of value loss. Plan a longer hold.
- East Baton Rouge County population projected at +4% by 2050 — modest demand growth; plan on rents tracking national, not racing it.
Negotiation context
- It's been on market 121 days — a 12% lower offer ($132k) is reasonable based on typical stale-listing flexibility.
- 2 sale attempts with the ask held roughly flat each time — persistent listings suggest the price (not the market) is what's stuck; bring a comps-based counter.
Risks & watch-outs
- Climate carrying-cost: severe wind risk, 99% chance of damaging wind over 30y; extreme-heat days projected 7→20/yr by 2055 (HVAC capex compounding) — expect insurance premiums to compound above CPI over the hold.
Questions for the listing agent
- It's been on market 121 days. Have you received any prior offers? Is the seller open to a 12% concession, seller financing, or rate buy-down credit?
- Why hasn't it sold? Are there any deal-killer items the seller is aware of (foundation, flood, title, zoning, code violations)?
- Is there a deadline driving the sale (1031 exchange, divorce, estate, relocation)? That informs how much negotiation room exists.
- Crime grade is F in this area — have there been break-ins, vandalism, or insurance claims at this property in the last 3 years? What carrier currently insures it and at what premium?
- What's the average days-on-market for RENTAL listings here right now (not sales)? A rising rental-DOM trend means longer vacancies and softer asking-rent achievability than the comps imply.
- What's the recent tenant-quality profile in this submarket — average credit score on applications, eviction rate, late-payment / NSF rate, and stable-employment percentage? A property-management company in the area should have these aggregated.
- How much new for-sale + rental construction is in the pipeline within 1–3 miles? Heavy new supply typically softens prices + rents 12–24 months out; constrained supply supports both.
Investment metrics
- 1% rule
- 0.93% ✗
- Cap rate
- 8.05%
- Cash-on-cash
- 6.27%
- DSCR
- 1.28
- GRM
- 9.0
CMA / ARV
- ARV (median comp)
- $41,977
- List price
- $150,000
- Delta
- 257.34%
- Verdict
- OVERPRICED
- Comps
- 5 within 1.0 mi
Show comp detail 12 sales within ~0.75 mi
| Address | Dist | Beds/Ba | Sqft | Sold | Price | $/sf | Match |
|---|---|---|---|---|---|---|---|
| 3008 Seneca St | 0.17mi | 3/1.0 (-1) | 1,350 (+3%) | 9mo | $64,900 | $48 | 71 |
| 2927 Tecumseh St | 0.33mi | 3/2.0 (-1) | 1,245 (-5%) | 3mo | $182,500 | $147 | 69 |
| 3017 Winbourne Ave | 0.45mi | 3/2.0 (-1) | 1,307 (-1%) | 9mo | $19,900 | $15 | 65 |
| 2908 Adams Ave | 0.27mi | 3/1.0 (-1) | 1,232 (-6%) | 9mo | $100,000 | $81 | 60 |
| 2711 Jackson Ave | 0.41mi | 3/2.0 (-1) | 1,200 (-9%) | 7mo | $79,000 | $66 | 55 |
| 1650 N 32nd St | 0.66mi | 3/2.0 (-1) | 1,341 (+2%) | 10mo | $90,000 | $67 | 52 |
| 3691 Dalton St | 0.52mi | 4/1.0 | 1,225 (-7%) | 10mo | $52,500 | $43 | 52 |
| 3335 N 38th St | 0.68mi | 3/1.0 (-1) | 1,275 (-3%) | 6mo | $55,000 | $43 | 49 |
| 2526 Adams Ave | 0.30mi | 3/1.0 (-1) | 1,124 (-14%) | 13mo | $130,000 | $116 | 42 |
| 2733 Jackson Ave | 0.40mi | 3/1.0 (-1) | 1,151 (-12%) | 13mo | $63,829 | $55 | 40 |
| 3825 Fairfields Ave | 0.65mi | 3/1.0 (-1) | 1,152 (-12%) | 1mo | $125,000 | $109 | 39 |
| 2342 Cherry St | 0.72mi | 3/1.0 (-1) | 1,423 (+8%) | 10mo | $35,000 | $25 | 36 |
Match score weights: distance 35% · size 25% · config 20% · recency 20%. Top-matched comps best support the ARV.
Projected returns pro-forma
-3.0% appreciation · 0.0% rent growth · sell at horizon
- IRR
- -9.7%
- Equity multiple
- 0.66×
- Total profit
- $-14,486
- Equity at exit
- $22,365
- IRR
- -4.4%
- Equity multiple
- 0.75×
- Total profit
- $-10,677
- Equity at exit
- $12,969
Cash invested: $42,000 (down + closing). Projections, not guarantees.
Landlord ↔ Tenant lean methodology
- Overall (STATE)
- 90 Strongly Landlord-Friendly
- State Louisiana
- 90 Strongly Landlord-Friendly · R+12
- County
- — inherits STATE
- City
- — inherits STATE
ZIP-level market 70805
- Rents YoY
- -1.2%
- Active inventory
- 155
- Price-to-rent
- 9.0×
Monthly cashflow live
- Estimated rent
- $1,390 high interval (Pro) →
- Mortgage (P&I)
- −$787
- Tax from tax record
- −$30 /mo · $356/yr
- Insurance
- −$62
- HOA
- −$0
- Vacancy / Maint / Mgmt
- −$292
- Net cashflow
- $219
Break-even live
Sensitivity live
| Price | -10% $304 | -5% $262 | +0% $219 | +5% $177 | +10% $134 |
|---|---|---|---|---|---|
| Rent | -10% $110 | -5% $164 | +0% $219 | +5% $274 | +10% $329 |
| Rate | -1.0pp $295 | -0.5pp $257 | base $219 | +0.5pp $180 | +1.0pp $141 |
UW: 25.0% down · 7.5% · 30yr · 1.5% tax · 5.0% vac · 8.0% maint · 8.0% mgmt
Financing live
Cash to close
- Down payment
- $37,500
- Closing costs
- $4,500
- Reserves months
- —
- Total cash needed
- —
Loan-product check · same deal, 3 products live
Conventional
25% down · 7.5% · 30yr
- Down + closing
- —
- Monthly P&I
- —
- Monthly cashflow
- —
- DSCR
- —
- Eligible?
- —
Personal DTI + credit; lowest rate.
DSCR
20% down · 8.5% · 30yr
- Down + closing
- —
- Monthly P&I
- —
- Monthly cashflow
- —
- DSCR
- —
- Eligible?
- —
No personal income docs; deal must DSCR.
Hard money
10% down · 12.0% · 12mo
- Down + closing
- —
- Monthly P&I
- —
- Monthly cashflow
- —
- DSCR
- —
- Eligible?
- —
Short-term bridge; refi at stabilization.
Rent comps 20 comps
| Address | Beds | Baths | Sqft | Rent | $/sqft | DOM | Units | Dist |
|---|---|---|---|---|---|---|---|---|
| 2645 Seneca St Baton Rouge, LA | 3.0 | 2.0 | 1650 | $1,550 | $0.94 | 25d | 1 | 0.04mi |
| 3725 Winbourne Ave Baton Rouge, LA | 4.0 | 1.5 | 1800 | $1,495 | $0.83 | 21d | 1 | 0.70mi |
| 1404 N 29th St Baton Rouge, LA | 3.0 | 2.0 | 1120 | $1,100 | $0.98 | 45d | 1 | 0.73mi |
| 3906 S Barrow Dr Baton Rouge, LA | 3.0 | 2.0 | 1523 | $1,295 | $0.85 | 25d | 1 | 0.73mi |
| 1336 N 29th St Baton Rouge, LA | 3.0 | 2.0 | 1400 | $1,450 | $1.04 | 16d | 1 | 0.76mi |
| 3567 Charles St Baton Rouge, LA | 3.0 | 1.0 | 1400 | $1,250 | $0.89 | 45d | 1 | 0.79mi |
| 1409 N 35th St Baton Rouge, LA | 3.0 | 2.0 | 912 | $750 | $0.82 | 25d | 1 | 0.84mi |
| 3888 Charles St Baton Rouge, LA | 3.0 | 2.0 | 1600 | $1,500 | $0.94 | 21d | 1 | 0.89mi |
| 3888 Charles St Baton Rouge, LA | 3.0 | 2.0 | 1650 | $1,425 | $0.86 | 25d | 1 | 0.89mi |
| 1847 N 16th St Baton Rouge, LA | 3.0 | 2.0 | 909 | $1,250 | $1.38 | 16d | 1 | 0.91mi |
| 1348 N 37th St Baton Rouge, LA | 3.0 | 1.0 | 1100 | $1,200 | $1.09 | 45d | 1 | 0.91mi |
| 2933 Dayton St Baton Rouge, LA | 4.0 | 2.0 | 1800 | $1,350 | $0.75 | 25d | 1 | 1.13mi |
| 3647 Mission Dr Baton Rouge, LA | 3.0 | 1.0 | 900 | $895 | $0.99 | 25d | 1 | 1.16mi |
| 1217 N 44th St Baton Rouge, LA | 3.0 | 2.0 | 1028 | $950 | $0.92 | 25d | 1 | 1.26mi |
| 4236 Delaware St Baton Rouge, LA | 3.0 | 2.0 | 1600 | $1,500 | $0.94 | 25d | 1 | 1.31mi |
| 3566 North St Baton Rouge, LA | 4.0 | 2.0 | 1117 | $1,050 | $0.94 | 23d | 1 | 1.36mi |
| 3835 Sherwood St Baton Rouge, LA | 5.0 | 2.0 | 1615 | $1,850 | $1.15 | 25d | 1 | 1.40mi |
| 3835 Sherwood St Baton Rouge, LA | 5.0 | 2.0 | 1615 | $1,850 | $1.15 | 45d | 1 | 1.40mi |
| 5212 Jackson Ave Baton Rouge, LA | 4.0 | 2.0 | 1500 | $1,650 | $1.10 | 25d | 1 | 1.49mi |
| 532 Live Oak Blvd Unit 532 Baton Rouge, LA | 3.0 | 2.0 | 1000 | $1,200 | $1.20 | 25d | 1 | 1.50mi |
Listing history 19 events
-
2026-06-22days on market $150,000 Active 121 DOM
-
2026-06-18days on market $150,000 Active 118 DOM
-
2026-06-17days on market $150,000 Active 117 DOM
-
2026-06-16days on market $150,000 Active 116 DOM
-
2026-06-15days on market $150,000 Active 115 DOM
-
2026-06-14days on market $150,000 Active 113 DOM
-
2026-06-10days on market $150,000 Active 110 DOM
-
2026-06-09days on market $150,000 Active 109 DOM
-
2026-06-08days on market $150,000 Active 108 DOM
-
2026-06-07days on market $150,000 Active 107 DOM
-
2026-06-05days on market $150,000 Active 104 DOM
-
2026-06-03days on market $150,000 Active 103 DOM
-
2026-06-02days on market $150,000 Active 102 DOM
-
2026-06-01days on market $150,000 Active 101 DOM
-
2026-05-31days on market $150,000 Active 100 DOM
-
2026-05-31days on market $150,000 Active 99 DOM
-
2026-02-21$150,000 Active 733-char remark
Show marketing remark (733 chars)
Investor Special - Great investment opportunity with Immediate Cash Flow! This newly renovated income-producing property features two tenant-occupied units already in place. Fully tenant-occupied duplex generating income from day one. Unit 1 is a 2BR/1BA with a tenant paying $900/month, providing stable and reliable rental income. Unit 2 is a 1BR/1BA currently leased at $650/month. No vacancy concerns. Start collecting rent at closing! Ideal for investors looking to expand their portfolio with a performing asset and consistent monthly income. Strong rental demand in the area with upside potential for future rent growth. Flood Zone X. Serious investors only! DO NOT DISTURB TENANTS. Showings with a scheduled appointment only.
-
2026-02-20historical $150,000 733-char remark
Show marketing remark (733 chars)
Investor Special - Great investment opportunity with Immediate Cash Flow! This newly renovated income-producing property features two tenant-occupied units already in place. Fully tenant-occupied duplex generating income from day one. Unit 1 is a 2BR/1BA with a tenant paying $900/month, providing stable and reliable rental income. Unit 2 is a 1BR/1BA currently leased at $650/month. No vacancy concerns. Start collecting rent at closing! Ideal for investors looking to expand their portfolio with a performing asset and consistent monthly income. Strong rental demand in the area with upside potential for future rent growth. Flood Zone X. Serious investors only! DO NOT DISTURB TENANTS. Showings with a scheduled appointment only.
ⓘ Source: listings_history table (triggers on properties + properties_extension) + one-shot
backfill from property_details.listing_events for pre-trigger history.
Tax reassessment forecast LA · Resets to sale price
- Current annual tax
- $356 · $30/mo
- Projected year-2 tax
- $825 · $69/mo
- Expected delta
- +$469/yr (+$39/mo · 132.0%)
ⓘ Screening estimate from a state-policy table — verify with the county assessor before closing.
Climate risk First Street
- Flood 1/10 Low FEMA zone X (unshaded) · 0% chance over 30 yrs
- Wildfire 1/10 Low
- Heat 8/10 Severe 7 d/yr ≥108°F today · 20 d/yr by 30 yrs out
- Wind 9/10 Extreme 99% chance of damaging wind over 30 yrs
- Air quality 2/10 Low 1 unhealthy d/yr today · 1 by 30 yrs out
Nearby sold comps map
Loading sold comps map…
Walkable amenities ~0.75 mi
Loading nearby amenities…
Taxation est. · year 1
- Rental income
- $16,680
- − Mortgage interest
- −$8,402
- − Property taxes
- −$356
- − Insurance
- −$750
- − Repairs & maintenance
- −$1,334
- − Management
- −$1,334
- − Depreciation
- −$4,364
- Taxable income
- $139
- Est. tax owed @ 24.0%
- −$33
- After-tax cash flow
- $2,599/yr
For passive investors: Depreciation is non-cash, so a rental often shows a tax loss while cash-flowing — sheltering income. Rental losses are passive: they offset passive income freely, and up to $25,000/yr can offset ordinary (W-2) income if you actively participate and your MAGI is under $100k (phasing out to $0 by $150k); unused losses carry forward. On sale, claimed depreciation is recaptured at up to 25%, and gains may owe capital-gains tax (a 1031 exchange can defer both). Figures are a year-1 estimate at your 24.0% rate — not tax advice; consult a CPA.
Schools (NCES district)
- District
- East Baton Rouge Parish
- NCES district ID
- 2200540
- Math proficiency
- 22% ▼ -36.00%
- Reading proficiency
- 34% ▼ -31.00%
- Median HH income
- $46,263
- Composite
- 24.14/100
- National rank
- #7745
- State rank
- #47 of 98 in LA
Livability — Baton Rouge
- Score
- 74/100
- State rank
- #24
- US rank
- #4535
Category grades
Schools grade is shown separately in the Schools card above.
Census & demographics
- Census place
- Baton Rouge, LA
- County
- East Baton Rouge Parish · 399,686 people
- City population
- 351,868
- Metro
- Baton Rouge, LA
- Population (ZIP)
- 23,288
- Household income
- $25,397
- Rent vs Own
- Severe rent burden
- 1980.0
Population outlook (East Baton Rouge County) Hauer SSP2
- Today (2025)
- 464,810 people
- By 2030
- 472,137 · +1.6%
- By 2040
- 480,243 · +3.3%
- By 2050
- 484,422 · +4.2%
- By 2075
- 492,069 · +5.9%
- By 2100
- 476,347 · +2.5%
Race, ethnicity, and origin ACS 2023
- Neighborhood character
- Predominantly Black (95%)
- Race & ethnicity
- Black 95% Hispanic / Latino 2% White 2% Two or more races 1%
- Common ancestry
- Lithuanian 1%
- Foreign-born
- 1% · Canada
- Languages at home
- 98% English-only · Spanish 1%
Political lean MEDSL · East Baton Rouge
- 2024 margin
- D (+11.1) · D 54.5% · R 43.4% · Other 2.1%
- 2008→2024 swing
- +8.9pp toward D · 2008: 2.2pp · 2024: 11.1pp
- All cycles
- 2024: D+11.1 2020: D+13.1 2016: D+9.2 2012: D+5.2 2008: D+2.2
Not yet ingested
- Civics
- —
Market trends
- HPI YoY
- ▼ -110.79%
- Current HPI
- 75.7121
- Rent YoY
- ▼ -1.21%
- Metro
- Baton Rouge, LA
- State GDP YoY
- ▲ 3.29%
- F500 in state
- 10
Industry mix (Fortune 500 HQ in LA)
| Industry | F500 HQs | Revenue |
|---|---|---|
| Telecommunications | 2 | $23B |
|
||
| Utilities | 1 | $12B |
|
||
| Wholesale / Distribution | 1 | $5B |
|
||
| Advertising | 1 | $2B |
|
||
Price history
+0.0% since first listed3 events — show timeline
- 2026-02-21 Listed $150,000 AcadianaMLS
- 2026-02-21 Listed $150,000 GBRMLS
- 2026-02-20 Coming Soon $150,000 GBRMLS
Property tax history
+2.4%/yrLatest (2025): $356 · +4.7% YoY. Source: county tax records.
Cash-flow waterfall
monthlySold comps — $/sqft
last 12 mo · ≤1 miLoading sold comps…