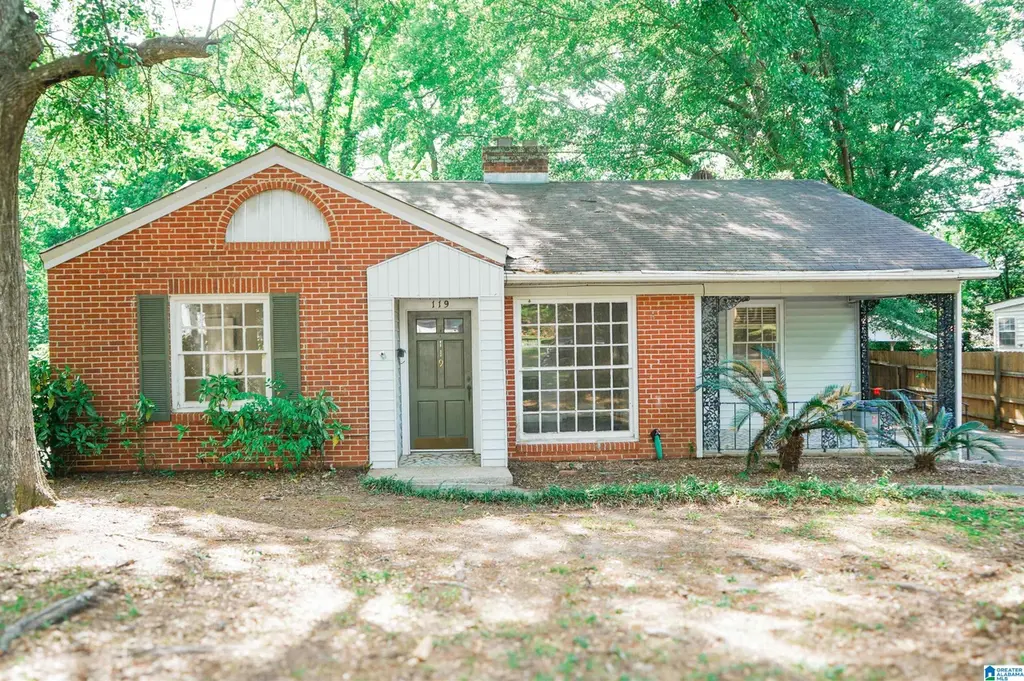
119 Arden Rd · Montgomery, AL
Flood risk 4/10 · Minor
- FEMA flood zone
- X (unshaded)
- Chance of flooding over 30 yrs
- 0.22%
- Est. flood insurance / yr
- $507 – $1,088
Fire risk 1/10 · Minimal
- Est. fire insurance / yr
- $916 – $1,700
Heat risk 7/10 · Major
- Hot days now (above 107°F)
- 7 days/yr
- Hot days in 30 yrs
- 19 days/yr
Wind risk 8/10 · Major
- Chance of severe wind over 30 yrs
- 80.0%
Air-quality risk 3/10 · Minor
- Unhealthy air days now
- 4 days/yr
- Unhealthy air days in 30 yrs
- 4 days/yr
Risk factors via First Street. Map © Google.
Why this score? — see what drove the B- grade
The composite is a weighted blend of 9 inputs, each scored 0–100. Each bar is that input's sub-score; the figure is the points it added to the 100-point composite (weight × sub-score).
- Cash flow +27.6/30.0
- ARV discount +15.0/15.0
- DSCR +9.7/10.0
- 1% rule +6.5/10.0
- Rent growth +3.2/5.0
- Livability +3.2/5.0
- Condition / age +2.5/5.0
- Schools +1.7/10.0
- Appreciation +0.0/10.0
$111,000
🖨 Deal sheet 📄 Offer letter ✓ Due diligence
Listing remarks MLS
HUD HOMES SOLD AS IS.
Key facts
- Dining room
- Reading room
- Cozy fireplace
Tags
Property features AI
Finance
- Financial info: Down payment assistance available
Exterior
- Parking: Detached garage (rear entry); Driveway parking; Total of 1 garage space
- Security: No security features listed
- Utilities: Public water; Connected sewer; Gas water heater; Internet service available
- Home design: Single-family property (existing); Three-side brick with vinyl siding construction; Slab foundation
- Construction: 3-side brick and vinyl siding exterior
- Exterior features: Fenced yard; Covered patio/porch; Porch; Garden/patio; Storage building
Interior
- Kitchen: Convection oven; Electric cooktop; Refrigerator; Laminate countertops
- Bedrooms: Master bedroom (main level); Two additional bedrooms (main level)
- Flooring: Carpet; Hardwood
- Bathrooms: Two full bathrooms; Separate shower and tub/shower combo
- Heating & cooling: Gas heating; Central air conditioning
- Interior features: Carpet and hardwood floors; Ceilings: other (see remarks); One gas fireplace with tile surround located in the den; No additional interior features listed
- Laundry & utility: Main-level laundry in a closet; Washer hookup; Electric dryer hookup
Neighborhood map
What this means for you Summary
Snapshot
- This is a 3-bed/2.0-bath single-family listed at $111k.
Deal economics
- At list price, monthly cash flow is $331 ($4k/yr) — positive.
- The deal already cash-flows at list — no discount required.
- Meets the 1% rule at list price ($1k rent vs $111k).
- Recommended offer: $108k (3.0% below list) — sets the bar for market timing.
- Cap rate 9.9% vs local median 6.0% in Montgomery — top-decile yield for the area; either an underpriced asset or a hidden risk that comps aren't pricing in. Stress-test before assuming the spread holds.
Location & tenants
- Location reads 65/100 on livability (#138 in AL) — a middle-class / working-renter tenant base. Strengths: cost of living A+, housing A+; Watch: employment D, crime F, amenities D-.
- Montgomery County (urban): math 9% / reading 31% proficiency, ranked #106 of 129 in AL (top 82%) — low school quality limits family demand, transient renter base, plan for 1-2y turnover; 70% free/reduced lunch — lower-income household profile, screen leases tightly.
- Zoned schools: Morningview Elementary School (math 0% / reading 15%, grade F, #598 of 627 statewide, top 96%, 448 students, 86% FRL); Lee High School (math 2% / reading 8%, grade F, #276 of 305 statewide, top 95%, 1,374 students, 86% FRL) — zoned schools average 86% FRL vs 70% district-wide (16 pts higher); higher-poverty schools than district average — tighter screening recommended.
- Zoned-school proficiency averages 6% at this address vs 20% district-wide (-14 pts) — the specific schools serving this property underperform the Montgomery County average; the district grade overstates school quality for this exact location.
- Market conditions: Rents rising (+2.6%/yr); 207 active listings in the ZIP; 40 comparable units currently listed for rent nearby; rentals lingering (median 44d on market — plan ~5-8 weeks vacancy on turnover, expect pricing pressure); 50% of comp listings sitting > 30 days — soft ceiling on asking rent; 460 units permitted in Montgomery County in 2024 (37 in 5+ unit buildings).
Forward outlook
- Local home prices are declining (-3.0%/yr); year-one equity from $767 of loan paydown is wiped out by about $3k of value loss. Plan a longer hold.
- Montgomery County population projected to shrink 8% by 2050 — rents likely to lag national; underwrite the cash flow, not the appreciation.
- At projected returns (-3.0% appreciation + 2.6% rent growth), your $31k cash investment doubles in ~10 years — after that, you're playing with house money.
Negotiation context
- It's been on market 52 days — a 3% lower offer ($108k) is reasonable based on typical stale-listing flexibility.
- 3 sale attempts since 22y ago; this cycle's ask has dropped $9k (7%) from the opening price — seller is motivated, your offer sets the floor, not the list.
Risks & watch-outs
- Watch-outs: built in 1948 — expect roof / HVAC / electrical / plumbing capex.
- Climate carrying-cost: severe wind risk, 80% chance of damaging wind over 30y; extreme-heat days projected 7→19/yr by 2055 (HVAC capex compounding) — expect insurance premiums to compound above CPI over the hold.
Questions for the listing agent
- It's been on market 52 days. Have you received any prior offers? Is the seller open to a 3% concession, seller financing, or rate buy-down credit?
- Built in 1948 — when were the roof, HVAC, electrical panel, plumbing, and water heater last replaced?
- Is there a deadline driving the sale (1031 exchange, divorce, estate, relocation)? That informs how much negotiation room exists.
- Crime grade is F in this area — have there been break-ins, vandalism, or insurance claims at this property in the last 3 years? What carrier currently insures it and at what premium?
- What's the average days-on-market for RENTAL listings here right now (not sales)? A rising rental-DOM trend means longer vacancies and softer asking-rent achievability than the comps imply.
- What's the recent tenant-quality profile in this submarket — average credit score on applications, eviction rate, late-payment / NSF rate, and stable-employment percentage? A property-management company in the area should have these aggregated.
- How much new for-sale + rental construction is in the pipeline within 1–3 miles? Heavy new supply typically softens prices + rents 12–24 months out; constrained supply supports both.
Investment metrics
- 1% rule
- 1.15% ✓
- Cap rate
- 9.88%
- Cash-on-cash
- 12.80%
- DSCR
- 1.57
- GRM
- 7.2
CMA / ARV
- ARV (median comp)
- $142,150
- List price
- $111,000
- Delta
- -21.91%
- Verdict
- UNDERPRICED
- Comps
- 20 within 1.0 mi
Show comp detail 12 sales within ~0.75 mi
| Address | Dist | Beds/Ba | Sqft | Sold | Price | $/sf | Match |
|---|---|---|---|---|---|---|---|
| 2311 Mccarter Ave | 0.23mi | 3/2.0 | 1,765 (+1%) | 0mo | $64,000 | $36 | 87 |
| 119 Kent St | 0.33mi | 3/2.0 | 1,785 (+3%) | 1mo | $135,000 | $76 | 80 |
| 2219 St Charles Ave | 0.46mi | 3/2.0 | 1,736 (-0%) | 2mo | $155,000 | $89 | 76 |
| 3012 Pelzer Ave | 0.45mi | 3/2.0 | 1,790 (+3%) | 0mo | $159,900 | $89 | 74 |
| 20 Arden Rd | 0.24mi | 3/2.0 | 1,575 (-10%) | 1mo | $165,000 | $105 | 72 |
| 13 Brantwood Dr | 0.25mi | 3/2.5 | 1,909 (+10%) | 0mo | $118,000 | $62 | 70 |
| 2731 Ashley Ave | 0.27mi | 3/2.5 | 1,919 (+10%) | 2mo | $225,000 | $117 | 67 |
| 125 Kent St | 0.33mi | 3/2.0 | 1,932 (+11%) | 0mo | $130,000 | $67 | 66 |
| 2134 Winona Ave | 0.51mi | 3/1.0 | 1,664 (-4%) | 1mo | $101,700 | $61 | 64 |
| 3013 Biltmore Ave | 0.58mi | 3/2.0 | 1,870 (+8%) | 0mo | $165,000 | $88 | 60 |
| 2220 Windsor Ave | 0.32mi | 2/1.0 (-1) | 1,914 (+10%) | 4mo | $60,000 | $31 | 56 |
| 3129 Willow Lane Dr | 0.75mi | 4/2.0 (+1) | 1,706 (-2%) | 4mo | $180,000 | $106 | 54 |
Match score weights: distance 35% · size 25% · config 20% · recency 20%. Top-matched comps best support the ARV.
Projected returns pro-forma
-3.0% appreciation · 2.65% rent growth · sell at horizon
- IRR
- 2.2%
- Equity multiple
- 1.08×
- Total profit
- $2,637
- Equity at exit
- $16,550
- IRR
- 11.5%
- Equity multiple
- 1.88×
- Total profit
- $27,504
- Equity at exit
- $9,597
Cash invested: $31,080 (down + closing). Projections, not guarantees.
Landlord ↔ Tenant lean methodology
- Overall (STATE)
- 90 Strongly Landlord-Friendly
- State Alabama
- 90 Strongly Landlord-Friendly · R+15
- County
- — inherits STATE
- City
- — inherits STATE
ZIP-level market 36109
- Home prices YoY
- -20.1%
- Rents YoY
- 2.6%
- Active inventory
- 207
- Price-to-rent
- 7.2×
Monthly cashflow live
- Estimated rent
- $1,278 high interval (Pro) →
- Mortgage (P&I)
- −$582
- Tax from tax record
- −$50 /mo · $597/yr
- Insurance
- −$46
- HOA
- −$0
- Vacancy / Maint / Mgmt
- −$268
- Net cashflow
- $331
Break-even live
UW: 25.0% down · 7.5% · 30yr · 1.5% tax · 5.0% vac · 8.0% maint · 8.0% mgmt
Financing live
Cash to close
- Down payment
- $27,750
- Closing costs
- $3,330
- Reserves months
- —
- Total cash needed
- —
Loan-product check · same deal, 3 products live
Conventional
25% down · 7.5% · 30yr
- Down + closing
- —
- Monthly P&I
- —
- Monthly cashflow
- —
- DSCR
- —
- Eligible?
- —
Personal DTI + credit; lowest rate.
DSCR
20% down · 8.5% · 30yr
- Down + closing
- —
- Monthly P&I
- —
- Monthly cashflow
- —
- DSCR
- —
- Eligible?
- —
No personal income docs; deal must DSCR.
Hard money
10% down · 12.0% · 12mo
- Down + closing
- —
- Monthly P&I
- —
- Monthly cashflow
- —
- DSCR
- —
- Eligible?
- —
Short-term bridge; refi at stabilization.
Rent comps 40 comps
| Address | Beds | Baths | Sqft | Rent | $/sqft | DOM | Units | Dist |
|---|---|---|---|---|---|---|---|---|
| 2769 Pelzer Ave Montgomery, AL | 3.0 | 2.0 | 1608 | $1,325 | $0.82 | 43d | 1 | 0.14mi |
| 108 Calhoun Rd Unit 108B Montgomery, AL | 2.0 | 1.0 | 1350 | $750 | $0.56 | 43d | 1 | 0.20mi |
| 19 Calhoun Rd Unit B Montgomery, AL | 2.0 | 1.0 | 2022 | $795 | $0.39 | 43d | 1 | 0.21mi |
| 2814 Ashley Ave Montgomery, AL | 3.0 | 2.0 | 1683 | $1,350 | $0.80 | 13d | 1 | 0.28mi |
| 2310 Yancey Ave Montgomery, AL | 3.0 | 1.0 | 1212 | $1,250 | $1.03 | 43d | 1 | 0.32mi |
| 7 Bradley Dr Montgomery, AL | 3.0 | 2.0 | 1529 | $1,500 | $0.98 | 13d | 1 | 0.37mi |
| 2243 Winona Ave Montgomery, AL | 3.0 | 1.0 | 1492 | $1,225 | $0.82 | 21d | 1 | 0.38mi |
| 15 Bradley Dr Montgomery, AL | 3.0 | 2.0 | 1365 | $1,500 | $1.10 | 21d | 1 | 0.42mi |
| 18 Oak Forest Dr Montgomery, AL | 3.0 | 2.0 | 1580 | $1,050 | $0.66 | 21d | 1 | 0.42mi |
| 2122 Windsor Ave Montgomery, AL | 2.0 | 1.0 | 1052 | $725 | $0.69 | 43d | 1 | 0.42mi |
| 2822 Sumter Ave Montgomery, AL | 3.0 | 2.5 | 1617 | $1,300 | $0.80 | 21d | 1 | 0.43mi |
| 2229 Madison Ave Montgomery, AL | 2.0 | 1.0 | 1100 | $625 | $0.57 | 43d | 1 | 0.51mi |
| 200 Eton Rd Montgomery, AL | 3.0 | 1.5 | 1500 | $895 | $0.60 | 13d | 1 | 0.54mi |
| 167 E Salem Dr Montgomery, AL | 3.0 | 2.0 | 1700 | $1,050 | $0.62 | 43d | 1 | 0.56mi |
| 2009 Yancey Ave Montgomery, AL | 3.0 | 1.0 | 1140 | $1,080 | $0.95 | 21d | 1 | 0.58mi |
| 67 Holliday Dr Montgomery, AL | 3.0 | 1.0 | 1156 | $1,200 | $1.04 | 43d | 1 | 0.62mi |
| 122 Oak Forest Dr Montgomery, AL | 3.0 | 1.0 | 1092 | $975 | $0.89 | 21d | 1 | 0.63mi |
| 3105 Pelzer Ave Montgomery, AL | 4.0 | 2.0 | 1605 | $1,425 | $0.89 | 43d | 1 | 0.63mi |
| 2113 Brewton St Montgomery, AL | 3.0 | 1.0 | 1363 | $1,150 | $0.84 | 43d | 1 | 0.75mi |
| 3329 Vermont Dr Montgomery, AL | 3.0 | 1.5 | 1465 | $1,395 | $0.95 | 13d | 1 | 0.78mi |
| 2004 Capitol Ave Unit 1043879P Montgomery, AL | 4.0 | 2.5 | 1797 | $3,518 | $1.96 | 13d | 1 | 0.78mi |
| 401 Ridgewood Ln Montgomery, AL | 3.0 | 2.0 | 1513 | $1,195 | $0.79 | 21d | 1 | 0.80mi |
| 311 Bradley Dr Montgomery, AL | 3.0 | 1.0 | 1104 | $825 | $0.75 | 43d | 1 | 0.82mi |
| 239 Forest Hills Dr Montgomery, AL | 4.0 | 1.5 | 1500 | $1,450 | $0.97 | 21d | 1 | 0.83mi |
| 1827 Capitol Ave Montgomery, AL | 2.0 | 1.0 | 1068 | $1,600 | $1.50 | 13d | 1 | 0.88mi |
| 1827 Capitol Ave Montgomery, AL | 2.0 | 1.0 | 1068 | $1,600 | $1.50 | 43d | 1 | 0.88mi |
| 2001 Speigle St Montgomery, AL | 3.0 | 1.0 | 1260 | $1,035 | $0.82 | 43d | 1 | 0.90mi |
| 3233 Hillcrest Ln Montgomery, AL | 3.0 | 2.0 | 1278 | $1,395 | $1.09 | 21d | 1 | 0.91mi |
| 3515 Cottonwood Dr Montgomery, AL | 3.0 | 1.5 | 1246 | $1,350 | $1.08 | 43d | 1 | 0.93mi |
| 508 Glenmore Rd Montgomery, AL | 2.0 | 1.0 | 1135 | $1,000 | $0.88 | 43d | 1 | 0.97mi |
| 942 Parkwood Ct Montgomery, AL | 4.0 | 2.0 | 1752 | $1,299 | $0.74 | 13d | 1 | 0.97mi |
| 740 Coliseum Blvd Unit 740A Montgomery, AL | 2.0 | 1.0 | 1100 | $895 | $0.81 | 13d | 1 | 1.03mi |
| 2019 Amos St Montgomery, AL | 3.0 | 1.5 | 1134 | $985 | $0.87 | 43d | 1 | 1.05mi |
| 3462 Biltmore Ave Montgomery, AL | 3.0 | 2.0 | 1685 | $1,225 | $0.73 | 21d | 1 | 1.05mi |
| 3309 Hillcrest Ln Unit 1043908P Montgomery, AL | 4.0 | 2.0 | 1625 | $2,885 | $1.78 | 21d | 1 | 1.08mi |
| 39 S Lewis St Montgomery, AL | 2.0 | 1.0 | 1209 | $950 | $0.79 | 43d | 1 | 1.08mi |
| 128 S Capitol Pkwy Montgomery, AL | 3.0 | 1.0 | 1550 | $1,500 | $0.97 | 43d | 1 | 1.10mi |
| 1501 Winona Ave Montgomery, AL | 2.0 | 1.0 | 1930 | $1,000 | $0.52 | 21d | 1 | 1.12mi |
| 2076 Midway St Montgomery, AL | 3.0 | 1.0 | 1068 | $1,000 | $0.94 | 43d | 1 | 1.12mi |
| 2056 Midway St Montgomery, AL | 3.0 | 1.0 | 1110 | $985 | $0.89 | 43d | 1 | 1.14mi |
Listing history 22 events
-
2026-06-18days on market $111,000 Active 52 DOM
-
2026-06-17days on market $111,000 Active 51 DOM
-
2026-06-16days on market $111,000 Active 50 DOM
-
2026-06-15days on market $111,000 Active 49 DOM
-
2026-06-14days on market $111,000 Active 47 DOM
-
2026-06-13days on market $111,000 Active 46 DOM
-
2026-06-10days on market $111,000 Active 44 DOM
-
2026-06-09days on market $111,000 Active 43 DOM
-
2026-06-08days on market $111,000 Active 42 DOM
-
2026-06-07days on market $111,000 Active 41 DOM
-
2026-06-03days on market $111,000 Active 37 DOM
-
2026-06-02days on market $111,000 Active 36 DOM
-
2026-06-01days on market $111,000 Active 35 DOM
-
2026-05-31days on market $111,000 Active 34 DOM
-
2026-05-30days on market $111,000 Active 33 DOM
-
2026-05-14price $111,000 666-char remark
-
2026-04-27$119,900 Active 666-char remark
-
2009-08-06soldstatus $126,773
-
2009-08-05soldstatus $55,000 21-char remark
Show marketing remark (21 chars)
HUD HOMES SOLD AS IS.
-
2009-05-08$37,000 21-char remark
Show marketing remark (21 chars)
HUD HOMES SOLD AS IS.
-
2004-08-27soldstatus $99,500
Show marketing remark (601 chars)
GREAT HOME WITH OLD HOME CHARM AND FEATURES. .TALL CEILINGS. .BIG BEDROOMS. .PLASTER WALLS WITH PICURE MOLD. .LOVELY WOODEN FLOORS IN MOST OF HOME. .SOME WALLS HAVE BEEN PAINTED WITH FAUX FINISH. .FIREPLACE WITH MARBLE MANTEL, TILE SURROUND AND GAS LOGS IN LIVING ROOM. .PART OF ORIGINAL GARAGE HAS BEEN MADE INTO AN OFFICE/BEDROOM AND REMAINDER INTO STORAGE. .LOVELY FRONT PORCH AND COVERED TILED PATIO INVITE OUTDOOR LIVING. .IN LAST TWO YEARS OWNERS HAVE ADDED NEW ROOF, GAS GRILL ON PATIO, STOVE, WATER HEATER, TILED KITCHEN CABINETS, PAINTED INTERIOR AND SOME CARPET. .ELEGANT HOME - MUST VISIT.
-
2004-05-16$99,500
Show marketing remark (601 chars)
GREAT HOME WITH OLD HOME CHARM AND FEATURES. .TALL CEILINGS. .BIG BEDROOMS. .PLASTER WALLS WITH PICURE MOLD. .LOVELY WOODEN FLOORS IN MOST OF HOME. .SOME WALLS HAVE BEEN PAINTED WITH FAUX FINISH. .FIREPLACE WITH MARBLE MANTEL, TILE SURROUND AND GAS LOGS IN LIVING ROOM. .PART OF ORIGINAL GARAGE HAS BEEN MADE INTO AN OFFICE/BEDROOM AND REMAINDER INTO STORAGE. .LOVELY FRONT PORCH AND COVERED TILED PATIO INVITE OUTDOOR LIVING. .IN LAST TWO YEARS OWNERS HAVE ADDED NEW ROOF, GAS GRILL ON PATIO, STOVE, WATER HEATER, TILED KITCHEN CABINETS, PAINTED INTERIOR AND SOME CARPET. .ELEGANT HOME - MUST VISIT.
ⓘ Source: listings_history table (triggers on properties + properties_extension) + one-shot
backfill from property_details.listing_events for pre-trigger history.
Tax reassessment forecast AL · Resets to sale price
- Current annual tax
- $597 · $50/mo
- Projected year-2 tax
- $597 · $50/mo
- Expected delta
- $0/yr ($0/mo · 0.0%)
ⓘ Screening estimate from a state-policy table — verify with the county assessor before closing.
Climate risk First Street
- Flood 4/10 Moderate FEMA zone X (unshaded) · 22% chance over 30 yrs
- Wildfire 1/10 Low
- Heat 7/10 Severe 7 d/yr ≥107°F today · 19 d/yr by 30 yrs out
- Wind 8/10 Severe 80% chance of damaging wind over 30 yrs
- Air quality 3/10 Moderate 4 unhealthy d/yr today · 4 by 30 yrs out
Nearby sold comps map
Loading sold comps map…
Walkable amenities ~0.75 mi
Loading nearby amenities…
Taxation est. · year 1
- Rental income
- $15,335
- − Mortgage interest
- −$6,218
- − Property taxes
- −$597
- − Insurance
- −$555
- − Repairs & maintenance
- −$1,227
- − Management
- −$1,227
- − Depreciation
- −$3,229
- Taxable income
- $2,282
- Est. tax owed @ 24.0%
- −$548
- After-tax cash flow
- $3,429/yr
For passive investors: Depreciation is non-cash, so a rental often shows a tax loss while cash-flowing — sheltering income. Rental losses are passive: they offset passive income freely, and up to $25,000/yr can offset ordinary (W-2) income if you actively participate and your MAGI is under $100k (phasing out to $0 by $150k); unused losses carry forward. On sale, claimed depreciation is recaptured at up to 25%, and gains may owe capital-gains tax (a 1031 exchange can defer both). Figures are a year-1 estimate at your 24.0% rate — not tax advice; consult a CPA.
Schools (NCES district)
- District
- Montgomery County
- NCES district ID
- 0102430
- Math proficiency
- 9% ▼ -21.00%
- Reading proficiency
- 31% ▼ -1.00%
- Median HH income
- $43,902
- Composite
- 17.24/100
- National rank
- #9093
- State rank
- #106 of 129 in AL
Livability — Montgomery
- Score
- 65/100
- State rank
- #138
- US rank
- #13416
Category grades
Schools grade is shown separately in the Schools card above.
Census & demographics
- Census place
- Montgomery, AL
- County
- Montgomery County · 190,016 people
- City population
- 175,913
- Metro
- Montgomery, AL
- Population (ZIP)
- 23,581
- Household income
- $59,193
- Rent vs Own
- Severe rent burden
- 1039.0
Population outlook (Montgomery County) Hauer SSP2
- Today (2025)
- 224,008 people
- By 2030
- 221,460 · -1.1%
- By 2040
- 214,179 · -4.4%
- By 2050
- 204,912 · -8.5%
- By 2075
- 177,821 · -20.6%
- By 2100
- 145,134 · -35.2%
Race, ethnicity, and origin ACS 2023
- Neighborhood character
- Diverse neighborhood (Simpson 0.60)
- Race & ethnicity
- White 49% Black 39% Hispanic / Latino 8% Two or more races 4%
- Hispanic origin (detail)
- Mexican 4%
- Common ancestry
- Slovak 2% Lithuanian 1% Serbian 1%
- Foreign-born
- 4% · Canada, South Korea
- Languages at home
- 94% English-only · Spanish 5%
Political lean MEDSL · Montgomery
- 2024 margin
- Solid D (+30.7) · D 64.8% · R 34.1% · Other 1.1%
- 2008→2024 swing
- +11.5pp toward D · 2008: 19.2pp · 2024: 30.7pp
- All cycles
- 2024: D+30.7 2020: D+31.5 2016: D+26.2 2012: D+24.3 2008: D+19.2
Not yet ingested
- Civics
- —
Market trends
- HPI YoY
- ▼ -37.64%
- Current HPI
- 149.3867
- Rent YoY
- ▲ 2.65%
- Metro
- Montgomery, AL
- State GDP YoY
- ▲ 2.94%
- F500 in state
- 4
Industry mix (Fortune 500 HQ in AL)
| Industry | F500 HQs | Revenue |
|---|---|---|
| Financial Services | 1 | $8B |
|
||
| Healthcare | 1 | $5B |
|
||
Price history
+11.6% since first listed7 events — show timeline
- 2026-05-14 Price Changed $111,000 Greater Alabama MLS
- 2026-04-27 Listed $119,900 Greater Alabama MLS
- 2009-08-06 Sold (Public Records) $126,773 Public Records
- 2009-08-05 Sold (MLS) $55,000 MAAR
- 2009-05-08 Listed $37,000 MAAR
- 2004-08-27 Sold (MLS) $99,500 MAAR
- 2004-05-16 Listed $99,500 MAAR
Property tax history
+4.7%/yrLatest (2025): $597 · +3.9% YoY. Source: county tax records.
Cash-flow waterfall
monthlySold comps — $/sqft
last 12 mo · ≤1 miLoading sold comps…