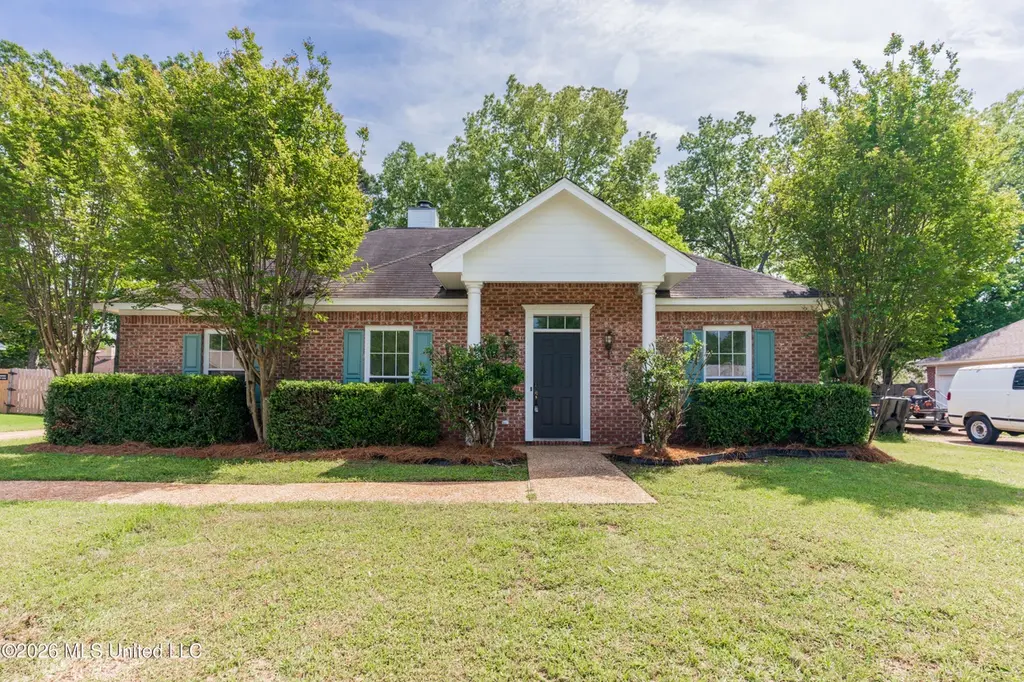
132 Post Oak Dr · Flowood, MS
Flood risk 1/10 · Minimal
- FEMA flood zone
- X (unshaded)
- Chance of flooding over 30 yrs
- 0.0%
- Est. flood insurance / yr
- $507 – $1,088
Fire risk 1/10 · Minimal
- Est. fire insurance / yr
- $1,241 – $2,305
Heat risk 7/10 · Major
- Hot days now (above 108°F)
- 7 days/yr
- Hot days in 30 yrs
- 20 days/yr
Wind risk 7/10 · Major
- Chance of severe wind over 30 yrs
- 78.0%
Air-quality risk 2/10 · Minimal
- Unhealthy air days now
- 1 days/yr
- Unhealthy air days in 30 yrs
- 1 days/yr
Risk factors via First Street. Map © Google.
Why this score? — see what drove the D grade
The composite is a weighted blend of 9 inputs, each scored 0–100. Each bar is that input's sub-score; the figure is the points it added to the 100-point composite (weight × sub-score).
- Cash flow +12.9/30.0
- ARV discount +6.8/15.0
- Schools +4.6/10.0
- DSCR +3.9/10.0
- Livability +3.9/5.0
- Rent growth +3.2/5.0
- 1% rule +3.1/10.0
- Condition / age +2.5/5.0
- Appreciation +0.0/10.0
$250,000
🖨 Deal sheet (PDF) 📄 Offer letter ✓ Due diligence
Listing remarks MLS
WONDERFUL 3BR/2BA SPLIT PLAN IN POPULAR OAK GROVE SUBDIV. OFF OLD FANNIN ROAD... NICE SIZE DEN WITH GAS FIREPLACE, SPACIOUS KITCHEN WITH BREAKFAST AREA OVERLOOKING BACK PATIO... LARGE FENCED BACKYARD... SIDE GARAGE WITH LOTS OF EXTRAS FOR STORAGE AND ORGANIZATION! PRICED TO SELL... OWNERS ARE TRANSFERRING OUT OF STATE! WASHER/DRYER/REFRIGERATOR ALL REMAIN!
Key facts
- Fresh paint
- New flooring
- French doors
Tags
Neighborhood map
What this means for you Summary
Snapshot
- This is a 3-bed/2.0-bath single-family listed at $250k.
Deal economics
- At list price, monthly cash flow is $-19 ($-233/yr) — negative.
- To cash-flow at today's rent, offer at most $247k (1.4% below list).
- To meet the 1% rule (rent ≥ 1% of price), the offer needs to be $202k (19.2% below list).
- Recommended offer: $202k (19.2% below list) — sets the bar for 1% rule.
- Cap rate 6.2% vs local median 4.3% in Flowood — top-decile yield for the area; either an underpriced asset or a hidden risk that comps aren't pricing in. Stress-test before assuming the spread holds.
Location & tenants
- Location reads 77/100 on livability (#10 in MS, #3,075 nationally) — a middle-class / working-renter tenant base. Strengths: crime A+, cost of living A+, housing A+; Watch: amenities F, commute F.
- Rankin County School District (rural): math 56% / reading 48% proficiency, ranked #6 of 130 in MS (top 5%) — acceptable for families but not a draw, mixed tenant base, ~2y average lease.
- Zoned schools: Flowood Elementary School (math 48% / reading 51%, grade D, #65 of 375 statewide, top 20%, 489 students, 99% FRL); Northwest Rankin Middle School (math 63% / reading 51%, grade B, #13 of 179 statewide, top 7%, 1,374 students, 100% FRL); Northwest Rankin High School (math 48% / reading 42%, grade D-, #34 of 197 statewide, top 17%, 1,898 students, 100% FRL) — zoned schools average 100% FRL vs 35% district-wide (65 pts higher); higher-poverty schools than district average — tighter screening recommended.
- Market conditions: Rents rising (+2.9%/yr); 440 active listings in the ZIP; 9 comparable units currently listed for rent nearby; rentals at typical pace (median 25d on market — plan ~3-4 weeks tenant-placement turnaround); 44% of comp listings sitting > 30 days — soft ceiling on asking rent; solid renter incomes; 343 units permitted in Rankin County in 2024 (0 in 5+ unit buildings).
Forward outlook
- Local home prices are declining (-3.0%/yr); year-one equity from $2k of loan paydown is wiped out by about $8k of value loss. Plan a longer hold.
- Rankin County population projected at +17% by 2050 — long-run rental-demand tailwind backs the buy-and-hold thesis.
Negotiation context
- Only 5 days on market — expect competitive offers; lowballing is unlikely to land.
- 3 sale attempts since 21y ago with the ask held roughly flat each time — persistent listings suggest the price (not the market) is what's stuck; bring a comps-based counter.
Risks & watch-outs
- Climate carrying-cost: major wind risk, 78% chance of damaging wind over 30y; extreme-heat days projected 7→20/yr by 2055 (HVAC capex compounding) — expect insurance premiums to compound above CPI over the hold.
Questions for the listing agent
- What do current leases actually rent for vs. the listed asking? Can we see a recent rent roll and the last 12 months of T-12 income?
- Is there a deadline driving the sale (1031 exchange, divorce, estate, relocation)? That informs how much negotiation room exists.
- Schools are B-rated — typically a magnet for longer-tenancy family renters. What's the average tenant stay here, and is there a school-zone premium baked into asking?
- The area grade is low — what's the realistic commute time and amenity access for the typical tenant pool here? Any planned neighborhood developments (good or bad) we should know about?
- What's the average days-on-market for RENTAL listings here right now (not sales)? A rising rental-DOM trend means longer vacancies and softer asking-rent achievability than the comps imply.
- What's the recent tenant-quality profile in this submarket — average credit score on applications, eviction rate, late-payment / NSF rate, and stable-employment percentage? A property-management company in the area should have these aggregated.
- How much new for-sale + rental construction is in the pipeline within 1–3 miles? Heavy new supply typically softens prices + rents 12–24 months out; constrained supply supports both.
Investment metrics
- 1% rule
- 0.81% ✗
- Cap rate
- 6.20%
- Cash-on-cash
- -0.33%
- DSCR
- 0.99
- GRM
- 10.3
CMA / ARV
- ARV (on-the-fly)
- $246,006
- Comps found
- 12
Show comp detail 12 sales within ~0.75 mi
| Address | Dist | Beds/Ba | Sqft | Sold | Price | $/sf | Match |
|---|---|---|---|---|---|---|---|
| 132 Post Oak Dr | 0.00mi | 3/2.0 | 1,386 (-2%) | 1mo | $250,000 | $180 | 95 |
| 129 Post Oak Dr | 0.05mi | 3/2.0 | 1,405 (-1%) | 2mo | $240,000 | $171 | 94 |
| 222 Cherrybark Ln | 0.06mi | 3/2.0 | 1,340 (-6%) | 3mo | $240,000 | $179 | 86 |
| 1401 Barnett Bend Cir | 0.46mi | 3/2.0 | 1,438 (+1%) | 3mo | $239,900 | $167 | 74 |
| 300 White Oak Dr | 0.43mi | 3/2.0 | 1,472 (+4%) | 4mo | $255,000 | $173 | 71 |
| 344 White Oak Dr | 0.36mi | 3/2.0 | 1,323 (-7%) | 2mo | $244,000 | $184 | 70 |
| 188 Oak Grove Dr | 0.36mi | 3/2.0 | 1,570 (+10%) | 1mo | $264,900 | $169 | 66 |
| 301 White Oak Dr | 0.46mi | 3/2.0 | 1,558 (+10%) | 3mo | $279,500 | $179 | 60 |
| 810 Windlass Cv | 0.68mi | 3/2.0 | 1,473 (+4%) | 6mo | $249,995 | $170 | 57 |
| 214 Chinkapen Dr | 0.41mi | 3/2.0 | 1,634 (+15%) | 3mo | $282,000 | $173 | 53 |
| 164 Regatta Dr | 0.69mi | 3/2.0 | 1,566 (+10%) | 0mo | $280,000 | $179 | 51 |
| 311 Camber Ct | 0.69mi | 3/2.0 | 1,625 (+14%) | 2mo | $278,500 | $171 | 42 |
Match score weights: distance 35% · size 25% · config 20% · recency 20%. Top-matched comps best support the ARV.
Projected returns pro-forma
-3.0% appreciation · 2.9% rent growth · sell at horizon
- IRR
- -17.0%
- Equity multiple
- 0.40×
- Total profit
- $-41,991
- Equity at exit
- $37,276
- IRR
- -9.1%
- Equity multiple
- 0.44×
- Total profit
- $-39,147
- Equity at exit
- $21,615
Cash invested: $70,000 (down + closing). Projections, not guarantees.
Landlord ↔ Tenant lean methodology
- Overall (STATE)
- 90 Strongly Landlord-Friendly
- State Mississippi
- 90 Strongly Landlord-Friendly · R+11
- County
- — inherits STATE
- City
- — inherits STATE
ZIP-level market 39047
- Home prices YoY
- -32.6%
- Rents YoY
- 2.9%
- Active inventory
- 440
- Price-to-rent
- 10.3×
Monthly cashflow live
- Estimated rent
- $2,020 high interval (Pro) →
- Mortgage (P&I)
- −$1,311
- Tax from tax record
- −$200 /mo · $2,405/yr
- Insurance
- −$104
- HOA
- −$0
- Vacancy / Maint / Mgmt
- −$424
- Net cashflow
- $-19
Break-even live
Sensitivity live
| Price | -10% $122 | -5% $51 | +0% $-19 | +5% $-90 | +10% $-161 |
|---|---|---|---|---|---|
| Rent | -10% $-179 | -5% $-99 | +0% $-19 | +5% $60 | +10% $140 |
| Rate | -1.0pp $106 | -0.5pp $44 | base $-19 | +0.5pp $-84 | +1.0pp $-150 |
UW: 25.0% down · 7.5% · 30yr · 1.5% tax · 5.0% vac · 8.0% maint · 8.0% mgmt
Financing live
Cash to close
- Down payment
- $62,500
- Closing costs
- $7,500
- Reserves months
- —
- Total cash needed
- —
Loan-product check · same deal, 3 products live
Conventional
25% down · 7.5% · 30yr
- Down + closing
- —
- Monthly P&I
- —
- Monthly cashflow
- —
- DSCR
- —
- Eligible?
- —
Personal DTI + credit; lowest rate.
DSCR
20% down · 8.5% · 30yr
- Down + closing
- —
- Monthly P&I
- —
- Monthly cashflow
- —
- DSCR
- —
- Eligible?
- —
No personal income docs; deal must DSCR.
Hard money
10% down · 12.0% · 12mo
- Down + closing
- —
- Monthly P&I
- —
- Monthly cashflow
- —
- DSCR
- —
- Eligible?
- —
Short-term bridge; refi at stabilization.
Rent comps 9 comps
| Address | Beds | Baths | Sqft | Rent | $/sqft | DOM | Units | Dist |
|---|---|---|---|---|---|---|---|---|
| 1204 Barnett Bend Cir Brandon, MS | 2.0 | 2.0 | 1127 | $1,625 | $1.44 | 23d | 1 | 0.50mi |
| 111 Lakeshore Dr Brandon, MS | 1.0–3.0 | 1.0–2.0 | 974 | $2,218 | $2.28 | 15d | 8 | 0.55mi |
| 500 Avalon Way Brandon, MS | 2.0–3.0 | 2.0 | 1287 | $2,052 | $1.59 | 15d | 6 | 0.86mi |
| 352 Brendalwood Cv Brandon, MS | 2.0 | 1.5 | 1248 | $1,157 | $0.93 | 45d | 1 | 0.96mi |
| 301 Jasmine Ct Brandon, MS | 3.0 | 2.0 | 1805 | $2,200 | $1.22 | 45d | 1 | 1.09mi |
| 833 Harbor Bend Dr Unit 1 Brandon, MS | 2.0 | 1.5 | 1000 | $1,495 | $1.50 | 45d | 1 | 1.21mi |
| 839 Harbor Bend Dr Unit 1 Brandon, MS | 2.0 | 1.5 | 1000 | $1,295 | $1.29 | 45d | 1 | 1.21mi |
| 154 Plum Tree Rd Brandon, MS | 3.0 | 2.0 | 1289 | $1,931 | $1.50 | 25d | 1 | 1.44mi |
| 74 Lake Barnett Dr Brandon, MS | 2.0 | 2.0 | 1156 | $2,500 | $2.16 | 15d | 1 | 1.48mi |
Listing history 7 events
-
2026-04-13status Pending
-
2026-04-08$250,000 Active
-
2009-07-17soldstatus 358-char remark
Show marketing remark (358 chars)
WONDERFUL 3BR/2BA SPLIT PLAN IN POPULAR OAK GROVE SUBDIV. OFF OLD FANNIN ROAD... NICE SIZE DEN WITH GAS FIREPLACE, SPACIOUS KITCHEN WITH BREAKFAST AREA OVERLOOKING BACK PATIO... LARGE FENCED BACKYARD... SIDE GARAGE WITH LOTS OF EXTRAS FOR STORAGE AND ORGANIZATION! PRICED TO SELL... OWNERS ARE TRANSFERRING OUT OF STATE! WASHER/DRYER/REFRIGERATOR ALL REMAIN!
-
2009-04-30$149,900 358-char remark
Show marketing remark (358 chars)
WONDERFUL 3BR/2BA SPLIT PLAN IN POPULAR OAK GROVE SUBDIV. OFF OLD FANNIN ROAD... NICE SIZE DEN WITH GAS FIREPLACE, SPACIOUS KITCHEN WITH BREAKFAST AREA OVERLOOKING BACK PATIO... LARGE FENCED BACKYARD... SIDE GARAGE WITH LOTS OF EXTRAS FOR STORAGE AND ORGANIZATION! PRICED TO SELL... OWNERS ARE TRANSFERRING OUT OF STATE! WASHER/DRYER/REFRIGERATOR ALL REMAIN!
-
2005-06-09soldstatus
-
2005-06-01soldstatus 232-char remark
Show marketing remark (232 chars)
Your eyes will sparkle with delight upon viewing this immaculate 3/2 split plan. A great neighborhood,spacious backyard, and well-cared for home are not even a few of the amenities this home offers. There are just tooo many to list.
-
2005-04-28$143,750 232-char remark
Show marketing remark (232 chars)
Your eyes will sparkle with delight upon viewing this immaculate 3/2 split plan. A great neighborhood,spacious backyard, and well-cared for home are not even a few of the amenities this home offers. There are just tooo many to list.
ⓘ Source: listings_history table (triggers on properties + properties_extension) + one-shot
backfill from property_details.listing_events for pre-trigger history.
Tax reassessment forecast MS · Resets to sale price
- Current annual tax
- $2,405 · $200/mo
- Projected year-2 tax
- $2,405 · $200/mo
- Expected delta
- $0/yr ($0/mo · 0.0%)
ⓘ Screening estimate from a state-policy table — verify with the county assessor before closing.
Climate risk First Street
- Flood 1/10 Low FEMA zone X (unshaded) · 0% chance over 30 yrs
- Wildfire 1/10 Low
- Heat 7/10 Severe 7 d/yr ≥108°F today · 20 d/yr by 30 yrs out
- Wind 7/10 Severe 78% chance of damaging wind over 30 yrs
- Air quality 2/10 Low 1 unhealthy d/yr today · 1 by 30 yrs out
Nearby sold comps map
Loading sold comps map…
Walkable amenities ~0.75 mi
Loading nearby amenities…
Taxation est. · year 1
- Rental income
- $24,245
- − Mortgage interest
- −$14,004
- − Property taxes
- −$2,405
- − Insurance
- −$1,250
- − Repairs & maintenance
- −$1,940
- − Management
- −$1,940
- − Depreciation
- −$7,273
- Taxable loss
- −$4,565
- Est. tax savings @ 24.0%
- +$1,096
- After-tax cash flow
- $862/yr
For passive investors: Depreciation is non-cash, so a rental often shows a tax loss while cash-flowing — sheltering income. Rental losses are passive: they offset passive income freely, and up to $25,000/yr can offset ordinary (W-2) income if you actively participate and your MAGI is under $100k (phasing out to $0 by $150k); unused losses carry forward. On sale, claimed depreciation is recaptured at up to 25%, and gains may owe capital-gains tax (a 1031 exchange can defer both). Figures are a year-1 estimate at your 24.0% rate — not tax advice; consult a CPA.
Schools (NCES district)
- District
- Rankin County School District
- NCES district ID
- 2803830
- Math proficiency
- 56% ▼ -4.00%
- Reading proficiency
- 48% ▼ -6.00%
- Median HH income
- $61,867
- Composite
- 45.62/100
- National rank
- #2587
- State rank
- #6 of 130 in MS
Livability — Flowood
- Score
- 77/100
- State rank
- #10
- US rank
- #3075
Category grades
Schools grade is shown separately in the Schools card above.
Census & demographics
- County
- Rankin County · 123,614 people
- City population
- 9,222
- Metro
- Jackson, MS
- Population (ZIP)
- 40,808
- Household income
- $100,347
- Rent vs Own
- Severe rent burden
- 551.0
Population outlook (Rankin County) Hauer SSP2
- Today (2025)
- 164,317 people
- By 2030
- 171,013 · +4.1%
- By 2040
- 182,723 · +11.2%
- By 2050
- 192,376 · +17.1%
- By 2075
- 209,535 · +27.5%
- By 2100
- 209,534 · +27.5%
Race, ethnicity, and origin ACS 2023
- Neighborhood character
- Predominantly White (77%)
- Race & ethnicity
- White 77% Black 16% Two or more races 4% Hispanic / Latino 2% Asian 1%
- Common ancestry
- Italian 4% Slovak 3% Serbian 3%
- Foreign-born
- 3% · Canada
- Languages at home
- 95% English-only · Spanish 3% Other Indo-European 1% Other Asian/Pacific 1%
Political lean MEDSL · Rankin
- 2024 margin
- Solid R (+47.1) · D 25.9% · R 73.0% · Other 1.0%
- 2008→2024 swing
- +6.4pp toward D · 2008: -53.5pp · 2024: -47.1pp
- All cycles
- 2024: R+47.1 2020: R+45.4 2016: R+52.9 2012: R+51.9 2008: R+53.5
Not yet ingested
- Civics
- —
Market trends
- HPI YoY
- ▼ -79.01%
- Current HPI
- 162.9709
- Rent YoY
- ▲ 2.90%
- Metro
- Jackson, MS
- State GDP YoY
- —
- F500 in state
- 0
Price history
+73.9% since first listed7 events — show timeline
- 2026-04-13 Pending — MLSU
- 2026-04-08 Listed $250,000 MLSU
- 2009-07-17 Sold (MLS) — MLSU
- 2009-04-30 Listed $149,900 MLSU
- 2005-06-09 Sold (Public Records) — Public Records
- 2005-06-01 Sold (MLS) — MLSU
- 2005-04-28 Listed $143,750 MLSU
Property tax history
+2.1%/yrLatest (2025): $2,405 · +2.2% YoY. Source: county tax records.
Cash-flow waterfall
monthlySold comps — $/sqft
last 12 mo · ≤1 miLoading sold comps…