80 Harvey Rd · Ridgefield, CT
Flood risk 1/10 · Minimal
- FEMA flood zone
- X (unshaded)
- Chance of flooding over 30 yrs
- 0.0%
- Est. flood insurance / yr
- $473 – $860
Fire risk 3/10 · Minor
- Est. fire insurance / yr
- $829 – $1,539
Heat risk 4/10 · Minor
- Hot days now (above 98°F)
- 7 days/yr
- Hot days in 30 yrs
- 14 days/yr
Wind risk 5/10 · Moderate
- Chance of severe wind over 30 yrs
- 25.0%
Air-quality risk 4/10 · Minor
- Unhealthy air days now
- 3 days/yr
- Unhealthy air days in 30 yrs
- 5 days/yr
Risk factors via First Street. Map © Google.
Why this score? — see what drove the D- grade
The composite is a weighted blend of 9 inputs, each scored 0–100. Each bar is that input's sub-score; the figure is the points it added to the 100-point composite (weight × sub-score).
- ARV discount +14.1/15.0
- Schools +7.1/10.0
- Cash flow +5.1/30.0
- Livability +3.9/5.0
- Rent growth +2.5/5.0
- Condition / age +2.5/5.0
- 1% rule +0.5/10.0
- DSCR +0.0/10.0
- Appreciation +0.0/10.0
$799,999
🖨 Deal sheet (PDF) 📄 Offer letter ✓ Due diligence
Listing remarks
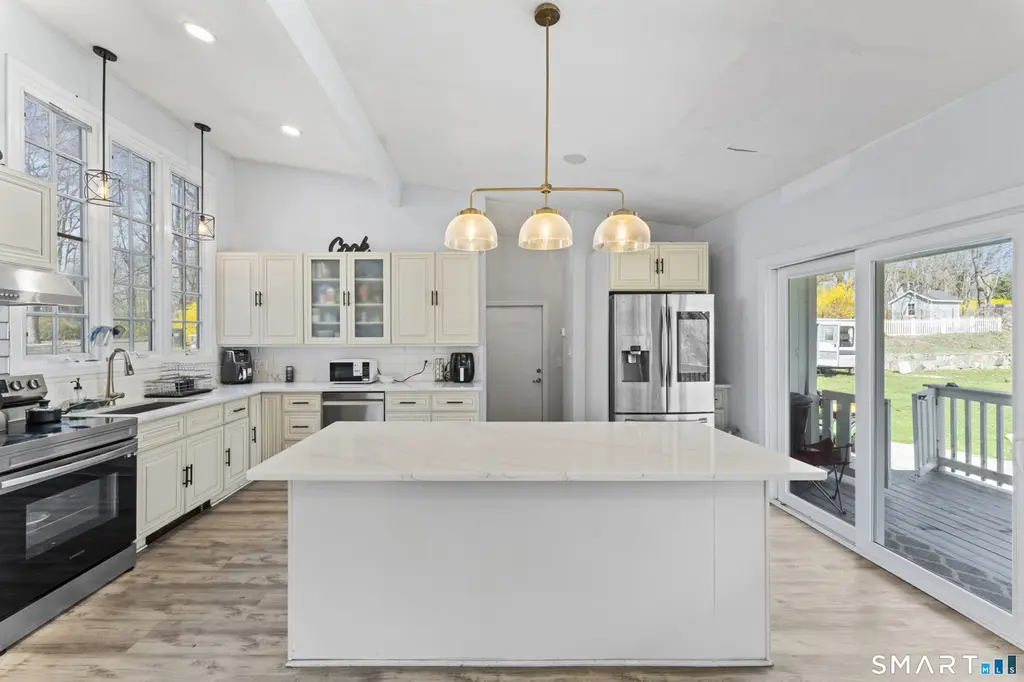
NOW Priced to Sell! Bring your Vision and TLC. Set privately on 1.56 acres, this striking contemporary-style home at 80 Harvey Road blends modern design with everyday comfort, offering a light-filled retreat just minutes from town. Featuring 3 bedrooms, 2 full bathrooms, and 2,312 square feet, the home delivers clean architectural lines, open flow, and a seamless connection to its natural surroundings. Inside, hardwood floors run throughout, leading into a stunning, recently updated kitchen that serves as the centerpiece of the home, designed with both style and functionality in mind. Expansive windows and a bright, airy layout create a true indoor-outdoor feel, filling the home with natura
Key facts
- 1.56 acre lot
- Pool
- Built 1963
Property features AI
Finance
- Financial info: Assessed value reported
Exterior
- Utilities: Water from private well; Septic sewer; Oil hot water
- Home design: Single-family home
- Construction: Wood frame construction; Concrete foundation; Asphalt shingle roof; Built-in living area approximately 1612 (public record)
- Exterior features: Level, cleared lot; Private well; Septic system; In-ground vinyl saltwater pool
Interior
- Kitchen: Electric cooktop; Refrigerator; Dishwasher
- Bedrooms: Three bedrooms
- Bathrooms: Two full bathrooms
- Heating & cooling: Hot water heating; Oil-fired hot water system; Above-ground fuel tank
- Interior features: Seven total rooms; Possible in-law apartment with lower level access; One fireplace; Full, partially finished walk-out basement
- Laundry & utility: Main-level laundry located off the kitchen; Washer and dryer included
Neighborhood map
What this means for you Summary
Snapshot
- This is a 3-bed/2.0-bath single-family listed at $800k.
Deal economics
- At list price, monthly cash flow is $-2k ($-22k/yr) — negative.
- To cash-flow at today's rent, offer at most $472k (41.0% below list).
- To meet the 1% rule (rent ≥ 1% of price), the offer needs to be $439k (45.1% below list).
- Recommended offer: $439k (45.1% below list) — sets the bar for 1% rule.
- Cap rate 3.5% vs local median 2.5% in Ridgefield — top-decile yield for the area; either an underpriced asset or a hidden risk that comps aren't pricing in. Stress-test before assuming the spread holds.
Location & tenants
- Location reads 78/100 on livability (#38 in CT, #2,615 nationally) — a middle-class / working-renter tenant base. Strengths: crime A+, employment A+, commute A-; Watch: amenities F, cost of living F.
- Ridgefield School District (suburban): math 69% / reading 79% proficiency, ranked #6 of 153 in CT (top 4%) — strong family-tenant draw, lease renewals of 3-5y typical; only 2% free/reduced lunch — higher-income household profile.
- Zoned schools: Farmingville Elementary School (math 77% / reading 87%, grade A+, #11 of 553 statewide, top 3%, 314 students, 3% FRL); East Ridge Middle School (math 68% / reading 75%, grade A, #10 of 175 statewide, top 6%, 495 students, 8% FRL); Ridgefield High School (math 66% / reading 91%, grade A-, #7 of 194 statewide, top 3%, 1,474 students, 7% FRL) — zoned schools at 6% FRL track the district average.
- Market conditions: 143 active listings in the ZIP; 3 comparable units currently listed for rent nearby; rentals leasing fast (median 5d on market — plan ~1-2 weeks tenant-placement turnaround); high-income renter base; 1,151 units permitted in Western Connecticut Planning Region in 2024 (714 in 5+ unit buildings).
Forward outlook
- Local home prices are declining (-3.0%/yr); year-one equity from $6k of loan paydown is wiped out by about $24k of value loss. Plan a longer hold.
Negotiation context
- It's been on market 34 days — a 3% lower offer ($776k) is reasonable based on typical stale-listing flexibility.
- 9 sale attempts since 18y ago; this cycle's ask has dropped $150k (16%) from the opening price — seller is motivated, your offer sets the floor, not the list.
- Current owner paid $230k; list at $800k implies a 248% gain — meaningful room to come down on a strong offer.
Risks & watch-outs
- Climate carrying-cost: moderate wind risk, 25% chance of damaging wind over 30y — expect insurance premiums to compound above CPI over the hold.
Questions for the listing agent
- What do current leases actually rent for vs. the listed asking? Can we see a recent rent roll and the last 12 months of T-12 income?
- It's been on market 34 days. Have you received any prior offers? Is the seller open to a 45% concession, seller financing, or rate buy-down credit?
- Built in 1963 — when were the roof, HVAC, electrical panel, plumbing, and water heater last replaced?
- Is there a deadline driving the sale (1031 exchange, divorce, estate, relocation)? That informs how much negotiation room exists.
- Schools are A-rated — typically a magnet for longer-tenancy family renters. What's the average tenant stay here, and is there a school-zone premium baked into asking?
- The area grade is low — what's the realistic commute time and amenity access for the typical tenant pool here? Any planned neighborhood developments (good or bad) we should know about?
- What's the average days-on-market for RENTAL listings here right now (not sales)? A rising rental-DOM trend means longer vacancies and softer asking-rent achievability than the comps imply.
- What's the recent tenant-quality profile in this submarket — average credit score on applications, eviction rate, late-payment / NSF rate, and stable-employment percentage? A property-management company in the area should have these aggregated.
- How much new for-sale + rental construction is in the pipeline within 1–3 miles? Heavy new supply typically softens prices + rents 12–24 months out; constrained supply supports both.
Investment metrics
- 1% rule
- 0.55% ✗
- Cap rate
- 3.51%
- Cash-on-cash
- -9.94%
- DSCR
- 0.56
- GRM
- 15.2
CMA / ARV
- ARV (median comp)
- $937,920
- List price
- $799,999
- Delta
- -14.70%
- Verdict
- UNDERPRICED
- Comps
- 20 within 1.0 mi
Show comp detail 2 sales within ~0.75 mi
| Address | Dist | Beds/Ba | Sqft | Sold | Price | $/sf | Match |
|---|---|---|---|---|---|---|---|
| 72 Harvey Rd | 0.04mi | 3/2.0 | 1,632 (+1%) | 18mo | $680,000 | $417 | 81 |
| 95 Ridgewood Rd | 0.10mi | 4/2.0 (+1) | 1,754 (+9%) | 5mo | $830,000 | $473 | 71 |
Match score weights: distance 35% · size 25% · config 20% · recency 20%. Top-matched comps best support the ARV.
Projected returns pro-forma
-3.0% appreciation · 3.0% rent growth · sell at horizon
- IRR
- -34.2%
- Equity multiple
- -0.11×
- Total profit
- $-247,903
- Equity at exit
- $119,282
- IRR
- -43.4%
- Equity multiple
- -0.64×
- Total profit
- $-368,322
- Equity at exit
- $69,169
Cash invested: $224,000 (down + closing). Projections, not guarantees.
Landlord ↔ Tenant lean methodology
- Overall (STATE)
- 27 Tenant-Leaning
- State Connecticut
- 27 Tenant-Leaning · D+7
- County
- — inherits STATE
- City
- — inherits STATE
ZIP-level market 06877
- Active inventory
- 143
- Price-to-rent
- 15.2×
Monthly cashflow live
- Estimated rent
- $4,392 medium interval (Pro) →
- Mortgage (P&I)
- −$4,195
- Tax from tax record
- −$797 /mo · $9,564/yr
- Insurance
- −$333
- HOA
- −$0
- Vacancy / Maint / Mgmt
- −$922
- Net cashflow
- $-1,856
Break-even live
Sensitivity live
| Price | -10% $-1,403 | -5% $-1,630 | +0% $-1,856 | +5% $-2,082 | +10% $-2,309 |
|---|---|---|---|---|---|
| Rent | -10% $-2,203 | -5% $-2,029 | +0% $-1,856 | +5% $-1,683 | +10% $-1,509 |
| Rate | -1.0pp $-1,453 | -0.5pp $-1,653 | base $-1,856 | +0.5pp $-2,063 | +1.0pp $-2,274 |
UW: 25.0% down · 7.5% · 30yr · 1.5% tax · 5.0% vac · 8.0% maint · 8.0% mgmt
Financing live
Cash to close
- Down payment
- $200,000
- Closing costs
- $24,000
- Reserves months
- —
- Total cash needed
- —
Loan-product check · same deal, 3 products live
Conventional
25% down · 7.5% · 30yr
- Down + closing
- —
- Monthly P&I
- —
- Monthly cashflow
- —
- DSCR
- —
- Eligible?
- —
Personal DTI + credit; lowest rate.
DSCR
20% down · 8.5% · 30yr
- Down + closing
- —
- Monthly P&I
- —
- Monthly cashflow
- —
- DSCR
- —
- Eligible?
- —
No personal income docs; deal must DSCR.
Hard money
10% down · 12.0% · 12mo
- Down + closing
- —
- Monthly P&I
- —
- Monthly cashflow
- —
- DSCR
- —
- Eligible?
- —
Short-term bridge; refi at stabilization.
Rent comps 3 comps
| Address | Beds | Baths | Sqft | Rent | $/sqft | DOM | Units | Dist |
|---|---|---|---|---|---|---|---|---|
| 137 Florida Hill Rd Ridgefield, CT | 3.0 | 2.0 | 1489 | $4,600 | $3.09 | 4d | 1 | 0.33mi |
| 34 Bailey Ave Ridgefield, CT | 2.0 | 2.0 | 1100 | $3,960 | $3.60 | 4d | 4 | 1.42mi |
| 2 Island Hill Ave Unit 1 Ridgefield, CT | 2.0 | 1.0 | 1200 | $3,200 | $2.67 | 21d | 1 | 1.47mi |
Listing history 23 events
-
2026-05-05price $799,999 1489-char remark
-
2026-04-30price $879,000 1489-char remark
-
2026-04-24$949,900 Active 1489-char remark
-
2026-04-18historical $949,900 1489-char remark
-
2023-07-02historical
-
2023-05-08$890,000 Active
-
2022-07-31historical
-
2022-06-05price $775,000
-
2022-05-17$699,000 Active
-
2021-11-23historical
-
2021-11-07price $619,000
-
2021-10-16$639,000 Active
-
2021-03-03historical
-
2021-01-05$599,000 Active
-
2020-12-15historical
-
2020-11-05$649,900 Active
-
2020-01-15soldstatus $230,000
-
2009-09-17soldstatus $320,000
-
2009-08-12historical
-
2009-05-26$345,000
-
2008-12-11$549,900
-
2008-11-29historical
-
2008-05-29$699,000
ⓘ Source: listings_history table (triggers on properties + properties_extension) + one-shot
backfill from property_details.listing_events for pre-trigger history.
Tax reassessment forecast CT · Partial reset (capped growth)
- Current annual tax
- $9,564 · $797/mo
- Projected year-2 tax
- $13,342 · $1,112/mo
- Expected delta
- +$3,778/yr (+$315/mo · 39.5%)
ⓘ Screening estimate from a state-policy table — verify with the county assessor before closing.
Climate risk First Street
- Flood 1/10 Low FEMA zone X (unshaded) · 0% chance over 30 yrs
- Wildfire 3/10 Moderate
- Heat 4/10 Moderate 7 d/yr ≥98°F today · 14 d/yr by 30 yrs out
- Wind 5/10 Major 25% chance of damaging wind over 30 yrs
- Air quality 4/10 Moderate 3 unhealthy d/yr today · 5 by 30 yrs out
Nearby sold comps map
Loading sold comps map…
Walkable amenities ~0.75 mi
Loading nearby amenities…
Taxation est. · year 1
- Rental income
- $52,703
- − Mortgage interest
- −$44,812
- − Property taxes
- −$9,564
- − Insurance
- −$4,000
- − Repairs & maintenance
- −$4,216
- − Management
- −$4,216
- − Depreciation
- −$23,273
- Taxable loss
- −$37,379
- Est. tax savings @ 24.0%
- +$8,971
- After-tax cash flow
- $-13,301/yr
For passive investors: Depreciation is non-cash, so a rental often shows a tax loss while cash-flowing — sheltering income. Rental losses are passive: they offset passive income freely, and up to $25,000/yr can offset ordinary (W-2) income if you actively participate and your MAGI is under $100k (phasing out to $0 by $150k); unused losses carry forward. On sale, claimed depreciation is recaptured at up to 25%, and gains may owe capital-gains tax (a 1031 exchange can defer both). Figures are a year-1 estimate at your 24.0% rate — not tax advice; consult a CPA.
Schools (NCES district)
- District
- Ridgefield School District
- NCES district ID
- 0903810
- Math proficiency
- 69% ▼ -9.00%
- Reading proficiency
- 79% ▼ -6.00%
- Median HH income
- $140,316
- Composite
- 71.28/100
- National rank
- #231
- State rank
- #6 of 153 in CT
Livability — Ridgefield
- Score
- 78/100
- State rank
- #38
- US rank
- #2615
Category grades
Schools grade is shown separately in the Schools card above.
Census & demographics
- County
- Fairfield County · 765,532 people
- City population
- 25,110
- Metro
- Bridgeport-Stamford-Norwalk, CT
- Population (ZIP)
- 25,110
- Household income
- $179,219
- Rent vs Own
- Severe rent burden
- 365.0
Population outlook (Western Connecticut County) Hauer SSP2
- By 2040
- 685,031
Race, ethnicity, and origin ACS 2023
- Neighborhood character
- Predominantly White (83%)
- Race & ethnicity
- White 83% Two or more races 7% Hispanic / Latino 6% Asian 4% Black 2%
- Hispanic origin (detail)
- Puerto Rican 1% Dominican 1%
- Common ancestry
- Romanian 5% Slovak 2% Lithuanian 2%
- Foreign-born
- 12% · Canada, South Korea, China
- Languages at home
- 85% English-only · Other Indo-European 7% Spanish 3% Russian/Polish/Slavic 2%
Political lean MEDSL · Western Connecticut
- 2024 margin
- D (+19.1) · D 58.8% · R 39.7% · Other 1.6%
- All cycles
- 2024: D+19.1
Not yet ingested
- Civics
- —
Market trends
- HPI YoY
- ▼ -449.63%
- Current HPI
- 234.8817
- Rent YoY
- —
- Metro
- Bridgeport-Stamford-Norwalk, CT
- State GDP YoY
- ▲ 1.06%
- F500 in state
- 38
Industry mix (Fortune 500 HQ in CT)
| Industry | F500 HQs | Revenue |
|---|---|---|
| Industrial Machinery | 4 | $38B |
|
||
| Insurance | 3 | $71B |
|
||
| Financial Services | 2 | $25B |
|
||
| Transportation / Logistics | 2 | $18B |
|
||
| Healthcare | 1 | $247B |
|
||
| Telecommunications | 1 | $55B |
|
||
Price history
+14.4% since first listed24 events — show timeline
- 2026-05-27 Listing Removed — Smart MLS
- 2026-05-05 Price Changed $799,999 Smart MLS
- 2026-04-30 Price Changed $879,000 Smart MLS
- 2026-04-24 Listed $949,900 Smart MLS
- 2026-04-18 Coming Soon — Smart MLS
- 2023-07-02 Listing Removed — Smart MLS
- 2023-05-08 Listed $890,000 Smart MLS
- 2022-07-31 Listing Removed — Smart MLS
- 2022-06-05 Price Changed $775,000 Smart MLS
- 2022-05-17 Listed $699,000 Smart MLS
- 2021-11-23 Listing Removed — Smart MLS
- 2021-11-07 Price Changed $619,000 Smart MLS
- 2021-10-16 Listed $639,000 Smart MLS
- 2021-03-03 Listing Removed — Smart MLS
- 2021-01-05 Listed $599,000 Smart MLS
- 2020-12-15 Listing Removed — Smart MLS
- 2020-11-05 Listed $649,900 Smart MLS
- 2020-01-15 Sold (Public Records) $230,000 Public Records
- 2009-09-17 Sold (MLS) $320,000 Smart MLS
- 2009-08-12 Listing Removed — Smart MLS
- 2009-05-26 Listed $345,000 Smart MLS
- 2008-12-11 Listed $549,900 Smart MLS
- 2008-11-29 Listing Removed — Smart MLS
- 2008-05-29 Listed $699,000 Smart MLS
Property tax history
+1.2%/yrLatest (2022): $9,564 · +0.8% YoY. Source: county tax records.
Cash-flow waterfall
monthlySold comps — $/sqft
last 12 mo · ≤1 miLoading sold comps…