1911 Lost Greens Dr · Penitas, TX
Flood risk 1/10 · Minimal
- FEMA flood zone
- X
- Chance of flooding over 30 yrs
- 0.0%
- Est. flood insurance / yr
- $507 – $1,088
Fire risk 7/10 · Major
- Est. fire insurance / yr
- $1,222 – $2,270
Heat risk 9/10 · Severe
- Hot days now (above 112°F)
- 6 days/yr
- Hot days in 30 yrs
- 19 days/yr
Wind risk 8/10 · Major
- Chance of severe wind over 30 yrs
- 94.0%
Air-quality risk 1/10 · Minimal
- Unhealthy air days now
- 0 days/yr
- Unhealthy air days in 30 yrs
- 0 days/yr
Risk factors via First Street. Map © Google.
Why this score? — see what drove the D+ grade
The composite is a weighted blend of 9 inputs, each scored 0–100. Each bar is that input's sub-score; the figure is the points it added to the 100-point composite (weight × sub-score).
- Cash flow +15.5/30.0
- ARV discount +13.5/15.0
- DSCR +4.8/10.0
- 1% rule +4.0/10.0
- Livability +3.2/5.0
- Rent growth +2.7/5.0
- Condition / age +2.5/5.0
- Schools +1.9/10.0
- Appreciation +0.0/10.0
$125,000
🖨 Deal sheet 📄 Offer letter ✓ Due diligence
Listing remarks MLS
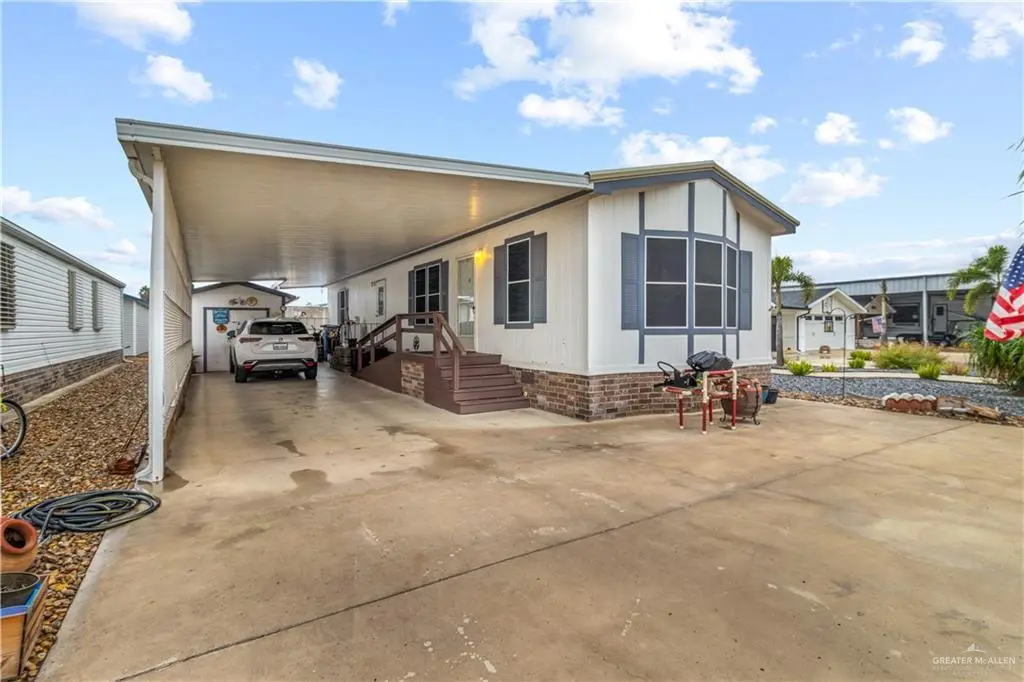
Discover comfort and convenience in this charming 2-bedroom, 2-bath home located in a peaceful 55+ community in Mission, TX. Nestled in a quiet neighborhood with well-maintained surroundings, this property offers a low-maintenance lifestyle with access to fantastic amenities, including a clubhouse, pool privileges, and close proximity to the golf course—perfect for active living and relaxation. The home features a welcoming layout ideal for year-round living or a seasonal retreat. Enjoy the best of community living just minutes from shopping, dining, and local attractions.
Key facts
- Pool privileges
- Clubhouse
- Quiet neighborhood
Tags
Neighborhood map
What this means for you Summary
Snapshot
- This is a 2-bed/2.0-bath manufactured listed at $125k.
Deal economics
- At list price, monthly cash flow is $51 ($611/yr) — positive.
- The deal already cash-flows at list — no discount required.
- To meet the 1% rule (rent ≥ 1% of price), the offer needs to be $112k (10.4% below list).
- Recommended offer: $112k (10.4% below list) — sets the bar for 1% rule.
- Cap rate 6.8% vs local median 3.2% in Penitas — top-decile yield for the area; either an underpriced asset or a hidden risk that comps aren't pricing in. Stress-test before assuming the spread holds.
Location & tenants
- Location reads 64/100 on livability (#820 in TX) — a middle-class / working-renter tenant base. Strengths: cost of living A+, housing A+, crime A; Watch: employment D, schools F, amenities F.
- La Joya ISD (suburban): math 18% / reading 29% proficiency, ranked #759 of 826 in TX (top 92%) — low school quality limits family demand, transient renter base, plan for 1-2y turnover.
- Market conditions: Rents flat; 852 active listings in the ZIP; 13 comparable units currently listed for rent nearby; rentals lingering (median 44d on market — plan ~5-8 weeks vacancy on turnover, expect pricing pressure); 69% of comp listings sitting > 30 days — soft ceiling on asking rent; 7,378 units permitted in Hidalgo County in 2024 (641 in 5+ unit buildings).
Forward outlook
- Local home prices are declining (-3.0%/yr); year-one equity from $864 of loan paydown is wiped out by about $4k of value loss. Plan a longer hold.
- Hidalgo County population projected at +28% by 2050 — long-run rental-demand tailwind backs the buy-and-hold thesis.
Negotiation context
- It's been on market 105 days — a 9% lower offer ($114k) is reasonable based on typical stale-listing flexibility.
- 4 sale attempts since 12y ago with the ask held roughly flat each time — persistent listings suggest the price (not the market) is what's stuck; bring a comps-based counter.
Risks & watch-outs
- Climate carrying-cost: severe wind risk, 94% chance of damaging wind over 30y; major wildfire risk; extreme-heat days projected 6→19/yr by 2055 (HVAC capex compounding) — expect insurance premiums to compound above CPI over the hold.
Questions for the listing agent
- It's been on market 105 days. Have you received any prior offers? Is the seller open to a 10% concession, seller financing, or rate buy-down credit?
- Why hasn't it sold? Are there any deal-killer items the seller is aware of (foundation, flood, title, zoning, code violations)?
- Is there a deadline driving the sale (1031 exchange, divorce, estate, relocation)? That informs how much negotiation room exists.
- Schools are F-rated, which usually means shorter tenancies and higher turnover. Who's the typical renter profile here, and what's been the actual vacancy rate?
- The area grade is low — what's the realistic commute time and amenity access for the typical tenant pool here? Any planned neighborhood developments (good or bad) we should know about?
- What's the average days-on-market for RENTAL listings here right now (not sales)? A rising rental-DOM trend means longer vacancies and softer asking-rent achievability than the comps imply.
- What's the recent tenant-quality profile in this submarket — average credit score on applications, eviction rate, late-payment / NSF rate, and stable-employment percentage? A property-management company in the area should have these aggregated.
- How much new for-sale + rental construction is in the pipeline within 1–3 miles? Heavy new supply typically softens prices + rents 12–24 months out; constrained supply supports both.
Investment metrics
- 1% rule
- 0.90% ✗
- Cap rate
- 6.78%
- Cash-on-cash
- 1.74%
- DSCR
- 1.08
- GRM
- 9.3
CMA / ARV
- ARV (median comp)
- $144,238
- List price
- $125,000
- Delta
- -13.34%
- Verdict
- UNDERPRICED
- Comps
- 20 within 1.0 mi
Show comp detail 11 sales within ~0.75 mi
| Address | Dist | Beds/Ba | Sqft | Sold | Price | $/sf | Match |
|---|---|---|---|---|---|---|---|
| 7410 Birdie Dr | 0.13mi | 2/2.0 | 960 (-1%) | 20mo | $99,900 | $104 | 76 |
| 2404 W Bogey Dr | 0.23mi | 2/2.0 | 896 (-8%) | 3mo | $89,900 | $100 | 74 |
| 7613 Bunker Dr | 0.07mi | 2/2.0 | 909 (-6%) | 15mo | $112,900 | $124 | 74 |
| 7706 Bunker Dr | 0.07mi | 2/2.0 | 1,078 (+11%) | 14mo | $115,500 | $107 | 67 |
| 7305 Bogey Dr | 0.36mi | 1/1.0 (-1) | 976 (+0%) | 9mo | $78,000 | $80 | 66 |
| 7211 Bogey Dr | 0.37mi | 2/2.0 | 896 (-8%) | 6mo | $94,000 | $105 | 64 |
| 7521 Par Dr | 0.17mi | 2/2.0 | 1,080 (+11%) | 16mo | $112,900 | $105 | 60 |
| 2307 W Bogey Dr | 0.28mi | 2/1.0 | 840 (-14%) | 1mo | $112,900 | $134 | 59 |
| 2408 Double Eagle Dr | 0.32mi | 2/1.5 | 832 (-14%) | 2mo | $94,500 | $114 | 58 |
| 7414 Birdie Dr | 0.12mi | 2/2.0 | 1,082 (+11%) | 24mo | $87,000 | $80 | 56 |
| 2507 W Bogey Dr | 0.37mi | 2/2.0 | 832 (-14%) | 20mo | $88,000 | $106 | 42 |
Match score weights: distance 35% · size 25% · config 20% · recency 20%. Top-matched comps best support the ARV.
Projected returns pro-forma
-3.0% appreciation · 0.93% rent growth · sell at horizon
- IRR
- -15.8%
- Equity multiple
- 0.45×
- Total profit
- $-19,302
- Equity at exit
- $18,638
- IRR
- -11.3%
- Equity multiple
- 0.38×
- Total profit
- $-21,638
- Equity at exit
- $10,808
Cash invested: $35,000 (down + closing). Projections, not guarantees.
Landlord ↔ Tenant lean methodology
- Overall (STATE)
- 87 Strongly Landlord-Friendly
- State Texas
- 87 Strongly Landlord-Friendly · R+5
- County
- — inherits STATE
- City
- — inherits STATE
ZIP-level market 78572
- Home prices YoY
- -22.9%
- Rents YoY
- 0.9%
- Active inventory
- 852
- Price-to-rent
- 9.3×
Monthly cashflow live
- Estimated rent
- $1,120 high interval (Pro) →
- Mortgage (P&I)
- −$656
- Tax from tax record
- −$126 /mo · $1,517/yr
- Insurance
- −$52
- HOA
- −$0
- Vacancy / Maint / Mgmt
- −$235
- Net cashflow
- $51
Break-even live
UW: 25.0% down · 7.5% · 30yr · 1.5% tax · 5.0% vac · 8.0% maint · 8.0% mgmt
Financing live
Cash to close
- Down payment
- $31,250
- Closing costs
- $3,750
- Reserves months
- —
- Total cash needed
- —
Loan-product check · same deal, 3 products live
Conventional
25% down · 7.5% · 30yr
- Down + closing
- —
- Monthly P&I
- —
- Monthly cashflow
- —
- DSCR
- —
- Eligible?
- —
Personal DTI + credit; lowest rate.
DSCR
20% down · 8.5% · 30yr
- Down + closing
- —
- Monthly P&I
- —
- Monthly cashflow
- —
- DSCR
- —
- Eligible?
- —
No personal income docs; deal must DSCR.
Hard money
10% down · 12.0% · 12mo
- Down + closing
- —
- Monthly P&I
- —
- Monthly cashflow
- —
- DSCR
- —
- Eligible?
- —
Short-term bridge; refi at stabilization.
Rent comps 13 comps
| Address | Beds | Baths | Sqft | Rent | $/sqft | DOM | Units | Dist |
|---|---|---|---|---|---|---|---|---|
| 2503 Double Eagle Dr Mission, TX | 2.0 | 2.0 | 840 | $1,300 | $1.55 | 43d | 1 | 0.32mi |
| 1908 Kennedy St Mission, TX | 2.0 | 2.0 | 1062 | $1,300 | $1.22 | 23d | 1 | 0.67mi |
| 7220 W Interstate Highway 2 Unit 20 Mission, TX | 2.0 | 2.0 | 1104 | $995 | $0.90 | 43d | 1 | 0.78mi |
| 7220 W Interstate Highway 2 Unit 15 Mission, TX | 1.0 | 1.0 | 945 | $925 | $0.98 | 43d | 1 | 0.78mi |
| 7220 W Interstate Highway 2 Fl STW 1 WITH BALCONY) FRONT UNIT Mission, TX | 1.0 | 1.0 | 945 | $895 | $0.95 | 43d | 1 | 0.78mi |
| 7220 W Interstate Highway 2 Unit 12 Mission, TX | 2.0 | 2.0 | 1104 | $995 | $0.90 | 21d | 1 | 0.78mi |
| 7220 W Interstate Highway 2 Fl STW 3 WITH NO BALCONY) Mission, TX | 1.0 | 1.0 | 945 | $895 | $0.95 | 19d | 1 | 0.79mi |
| 7220 W Interstate Highway 2 Fl STW 4 WITH PORCH) FRONT UNIT Mission, TX | 2.0 | 2.0 | 1104 | $1,150 | $1.04 | 43d | 1 | 0.79mi |
| 109 Ash St Mission, TX | 1.0 | 1.0 | 560 | $800 | $1.43 | 43d | 1 | 0.82mi |
| 3717 Clavel St Unit 8 Palmview, TX | 2.0 | 1.0 | 1005 | $800 | $0.80 | 43d | 1 | 0.83mi |
| 3711 Chapa AVE Palmview, TX | 3.0 | 2.0 | 1050 | $1,300 | $1.24 | 43d | 1 | 0.89mi |
| 3711 Chapa AVE Palmview, TX | 2.0 | 2.0 | 995 | $1,150 | $1.16 | 14d | 1 | 0.89mi |
| 3706 Chapa AVE Palmview, TX | 2.0 | 2.0 | 864 | $1,100 | $1.27 | 43d | 1 | 0.94mi |
Listing history 24 events
-
2026-06-18days on market $125,000 Active 105 DOM
-
2026-06-17days on market $125,000 Active 104 DOM
-
2026-06-16days on market $125,000 Active 103 DOM
-
2026-06-15days on market $125,000 Active 102 DOM
-
2026-06-14days on market $125,000 Active 100 DOM
-
2026-06-13days on market $125,000 Active 99 DOM
-
2026-06-10days on market $125,000 Active 97 DOM
-
2026-06-09days on market $125,000 Active 96 DOM
-
2026-06-08days on market $125,000 Active 95 DOM
-
2026-06-07days on market $125,000 Active 94 DOM
-
2026-06-05days on market $125,000 Active 91 DOM
-
2026-06-03days on market $125,000 Active 90 DOM
-
2026-06-02days on market $125,000 Active 89 DOM
-
2026-06-01days on market $125,000 Active 88 DOM
-
2026-05-31days on market $125,000 Active 87 DOM
-
2026-05-31days on market $125,000 Active 86 DOM
-
2026-04-08price $125,000 590-char remark
Show marketing remark (590 chars)
Discover comfort and convenience in this charming 2-bedroom, 2-bath home located in a peaceful 55+ community in Mission, TX. Nestled in a quiet neighborhood with well-maintained surroundings, this property offers a low-maintenance lifestyle with access to fantastic amenities, including a clubhouse, pool privileges, and close proximity to the golf course—perfect for active living and relaxation. The home features a welcoming layout ideal for year-round living or a seasonal retreat. Enjoy the best of community living just minutes from shopping, dining, and local attractions.
-
2026-03-05$128,000 Active 590-char remark
Show marketing remark (590 chars)
Discover comfort and convenience in this charming 2-bedroom, 2-bath home located in a peaceful 55+ community in Mission, TX. Nestled in a quiet neighborhood with well-maintained surroundings, this property offers a low-maintenance lifestyle with access to fantastic amenities, including a clubhouse, pool privileges, and close proximity to the golf course—perfect for active living and relaxation. The home features a welcoming layout ideal for year-round living or a seasonal retreat. Enjoy the best of community living just minutes from shopping, dining, and local attractions.
-
2025-12-03$128,000 Active
-
2023-11-20$128,000 Active
-
2022-03-23soldstatus
-
2014-11-24soldstatus
-
2014-11-14historical
-
2014-05-29$62,500
ⓘ Source: listings_history table (triggers on properties + properties_extension) + one-shot
backfill from property_details.listing_events for pre-trigger history.
Tax reassessment forecast TX · Resets to sale price
- Current annual tax
- $1,517 · $126/mo
- Projected year-2 tax
- $2,288 · $191/mo
- Expected delta
- +$770/yr (+$64/mo · 50.8%)
ⓘ Screening estimate from a state-policy table — verify with the county assessor before closing.
Climate risk First Street
- Flood 1/10 Low FEMA zone X · 0% chance over 30 yrs
- Wildfire 7/10 Severe
- Heat 9/10 Extreme 6 d/yr ≥112°F today · 19 d/yr by 30 yrs out
- Wind 8/10 Severe 94% chance of damaging wind over 30 yrs
- Air quality 1/10 Low 0 unhealthy d/yr today · 0 by 30 yrs out
Nearby sold comps map
Loading sold comps map…
Walkable amenities ~0.75 mi
Loading nearby amenities…
Taxation est. · year 1
- Rental income
- $13,442
- − Mortgage interest
- −$7,002
- − Property taxes
- −$1,517
- − Insurance
- −$625
- − Repairs & maintenance
- −$1,075
- − Management
- −$1,075
- − Depreciation
- −$3,636
- Taxable loss
- −$1,489
- Est. tax savings @ 24.0%
- +$357
- After-tax cash flow
- $968/yr
For passive investors: Depreciation is non-cash, so a rental often shows a tax loss while cash-flowing — sheltering income. Rental losses are passive: they offset passive income freely, and up to $25,000/yr can offset ordinary (W-2) income if you actively participate and your MAGI is under $100k (phasing out to $0 by $150k); unused losses carry forward. On sale, claimed depreciation is recaptured at up to 25%, and gains may owe capital-gains tax (a 1031 exchange can defer both). Figures are a year-1 estimate at your 24.0% rate — not tax advice; consult a CPA.
Schools (NCES district)
- District
- La Joya ISD
- NCES district ID
- 4826130
- Math proficiency
- 18% ▼ -35.00%
- Reading proficiency
- 29% ▼ -10.00%
- Median HH income
- $27,845
- Composite
- 18.65/100
- National rank
- #8891
- State rank
- #759 of 826 in TX
Livability — Penitas
- Score
- 64/100
- State rank
- #820
- US rank
- #14866
Category grades
Schools grade is shown separately in the Schools card above.
Census & demographics
- County
- Hidalgo County · 623,128 people
- Metro
- McAllen-Edinburg-Mission, TX
- Population (ZIP)
- 78,024
- Household income
- $54,298
- Rent vs Own
- Severe rent burden
- 1714.0
Population outlook (Hidalgo County) Hauer SSP2
- Today (2025)
- 955,232 people
- By 2030
- 1,009,774 · +5.7%
- By 2040
- 1,120,332 · +17.3%
- By 2050
- 1,225,036 · +28.2%
- By 2075
- 1,439,189 · +50.7%
- By 2100
- 1,533,429 · +60.5%
Race, ethnicity, and origin ACS 2023
- Neighborhood character
- Predominantly Hispanic (85%)
- Race & ethnicity
- Hispanic / Latino 85% Two or more races 47% White 12% Asian 2%
- Hispanic origin (detail)
- Mexican 80%
- Common ancestry
- Slovak 1% Portuguese 0%
- Foreign-born
- 28% · Canada, South Korea
- Languages at home
- 22% English-only · Spanish 76%
Political lean MEDSL · Hidalgo
- 2024 margin
- Toss-up / Even · D 48.1% · R 51.0%
- 2008→2024 swing
- -41.6pp toward R · 2008: 38.7pp · 2024: -2.9pp
- All cycles
- 2024: R+2.9 2020: D+17.1 2016: D+40.5 2012: D+41.8 2008: D+38.7
Not yet ingested
- Civics
- —
Market trends
- HPI YoY
- ▼ -62.35%
- Current HPI
- 209.3573
- Rent YoY
- ▲ 0.93%
- Metro
- McAllen-Edinburg-Mission, TX
- State GDP YoY
- ▲ 3.95%
- F500 in state
- 110
Industry mix (Fortune 500 HQ in TX)
| Industry | F500 HQs | Revenue |
|---|---|---|
| Energy | 16 | $1,198B |
|
||
| Technology | 5 | $198B |
|
||
| Engineering / Construction | 4 | $72B |
|
||
| Energy Services | 3 | $60B |
|
||
| Utilities | 3 | $41B |
|
||
| Healthcare | 2 | $330B |
|
||
Price history
+100.0% since first listed8 events — show timeline
- 2026-04-08 Price Changed $125,000 MCALLENMLS
- 2026-03-05 Listed $128,000 MCALLENMLS
- 2025-12-03 Listed $128,000 MCALLENMLS
- 2023-11-20 Listed $128,000 MCALLENMLS
- 2022-03-23 Sold (Public Records) — Public Records
- 2014-11-24 Sold (MLS) — MCALLENMLS
- 2014-11-14 Delisted — MCALLENMLS
- 2014-05-29 Listed $62,500 MCALLENMLS
Property tax history
+2.8%/yrLatest (2025): $1,517 · -0.2% YoY. Source: county tax records.
Cash-flow waterfall
monthlySold comps — $/sqft
last 12 mo · ≤1 miLoading sold comps…