5910 Houston Rd · Macon-Bibb County, GA
Flood risk 1/10 · Minimal
- FEMA flood zone
- X (unshaded)
- Chance of flooding over 30 yrs
- 0.0%
- Est. flood insurance / yr
- $507 – $1,088
Fire risk 2/10 · Minimal
- Est. fire insurance / yr
- $963 – $1,789
Heat risk 7/10 · Major
- Hot days now (above 108°F)
- 7 days/yr
- Hot days in 30 yrs
- 18 days/yr
Wind risk 6/10 · Moderate
- Chance of severe wind over 30 yrs
- 76.0%
Air-quality risk 3/10 · Minor
- Unhealthy air days now
- 3 days/yr
- Unhealthy air days in 30 yrs
- 3 days/yr
Risk factors via First Street. Map © Google.
Why this score? — see what drove the C grade
The composite is a weighted blend of 9 inputs, each scored 0–100. Each bar is that input's sub-score; the figure is the points it added to the 100-point composite (weight × sub-score).
- Cash flow +22.1/30.0
- ARV discount +15.0/15.0
- DSCR +7.1/10.0
- 1% rule +4.8/10.0
- Livability +2.5/5.0
- Condition / age +2.5/5.0
- Rent growth +1.9/5.0
- Schools +1.2/10.0
- Appreciation +0.0/10.0
$214,900
🖨 Deal sheet (PDF) 📄 Offer letter ✓ Due diligence
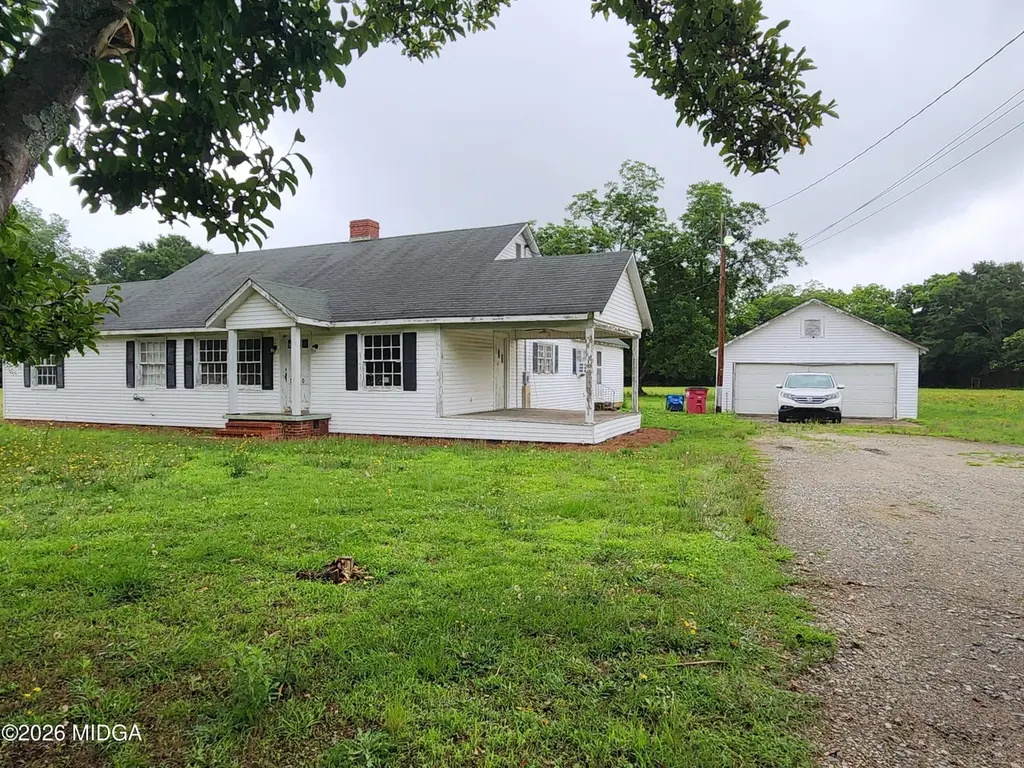
Listing remarks
This 3-bedroom 3- bath home with a detached garage AND workshop just hit the market. This home has endless potential for buyers or investors looking for rental investment or flip opportunities. Don't miss out on your chance to own this property!
Key facts
- 4.92 acre lot
- Garage
- Built 1949
Property features AI
Exterior
- Parking: Detached parking
- Utilities: Septic tank
- Home design: Single family residence; One level; Residential property; Fixer condition
- Construction: Wood siding; Block foundation; Shingle roof; Built with wood siding
- Exterior features: Front covered porch; Workshop
Interior
- Kitchen: Dishwasher; Gas Range
- Bedrooms: 2 total rooms
- Flooring: Hardwood; Vinyl
- Bathrooms: 3 full bathrooms
- Heating & cooling: Heat pump; Window units; Central air; Ceiling fans; Has heating; Has cooling; Other heating
- Interior features: Dishwasher; Gas Range; Gas Water Heater; Hardwood flooring; Vinyl flooring; Crawl space basement; Storage
- Laundry & utility: Laundry room
Neighborhood map
What this means for you Summary
Snapshot
- This is a 3-bed/3.0-bath single-family listed at $215k.
Deal economics
- At list price, monthly cash flow is $347 ($4k/yr) — positive.
- The deal already cash-flows at list — no discount required.
- To meet the 1% rule (rent ≥ 1% of price), the offer needs to be $210k (2.3% below list).
- Recommended offer: $210k (2.3% below list) — sets the bar for 1% rule.
- Cap rate 8.2% vs local median 5.4% in Macon-Bibb County — top-decile yield for the area; either an underpriced asset or a hidden risk that comps aren't pricing in. Stress-test before assuming the spread holds.
Location & tenants
- Location reads: area grade C — affects rentability + tenant quality, not the cash-flow math above.
- Bibb County (urban): math 11% / reading 18% proficiency, ranked #161 of 174 in GA (top 92%) — low school quality limits family demand, transient renter base, plan for 1-2y turnover; 75% free/reduced lunch — lower-income household profile, screen leases tightly.
- Market conditions: Rents soft (-2.3%/yr); 195 active listings in the ZIP; 6 comparable units currently listed for rent nearby; rentals lingering (median 45d on market — plan ~5-8 weeks vacancy on turnover, expect pricing pressure); 50% of comp listings sitting > 30 days — soft ceiling on asking rent; 154 units permitted in Bibb County in 2024 (0 in 5+ unit buildings).
- This rent runs 35% of the median local income ($72k/yr) — at the standard rent-burdened threshold; future hikes will face affordability resistance.
Forward outlook
- Local home prices are declining (-3.0%/yr); year-one equity from $1k of loan paydown is wiped out by about $6k of value loss. Plan a longer hold.
- Bibb County population projected at -12% by 2050 — secular population decline; favor cash flow + early exit over multi-decade hold.
Negotiation context
- It's been on market 17 days — a 2% lower offer ($212k) is reasonable based on typical stale-listing flexibility.
Risks & watch-outs
- Watch-outs: built in 1949 — expect roof / HVAC / electrical / plumbing capex.
- Climate carrying-cost: major wind risk, 76% chance of damaging wind over 30y; extreme-heat days projected 7→18/yr by 2055 (HVAC capex compounding) — expect insurance premiums to compound above CPI over the hold.
Questions for the listing agent
- Built in 1949 — when were the roof, HVAC, electrical panel, plumbing, and water heater last replaced?
- Is there a deadline driving the sale (1031 exchange, divorce, estate, relocation)? That informs how much negotiation room exists.
- What's the average days-on-market for RENTAL listings here right now (not sales)? A rising rental-DOM trend means longer vacancies and softer asking-rent achievability than the comps imply.
- What's the recent tenant-quality profile in this submarket — average credit score on applications, eviction rate, late-payment / NSF rate, and stable-employment percentage? A property-management company in the area should have these aggregated.
- How much new for-sale + rental construction is in the pipeline within 1–3 miles? Heavy new supply typically softens prices + rents 12–24 months out; constrained supply supports both.
Investment metrics
- 1% rule
- 0.98% ✗
- Cap rate
- 8.23%
- Cash-on-cash
- 6.92%
- DSCR
- 1.31
- GRM
- 8.5
CMA / ARV
- ARV (on-the-fly)
- $319,634
- Comps found
- 12
Show comp detail 12 sales within ~0.75 mi
| Address | Dist | Beds/Ba | Sqft | Sold | Price | $/sf | Match |
|---|---|---|---|---|---|---|---|
| 2960 Regina Dr | 0.65mi | 3/2.0 | 2,021 (-0%) | 4mo | $235,000 | $116 | 62 |
| 108 Alayna Ct #161 | 0.54mi | 4/2.5 (+1) | 2,050 (+1%) | 9mo | $274,490 | $134 | 58 |
| 3369 Sandy Cir | 0.51mi | 3/2.0 | 2,178 (+8%) | 2mo | $220,000 | $101 | 58 |
| 2813 S Estates Rd | 0.36mi | 4/2.0 (+1) | 1,816 (-10%) | 1mo | $190,000 | $105 | 57 |
| 5758 Shelli Pl | 0.47mi | 3/2.0 | 1,755 (-13%) | 4mo | $228,000 | $130 | 49 |
| 116 Fred Ct | 0.45mi | 4/2.0 (+1) | 1,812 (-10%) | 5mo | $289,000 | $159 | 48 |
| 310 Browning Pointe Rd | 0.55mi | 3/2.0 | 1,817 (-10%) | 7mo | $308,040 | $170 | 48 |
| 106 Maries Garden Trl | 0.48mi | 4/2.0 (+1) | 1,817 (-10%) | 6mo | $311,615 | $171 | 46 |
| 321 Browning Pointe Rd | 0.51mi | 4/2.0 (+1) | 1,791 (-12%) | 4mo | $283,000 | $158 | 45 |
| 344 Browning Pointe Rd | 0.56mi | 4/2.0 (+1) | 1,812 (-10%) | 3mo | $270,000 | $149 | 45 |
| 350 Browning Pointe Rd | 0.55mi | 4/2.0 (+1) | 1,812 (-10%) | 4mo | $289,000 | $159 | 45 |
| 328 Browning Pointe Rd | 0.55mi | 4/2.0 (+1) | 1,850 (-9%) | 8mo | $314,500 | $170 | 44 |
Match score weights: distance 35% · size 25% · config 20% · recency 20%. Top-matched comps best support the ARV.
Projected returns pro-forma
-3.0% appreciation · 0.0% rent growth · sell at horizon
- IRR
- -8.8%
- Equity multiple
- 0.69×
- Total profit
- $-18,947
- Equity at exit
- $32,042
- IRR
- -3.4%
- Equity multiple
- 0.80×
- Total profit
- $-12,119
- Equity at exit
- $18,581
Cash invested: $60,172 (down + closing). Projections, not guarantees.
Landlord ↔ Tenant lean methodology
- Overall (STATE)
- 90 Strongly Landlord-Friendly
- State Georgia
- 90 Strongly Landlord-Friendly · R+3
- County
- — inherits STATE
- City
- — inherits STATE
ZIP-level market 31216
- Rents YoY
- -2.3%
- Active inventory
- 195
- Price-to-rent
- 8.5×
Monthly cashflow live
- Estimated rent
- $2,100 high interval (Pro) →
- Mortgage (P&I)
- −$1,127
- Tax from tax record
- −$95 /mo · $1,141/yr
- Insurance
- −$90
- HOA
- −$0
- Vacancy / Maint / Mgmt
- −$441
- Net cashflow
- $347
Break-even live
Sensitivity live
| Price | -10% $469 | -5% $408 | +0% $347 | +5% $286 | +10% $225 |
|---|---|---|---|---|---|
| Rent | -10% $181 | -5% $264 | +0% $347 | +5% $430 | +10% $513 |
| Rate | -1.0pp $455 | -0.5pp $402 | base $347 | +0.5pp $291 | +1.0pp $235 |
UW: 25.0% down · 7.5% · 30yr · 1.5% tax · 5.0% vac · 8.0% maint · 8.0% mgmt
Financing live
Cash to close
- Down payment
- $53,725
- Closing costs
- $6,447
- Reserves months
- —
- Total cash needed
- —
Loan-product check · same deal, 3 products live
Conventional
25% down · 7.5% · 30yr
- Down + closing
- —
- Monthly P&I
- —
- Monthly cashflow
- —
- DSCR
- —
- Eligible?
- —
Personal DTI + credit; lowest rate.
DSCR
20% down · 8.5% · 30yr
- Down + closing
- —
- Monthly P&I
- —
- Monthly cashflow
- —
- DSCR
- —
- Eligible?
- —
No personal income docs; deal must DSCR.
Hard money
10% down · 12.0% · 12mo
- Down + closing
- —
- Monthly P&I
- —
- Monthly cashflow
- —
- DSCR
- —
- Eligible?
- —
Short-term bridge; refi at stabilization.
Rent comps 6 comps
| Address | Beds | Baths | Sqft | Rent | $/sqft | DOM | Units | Dist |
|---|---|---|---|---|---|---|---|---|
| 334 Amanda Dr Macon, GA | 3.0 | 2.5 | 2316 | $2,265 | $0.98 | 21d | 1 | 0.70mi |
| 3478 Bridgewood Dr Macon, GA | 3.0 | 2.5 | 1915 | $2,095 | $1.09 | 44d | 1 | 0.73mi |
| 6670 Fran Dr Macon, GA | 4.0 | 3.0 | 2024 | $2,181 | $1.08 | 14d | 1 | 1.04mi |
| 329 Eagle Ridge Rd Macon, GA | 4.0 | 3.5 | 2650 | $3,700 | $1.40 | 44d | 1 | 1.05mi |
| 3821 Bobby Ct Macon, GA | 3.0 | 2.0 | 1760 | $1,850 | $1.05 | 44d | 1 | 1.25mi |
| 4057 Liberty Estates Dr Macon, GA | 3.0 | 2.0 | 1747 | $1,845 | $1.06 | 21d | 1 | 1.36mi |
Listing history 13 events
-
2026-06-19days on market $214,900 Active 17 DOM
-
2026-06-18days on market $214,900 Active 16 DOM
-
2026-06-17days on market $214,900 Active 15 DOM
-
2026-06-16days on market $214,900 Active 14 DOM
-
2026-06-15days on market $214,900 Active 13 DOM
-
2026-06-14days on market $214,900 Active 11 DOM
-
2026-06-13days on market $214,900 Active 10 DOM
-
2026-06-10days on market $214,900 Active 8 DOM
-
2026-06-09days on market $214,900 Active 7 DOM
-
2026-06-08days on market $214,900 Active 6 DOM
-
2026-06-07days on market $214,900 Active 5 DOM
-
2026-06-03remarks 245-char remark
-
2026-06-03$214,900 Active 1 DOM
ⓘ Source: listings_history table (triggers on properties + properties_extension) + one-shot
backfill from property_details.listing_events for pre-trigger history.
Tax reassessment forecast GA · Resets to sale price
- Current annual tax
- $1,141 · $95/mo
- Projected year-2 tax
- $1,977 · $165/mo
- Expected delta
- +$836/yr (+$70/mo · 73.2%)
ⓘ Screening estimate from a state-policy table — verify with the county assessor before closing.
Climate risk First Street
- Flood 1/10 Low FEMA zone X (unshaded) · 0% chance over 30 yrs
- Wildfire 2/10 Low
- Heat 7/10 Severe 7 d/yr ≥108°F today · 18 d/yr by 30 yrs out
- Wind 6/10 Major 76% chance of damaging wind over 30 yrs
- Air quality 3/10 Moderate 3 unhealthy d/yr today · 3 by 30 yrs out
Nearby sold comps map
Loading sold comps map…
Walkable amenities ~0.75 mi
Loading nearby amenities…
Taxation est. · year 1
- Rental income
- $25,195
- − Mortgage interest
- −$12,038
- − Property taxes
- −$1,141
- − Insurance
- −$1,074
- − Repairs & maintenance
- −$2,016
- − Management
- −$2,016
- − Depreciation
- −$6,252
- Taxable income
- $659
- Est. tax owed @ 24.0%
- −$158
- After-tax cash flow
- $4,007/yr
For passive investors: Depreciation is non-cash, so a rental often shows a tax loss while cash-flowing — sheltering income. Rental losses are passive: they offset passive income freely, and up to $25,000/yr can offset ordinary (W-2) income if you actively participate and your MAGI is under $100k (phasing out to $0 by $150k); unused losses carry forward. On sale, claimed depreciation is recaptured at up to 25%, and gains may owe capital-gains tax (a 1031 exchange can defer both). Figures are a year-1 estimate at your 24.0% rate — not tax advice; consult a CPA.
Schools (NCES district)
- District
- Bibb County
- NCES district ID
- 1300420
- Math proficiency
- 11% ▼ -14.00%
- Reading proficiency
- 18% ▼ -11.00%
- Median HH income
- $37,426
- Composite
- 12.13/100
- National rank
- #9654
- State rank
- #161 of 174 in GA
Livability — Macon-Bibb County
No livability data for this city. (Only ~50 U.S. cities are tracked.)
Census & demographics
- Census place
- Macon-Bibb County, GA
- County
- Bibb County · 164,332 people
- City population
- 143,186
- Metro
- Macon-Bibb County, GA
- Population (ZIP)
- 16,328
- Household income
- $72,452
- Rent vs Own
- Severe rent burden
- 161.0
Population outlook (Bibb County) Hauer SSP2
- Today (2025)
- 148,772 people
- By 2030
- 145,904 · -1.9%
- By 2040
- 139,404 · -6.3%
- By 2050
- 131,603 · -11.5%
- By 2075
- 111,050 · -25.4%
- By 2100
- 83,346 · -44.0%
Race, ethnicity, and origin ACS 2023
- Neighborhood character
- Diverse neighborhood (Simpson 0.56)
- Race & ethnicity
- White 56% Black 35% Hispanic / Latino 4% Two or more races 3% Asian 1%
- Common ancestry
- Serbian 2% Lithuanian 2% Italian 1%
- Foreign-born
- 3% · South Korea, Canada
- Languages at home
- 97% English-only · Spanish 2% Korean 1%
Political lean MEDSL · Bibb
- 2024 margin
- Strong D (+22.4) · D 61.0% · R 38.5%
- 2008→2024 swing
- +4.4pp toward D · 2008: 18.0pp · 2024: 22.4pp
- All cycles
- 2024: D+22.4 2020: D+23.8 2016: D+20.2 2012: D+20.0 2008: D+18.0
Not yet ingested
- Civics
- —
Market trends
- HPI YoY
- ▼ -135.37%
- Current HPI
- 211.3565
- Rent YoY
- ▼ -2.31%
- Metro
- Macon-Bibb County, GA
- State GDP YoY
- ▲ 2.66%
- F500 in state
- 28
Industry mix (Fortune 500 HQ in GA)
| Industry | F500 HQs | Revenue |
|---|---|---|
| Paper / Packaging | 2 | $29B |
|
||
| Retail | 1 | $160B |
|
||
| Transportation / Logistics | 1 | $91B |
|
||
| Airlines | 1 | $62B |
|
||
| Consumer Goods | 1 | $47B |
|
||
| Utilities | 1 | $25B |
|
||
Price history
1 event — show timeline
- 2026-06-02 Listed $214,900 MGMLS
Property tax history
+4.9%/yrLatest (2025): $1,141 · -6.2% YoY. Source: county tax records.
Cash-flow waterfall
monthlySold comps — $/sqft
last 12 mo · ≤1 miLoading sold comps…