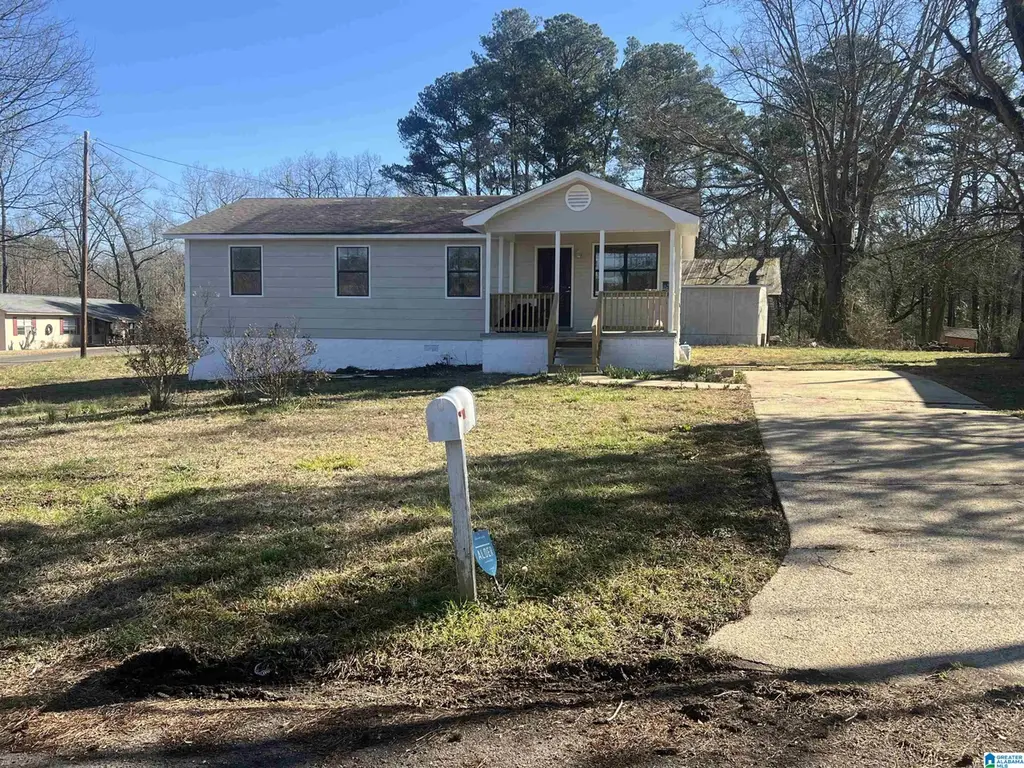
2101 Sadlertown Rd · Bessemer, AL
Flood risk 1/10 · Minimal
- FEMA flood zone
- X (unshaded)
- Chance of flooding over 30 yrs
- 0.0%
- Est. flood insurance / yr
- $507 – $1,088
Fire risk 3/10 · Minor
- Est. fire insurance / yr
- $916 – $1,700
Heat risk 6/10 · Moderate
- Hot days now (above 108°F)
- 7 days/yr
- Hot days in 30 yrs
- 18 days/yr
Wind risk 6/10 · Moderate
- Chance of severe wind over 30 yrs
- 46.0%
Air-quality risk 3/10 · Minor
- Unhealthy air days now
- 2 days/yr
- Unhealthy air days in 30 yrs
- 5 days/yr
Risk factors via First Street. Map © Google.
Why this score? — see what drove the C+ grade
The composite is a weighted blend of 9 inputs, each scored 0–100. Each bar is that input's sub-score; the figure is the points it added to the 100-point composite (weight × sub-score).
- Cash flow +23.4/30.0
- ARV discount +15.0/15.0
- DSCR +7.5/10.0
- 1% rule +5.7/10.0
- Rent growth +5.0/5.0
- Livability +3.0/5.0
- Condition / age +2.5/5.0
- Schools +0.8/10.0
- Appreciation +0.0/10.0
$175,000
🖨 Deal sheet 📄 Offer letter ✓ Due diligence
Listing remarks MLS
Take a look at this cozy 4 bed 1.5 bath home, this home is sat on 1 acre that includes your very own workshop/detached garage!
Key facts
- Detached shop
- 1 acre lot
- Built 1984
Tags
Neighborhood map
What this means for you Summary
Snapshot
- This is a 3-bed/1.5-bath single-family listed at $175k.
Deal economics
- At list price, monthly cash flow is $324 ($4k/yr) — positive.
- The deal already cash-flows at list — no discount required.
- Meets the 1% rule at list price ($2k rent vs $175k).
- Recommended offer: $172k (1.5% below list) — sets the bar for market timing.
- Cap rate 8.5% vs local median 5.9% in Bessemer — top-decile yield for the area; either an underpriced asset or a hidden risk that comps aren't pricing in. Stress-test before assuming the spread holds.
Location & tenants
- Location reads 59/100 on livability (#331 in AL) — a working-class tenant base; expect higher turnover. Strengths: commute A+, cost of living A+, housing A; Watch: schools D-, crime F, amenities F.
- Bessemer City (suburban): math 3% / reading 19% proficiency, ranked #120 of 129 in AL (top 93%) — low school quality limits family demand, transient renter base, plan for 1-2y turnover; 87% free/reduced lunch — lower-income household profile, screen leases tightly.
- Market conditions: Rents rising fast (+14.8%/yr); 311 active listings in the ZIP; 4 comparable units currently listed for rent nearby; rentals at typical pace (median 16d on market — plan ~3-4 weeks tenant-placement turnaround); solid renter incomes; 2,114 units permitted in Jefferson County in 2024 (556 in 5+ unit buildings).
Forward outlook
- Local home prices are declining (-3.0%/yr); year-one equity from $1k of loan paydown is wiped out by about $5k of value loss. Plan a longer hold.
- Jefferson County population projected to shrink 4% by 2050 — rents likely to lag national; underwrite the cash flow, not the appreciation.
- At projected returns (-3.0% appreciation + 8.0% rent growth), your $49k cash investment doubles in ~8 years — after that, you're playing with house money.
Negotiation context
- It's been on market 19 days — a 2% lower offer ($172k) is reasonable based on typical stale-listing flexibility.
Risks & watch-outs
- Climate carrying-cost: major wind risk, 46% chance of damaging wind over 30y; extreme-heat days projected 7→18/yr by 2055 (HVAC capex compounding) — expect insurance premiums to compound above CPI over the hold.
Questions for the listing agent
- Is there a deadline driving the sale (1031 exchange, divorce, estate, relocation)? That informs how much negotiation room exists.
- Schools are D-rated, which usually means shorter tenancies and higher turnover. Who's the typical renter profile here, and what's been the actual vacancy rate?
- Crime grade is F in this area — have there been break-ins, vandalism, or insurance claims at this property in the last 3 years? What carrier currently insures it and at what premium?
- What's the average days-on-market for RENTAL listings here right now (not sales)? A rising rental-DOM trend means longer vacancies and softer asking-rent achievability than the comps imply.
- What's the recent tenant-quality profile in this submarket — average credit score on applications, eviction rate, late-payment / NSF rate, and stable-employment percentage? A property-management company in the area should have these aggregated.
- How much new for-sale + rental construction is in the pipeline within 1–3 miles? Heavy new supply typically softens prices + rents 12–24 months out; constrained supply supports both.
Investment metrics
- 1% rule
- 1.07% ✓
- Cap rate
- 8.51%
- Cash-on-cash
- 7.93%
- DSCR
- 1.35
- GRM
- 7.8
CMA / ARV
- ARV (median comp)
- $247,865
- List price
- $175,000
- Delta
- -25.36%
- Verdict
- UNDERPRICED
- Comps
- 20 within 1.0 mi
Show comp detail 2 sales within ~0.75 mi
| Address | Dist | Beds/Ba | Sqft | Sold | Price | $/sf | Match |
|---|---|---|---|---|---|---|---|
| 3149 Pinecreek Loop | 0.33mi | 2/2.0 (-1) | 1,171 (-5%) | 24mo | $194,000 | $166 | 50 |
| 2138 Cumberland Rd | 0.48mi | 3/2.0 | 1,390 (+13%) | 10mo | $202,000 | $145 | 46 |
Match score weights: distance 35% · size 25% · config 20% · recency 20%. Top-matched comps best support the ARV.
Projected returns pro-forma
-3.0% appreciation · 8.0% rent growth · sell at horizon
- IRR
- 1.1%
- Equity multiple
- 1.04×
- Total profit
- $2,166
- Equity at exit
- $26,093
- IRR
- 15.1%
- Equity multiple
- 2.50×
- Total profit
- $73,535
- Equity at exit
- $15,131
Cash invested: $49,000 (down + closing). Projections, not guarantees.
Landlord ↔ Tenant lean methodology
- Overall (STATE)
- 90 Strongly Landlord-Friendly
- State Alabama
- 90 Strongly Landlord-Friendly · R+15
- County
- — inherits STATE
- City
- — inherits STATE
ZIP-level market 35022
- Home prices YoY
- -20.2%
- Rents YoY
- 14.8%
- Active inventory
- 311
- Price-to-rent
- 7.8×
Monthly cashflow live
- Estimated rent
- $1,876 medium interval (Pro) →
- Mortgage (P&I)
- −$918
- Tax from tax record
- −$168 /mo · $2,012/yr
- Insurance
- −$73
- HOA
- −$0
- Vacancy / Maint / Mgmt
- −$394
- Net cashflow
- $324
Break-even live
UW: 25.0% down · 7.5% · 30yr · 1.5% tax · 5.0% vac · 8.0% maint · 8.0% mgmt
Financing live
Cash to close
- Down payment
- $43,750
- Closing costs
- $5,250
- Reserves months
- —
- Total cash needed
- —
Loan-product check · same deal, 3 products live
Conventional
25% down · 7.5% · 30yr
- Down + closing
- —
- Monthly P&I
- —
- Monthly cashflow
- —
- DSCR
- —
- Eligible?
- —
Personal DTI + credit; lowest rate.
DSCR
20% down · 8.5% · 30yr
- Down + closing
- —
- Monthly P&I
- —
- Monthly cashflow
- —
- DSCR
- —
- Eligible?
- —
No personal income docs; deal must DSCR.
Hard money
10% down · 12.0% · 12mo
- Down + closing
- —
- Monthly P&I
- —
- Monthly cashflow
- —
- DSCR
- —
- Eligible?
- —
Short-term bridge; refi at stabilization.
Rent comps 4 comps
| Address | Beds | Baths | Sqft | Rent | $/sqft | DOM | Units | Dist |
|---|---|---|---|---|---|---|---|---|
| 3626 Wind Ridge Ln Bessemer, AL | 3.0 | 2.0 | 1305 | $1,850 | $1.42 | 3d | 1 | 0.16mi |
| 4015 Goodwin Rd Bessemer, AL | 3.0 | 2.0 | 1200 | $1,211 | $1.01 | 16d | 1 | 0.45mi |
| 236 Clifton St Bessemer, AL | 3.0 | 1.0 | 1450 | $1,100 | $0.76 | 43d | 1 | 1.42mi |
| 63 Bluebell St Bessemer, AL | 4.0 | 2.0 | 1232 | $1,399 | $1.14 | 16d | 1 | 1.44mi |
Listing history 18 events
-
2026-06-18days on market $175,000 Active 19 DOM
-
2026-06-17days on market $175,000 Active 18 DOM
-
2026-06-16days on market $175,000 Active 17 DOM
-
2026-06-15days on market $175,000 Active 16 DOM
-
2026-06-13days on market $175,000 Active 14 DOM
-
2026-06-10pricedays on market $175,000 Active 11 DOM
-
2026-06-09days on market $180,000 Active 10 DOM
-
2026-06-08days on market $180,000 Active 9 DOM
-
2026-06-07days on market $180,000 Active 8 DOM
-
2026-06-05days on market $180,000 Active 5 DOM
-
2026-06-03days on market $180,000 Active 4 DOM
-
2026-06-02days on market $180,000 Active 3 DOM
-
2026-06-01days on market $180,000 Active 2 DOM
-
2026-05-31remarks 247-char remark
-
2026-05-31pricestatusdays on market $180,000 Active 1 DOM
-
2026-05-09price $185,000 126-char remark
Show marketing remark (126 chars)
Take a look at this cozy 4 bed 1.5 bath home, this home is sat on 1 acre that includes your very own workshop/detached garage!
-
2026-03-17price $199,999 126-char remark
Show marketing remark (126 chars)
Take a look at this cozy 4 bed 1.5 bath home, this home is sat on 1 acre that includes your very own workshop/detached garage!
-
2026-02-18$205,000 Active 126-char remark
Show marketing remark (126 chars)
Take a look at this cozy 4 bed 1.5 bath home, this home is sat on 1 acre that includes your very own workshop/detached garage!
ⓘ Source: listings_history table (triggers on properties + properties_extension) + one-shot
backfill from property_details.listing_events for pre-trigger history.
Tax reassessment forecast AL · Resets to sale price
- Current annual tax
- $2,012 · $168/mo
- Projected year-2 tax
- $2,012 · $168/mo
- Expected delta
- $0/yr ($0/mo · -0.0%)
ⓘ Screening estimate from a state-policy table — verify with the county assessor before closing.
Climate risk First Street
- Flood 1/10 Low FEMA zone X (unshaded) · 0% chance over 30 yrs
- Wildfire 3/10 Moderate
- Heat 6/10 Major 7 d/yr ≥108°F today · 18 d/yr by 30 yrs out
- Wind 6/10 Major 46% chance of damaging wind over 30 yrs
- Air quality 3/10 Moderate 2 unhealthy d/yr today · 5 by 30 yrs out
Nearby sold comps map
Loading sold comps map…
Walkable amenities ~0.75 mi
Loading nearby amenities…
Taxation est. · year 1
- Rental income
- $22,510
- − Mortgage interest
- −$9,803
- − Property taxes
- −$2,012
- − Insurance
- −$875
- − Repairs & maintenance
- −$1,801
- − Management
- −$1,801
- − Depreciation
- −$5,091
- Taxable income
- $1,128
- Est. tax owed @ 24.0%
- −$271
- After-tax cash flow
- $3,613/yr
For passive investors: Depreciation is non-cash, so a rental often shows a tax loss while cash-flowing — sheltering income. Rental losses are passive: they offset passive income freely, and up to $25,000/yr can offset ordinary (W-2) income if you actively participate and your MAGI is under $100k (phasing out to $0 by $150k); unused losses carry forward. On sale, claimed depreciation is recaptured at up to 25%, and gains may owe capital-gains tax (a 1031 exchange can defer both). Figures are a year-1 estimate at your 24.0% rate — not tax advice; consult a CPA.
Schools (NCES district)
- District
- Bessemer City
- NCES district ID
- 0100330
- Math proficiency
- 3% ▼ -18.00%
- Reading proficiency
- 19% ▼ -3.00%
- Median HH income
- $29,721
- Composite
- 8.45/100
- National rank
- #9905
- State rank
- #120 of 129 in AL
Livability — Bessemer
- Score
- 59/100
- State rank
- #331
- US rank
- #20078
Category grades
Schools grade is shown separately in the Schools card above.
Census & demographics
- Census place
- Bessemer, AL
- County
- Jefferson County · 527,445 people
- City population
- 48,018
- Metro
- Birmingham-Hoover, AL
- Population (ZIP)
- 23,126
- Household income
- $81,846
- Rent vs Own
- Severe rent burden
- 554.0
Population outlook (Jefferson County) Hauer SSP2
- Today (2025)
- 669,185 people
- By 2030
- 669,694 · +0.1%
- By 2040
- 661,388 · -1.2%
- By 2050
- 643,086 · -3.9%
- By 2075
- 577,267 · -13.7%
- By 2100
- 474,758 · -29.1%
Race, ethnicity, and origin ACS 2023
- Neighborhood character
- Diverse neighborhood (Simpson 0.56)
- Race & ethnicity
- Black 53% White 41% Hispanic / Latino 3% Two or more races 2% Asian 1%
- Common ancestry
- Italian 1% Slovak 1% Iranian 1%
- Foreign-born
- 4% · Canada, China
- Languages at home
- 96% English-only · Spanish 3% Chinese 1%
Political lean MEDSL · Jefferson
- 2024 margin
- D (+10.4) · D 54.6% · R 44.2% · Other 1.2%
- 2008→2024 swing
- +5.4pp toward D · 2008: 5.1pp · 2024: 10.4pp
- All cycles
- 2024: D+10.4 2020: D+13.2 2016: D+7.2 2012: D+6.0 2008: D+5.1
Not yet ingested
- Civics
- —
Market trends
- HPI YoY
- ▼ -55.40%
- Current HPI
- 219.3839
- Rent YoY
- ▲ 14.80%
- Metro
- Birmingham-Hoover, AL
- State GDP YoY
- ▲ 2.94%
- F500 in state
- 4
Industry mix (Fortune 500 HQ in AL)
| Industry | F500 HQs | Revenue |
|---|---|---|
| Financial Services | 1 | $8B |
|
||
| Healthcare | 1 | $5B |
|
||
Price history
-9.8% since first listed3 events — show timeline
- 2026-05-09 Price Changed $185,000 Greater Alabama MLS
- 2026-03-17 Price Changed $199,999 Greater Alabama MLS
- 2026-02-18 Listed $205,000 Greater Alabama MLS
Property tax history
+5.0%/yrLatest (2025): $2,012 · +33.1% YoY. Source: county tax records.
Cash-flow waterfall
monthlySold comps — $/sqft
last 12 mo · ≤1 miLoading sold comps…