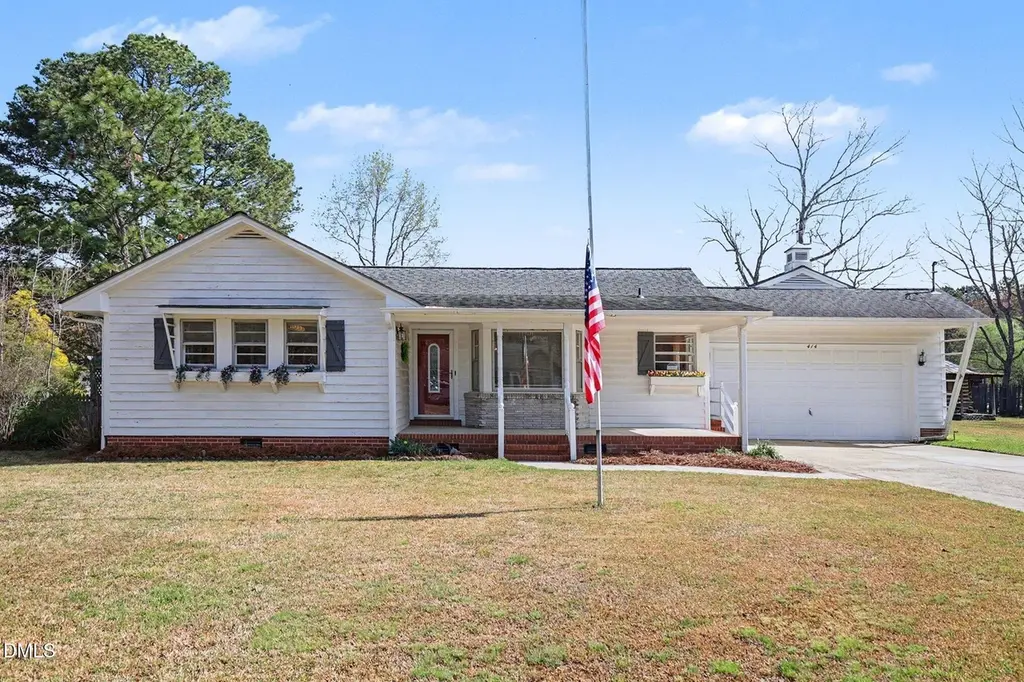
414 E Fremont St · Kenly, NC
Flood risk 1/10 · Minimal
- FEMA flood zone
- X (unshaded)
- Chance of flooding over 30 yrs
- 0.0%
- Est. flood insurance / yr
- $507 – $1,088
Fire risk 4/10 · Minor
- Est. fire insurance / yr
- $906 – $1,684
Heat risk 7/10 · Major
- Hot days now (above 106°F)
- 7 days/yr
- Hot days in 30 yrs
- 17 days/yr
Wind risk 7/10 · Major
- Chance of severe wind over 30 yrs
- 75.0%
Air-quality risk 3/10 · Minor
- Unhealthy air days now
- 3 days/yr
- Unhealthy air days in 30 yrs
- 3 days/yr
Risk factors via First Street. Map © Google.
Why this score? — see what drove the C grade
The composite is a weighted blend of 9 inputs, each scored 0–100. Each bar is that input's sub-score; the figure is the points it added to the 100-point composite (weight × sub-score).
- ARV discount +15.0/15.0
- Cash flow +13.1/30.0
- Appreciation +10.0/10.0
- DSCR +3.9/10.0
- Schools +3.5/10.0
- Livability +3.4/5.0
- 1% rule +3.2/10.0
- Rent growth +2.5/5.0
- Condition / age +2.5/5.0
$219,900
🖨 Deal sheet (PDF) 📄 Offer letter ✓ Due diligence
Listing remarks
All the room you will need and more!! Welcome to this charming Kenly home full of character and timeless appeal! This well-built, older home offers excellent bones and 1,648 sq ft of versatile living space, including 2 bedrooms, 2 baths, and two spacious living areas--with plenty of room and flexibility to easily accommodate a third bedroom. From the inviting front porch to the warm interior details, you'll feel right at home. The living room features beautiful wood floors and a bay window nook with a built-in china cabinet, while the oversized family room provides the perfect gathering space with a brick wood-burning fireplace, wood-beam ceiling, and built-in shelving. The eat-in kitchen
Key facts
- Wood-beam ceiling
- Bay window nook
- Wood floors
Tags
Property features AI
Finance
- Other: Lot size approximately 0.45 acres; Road frontage on a paved state road (public maintained)
- HOA & community: No association
Exterior
- Parking: Attached garage; 2 garage spaces
- Utilities: Public water; Public sewer
- Home design: Single-story house; Wood siding exterior; Shingle roof; Zoned MHP; Facing direction not specified; Entry level on one main level
- Construction: Wood siding construction; Shingle roof; One-level structure
- Exterior features: Front porch; Deck; Exterior storage; Back yard fencing; Barn(s) and additional storage structures; Property listed as fixer condition
Interior
- Kitchen: Refrigerator; Eat-in kitchen layout
- Bedrooms: 2 bedrooms (both on the main level)
- Flooring: Carpet; Hardwood; Vinyl
- Bathrooms: 2 full bathrooms
- Heating & cooling: Forced air heating; Central air conditioning; Ceiling fan(s)
- Interior features: Beamed ceilings; Built-in bookcases and storage; Eat-in kitchen; Primary bedroom on the main level; Walk-in closet(s); Bathtub/shower combination
- Laundry & utility: Main-level laundry room with sink
Neighborhood map
What this means for you Summary
Snapshot
- This is a 2-bed/2.0-bath single-family listed at $220k.
Deal economics
- At list price, monthly cash flow is $-10 ($-114/yr) — negative.
- To cash-flow at today's rent, offer at most $218k (0.8% below list).
- To meet the 1% rule (rent ≥ 1% of price), the offer needs to be $180k (18.1% below list).
- Recommended offer: $180k (18.1% below list) — sets the bar for 1% rule.
- Cap rate 6.2% vs local median 3.5% in Kenly — top-decile yield for the area; either an underpriced asset or a hidden risk that comps aren't pricing in. Stress-test before assuming the spread holds.
Location & tenants
- Location reads 68/100 on livability (#183 in NC) — a middle-class / working-renter tenant base. Strengths: cost of living A+, housing A+, health & safety A+; Watch: amenities F, commute F, employment F.
- Johnston County Public Schools (rural): math 39% / reading 42% proficiency, ranked #105 of 178 in NC (top 59%) — families likely to look elsewhere, expect single-tenant / working-renter base with shorter leases.
- Zoned schools: Glendale-Kenly Elementary (math 44% / reading 43%, grade F, #618 of 1,410 statewide, top 44%, 472 students, 68% FRL); North Johnston Middle (math 26% / reading 36%, grade F, #326 of 475 statewide, top 69%, 600 students, 72% FRL); North Johnston High (math 27% / reading 37%, grade F, #445 of 535 statewide, top 84%, 787 students, 62% FRL) — zoned schools average 67% FRL vs 41% district-wide (26 pts higher); higher-poverty schools than district average — tighter screening recommended.
- Market conditions: 89 active listings in the ZIP; 1 comparable units currently listed for rent nearby; 2,783 units permitted in Johnston County in 2024 (6 in 5+ unit buildings).
Forward outlook
- In year one you build about $24k of equity ($2k loan paydown + $22k appreciation (10.0% local appreciation)).
- Johnston County population projected at +37% by 2050 — long-run rental-demand tailwind backs the buy-and-hold thesis.
- At projected returns (10.0% appreciation + 3.0% rent growth), your $62k cash investment doubles in ~3 years — after that, you're playing with house money.
- By year 2, paydown + projected appreciation supports a ~$38k cash-out refi (75% LTV) — recoverable capital for the next deal without selling this one.
Negotiation context
- It's been on market 94 days — a 9% lower offer ($200k) is reasonable based on typical stale-listing flexibility.
- 3 sale attempts since 2y ago; this cycle's ask has dropped $29k (12%) from the opening price — seller is motivated, your offer sets the floor, not the list.
Risks & watch-outs
- Climate carrying-cost: major wind risk, 75% chance of damaging wind over 30y; extreme-heat days projected 7→17/yr by 2055 (HVAC capex compounding) — expect insurance premiums to compound above CPI over the hold.
Questions for the listing agent
- What do current leases actually rent for vs. the listed asking? Can we see a recent rent roll and the last 12 months of T-12 income?
- It's been on market 94 days. Have you received any prior offers? Is the seller open to a 18% concession, seller financing, or rate buy-down credit?
- Built in 1962 — when were the roof, HVAC, electrical panel, plumbing, and water heater last replaced?
- Why hasn't it sold? Are there any deal-killer items the seller is aware of (foundation, flood, title, zoning, code violations)?
- Is there a deadline driving the sale (1031 exchange, divorce, estate, relocation)? That informs how much negotiation room exists.
- Schools are F-rated, which usually means shorter tenancies and higher turnover. Who's the typical renter profile here, and what's been the actual vacancy rate?
- What's the average days-on-market for RENTAL listings here right now (not sales)? A rising rental-DOM trend means longer vacancies and softer asking-rent achievability than the comps imply.
- What's the recent tenant-quality profile in this submarket — average credit score on applications, eviction rate, late-payment / NSF rate, and stable-employment percentage? A property-management company in the area should have these aggregated.
- How much new for-sale + rental construction is in the pipeline within 1–3 miles? Heavy new supply typically softens prices + rents 12–24 months out; constrained supply supports both.
Investment metrics
- 1% rule
- 0.82% ✗
- Cap rate
- 6.24%
- Cash-on-cash
- -0.19%
- DSCR
- 0.99
- GRM
- 10.2
CMA / ARV
- ARV (on-the-fly)
- $280,160
- Comps found
- 10
Show comp detail 10 sales within ~0.75 mi
| Address | Dist | Beds/Ba | Sqft | Sold | Price | $/sf | Match |
|---|---|---|---|---|---|---|---|
| 416 E Fremont St | 0.02mi | 3/2.0 (+1) | 1,560 (-5%) | 16mo | $250,000 | $160 | 72 |
| 208 S College Ave | 0.32mi | 3/2.0 (+1) | 1,638 (-1%) | 9mo | $257,000 | $157 | 72 |
| 202 S Wilson St | 0.26mi | 3/2.0 (+1) | 1,588 (-4%) | 17mo | $270,000 | $170 | 63 |
| 307 E Pope Ave | 0.21mi | 3/2.0 (+1) | 1,410 (-14%) | 12mo | $248,000 | $176 | 51 |
| 303 E Pope Ave | 0.23mi | 3/2.0 (+1) | 1,410 (-14%) | 12mo | $248,900 | $177 | 50 |
| 1139 Princeton Kenly Rd | 0.70mi | 3/1.5 (+1) | 1,616 (-2%) | 9mo | $233,900 | $145 | 50 |
| 303 E Pope Ave | 0.26mi | 3/2.0 (+1) | 1,410 (-14%) | 12mo | $248,900 | $177 | 49 |
| 305 E Pope Ave | 0.22mi | 3/2.0 (+1) | 1,410 (-14%) | 14mo | $249,900 | $177 | 49 |
| 1192 Princeton Kenly Rd | 0.74mi | 3/2.0 (+1) | 1,822 (+11%) | 13mo | $290,000 | $159 | 32 |
| 301 S Darden St | 0.73mi | 3/2.0 (+1) | 1,494 (-9%) | 18mo | $219,900 | $147 | 30 |
Match score weights: distance 35% · size 25% · config 20% · recency 20%. Top-matched comps best support the ARV.
Projected returns pro-forma
10.0% appreciation · 3.0% rent growth · sell at horizon
- IRR
- 24.1%
- Equity multiple
- 2.93×
- Total profit
- $119,129
- Equity at exit
- $198,103
- IRR
- 21.4%
- Equity multiple
- 6.70×
- Total profit
- $351,239
- Equity at exit
- $427,217
Cash invested: $61,572 (down + closing). Projections, not guarantees.
Landlord ↔ Tenant lean methodology
- Overall (STATE)
- 85 Strongly Landlord-Friendly
- State North Carolina
- 85 Strongly Landlord-Friendly · R+3
- County
- — inherits STATE
- City
- — inherits STATE
ZIP-level market 27542
- Home prices YoY
- 16.6%
- Active inventory
- 89
- Price-to-rent
- 10.2×
Monthly cashflow live
- Estimated rent
- $1,800 medium interval (Pro) →
- Mortgage (P&I)
- −$1,153
- Tax from tax record
- −$187 /mo · $2,241/yr
- Insurance
- −$92
- HOA
- −$0
- Vacancy / Maint / Mgmt
- −$378
- Net cashflow
- $-10
Break-even live
Sensitivity live
| Price | -10% $115 | -5% $53 | +0% $-10 | +5% $-72 | +10% $-134 |
|---|---|---|---|---|---|
| Rent | -10% $-152 | -5% $-81 | +0% $-10 | +5% $62 | +10% $133 |
| Rate | -1.0pp $101 | -0.5pp $46 | base $-10 | +0.5pp $-67 | +1.0pp $-124 |
UW: 25.0% down · 7.5% · 30yr · 1.5% tax · 5.0% vac · 8.0% maint · 8.0% mgmt
Financing live
Cash to close
- Down payment
- $54,975
- Closing costs
- $6,597
- Reserves months
- —
- Total cash needed
- —
Loan-product check · same deal, 3 products live
Conventional
25% down · 7.5% · 30yr
- Down + closing
- —
- Monthly P&I
- —
- Monthly cashflow
- —
- DSCR
- —
- Eligible?
- —
Personal DTI + credit; lowest rate.
DSCR
20% down · 8.5% · 30yr
- Down + closing
- —
- Monthly P&I
- —
- Monthly cashflow
- —
- DSCR
- —
- Eligible?
- —
No personal income docs; deal must DSCR.
Hard money
10% down · 12.0% · 12mo
- Down + closing
- —
- Monthly P&I
- —
- Monthly cashflow
- —
- DSCR
- —
- Eligible?
- —
Short-term bridge; refi at stabilization.
Rent comps 1 comps
| Address | Beds | Baths | Sqft | Rent | $/sqft | DOM | Units | Dist |
|---|---|---|---|---|---|---|---|---|
| 309 S College Ave Kenly, NC | 3.0 | 2.0 | 1459 | $1,800 | $1.23 | 25d | 1 | 0.24mi |
Listing history 25 events
-
2026-06-21days on market $219,900 Active 94 DOM
-
2026-06-18days on market $219,900 Active 91 DOM
-
2026-06-17days on market $219,900 Active 90 DOM
-
2026-06-16pricedays on market $219,900 Active 89 DOM
-
2026-06-15days on market $233,700 Active 88 DOM
-
2026-06-13days on market $233,700 Active 86 DOM
-
2026-06-13days on market $233,700 Active 85 DOM
-
2026-06-09days on market $233,700 Active 82 DOM
-
2026-06-08days on market $233,700 Active 81 DOM
-
2026-06-08price $233,700 Active 80 DOM
-
2026-06-07days on market $233,800 Active 80 DOM
-
2026-06-05days on market $233,800 Active 77 DOM
-
2026-06-03days on market $233,800 Active 76 DOM
-
2026-06-02days on market $233,800 Active 75 DOM
-
2026-06-01days on market $233,800 Active 74 DOM
-
2026-05-31price $233,800 Active 73 DOM
-
2026-05-31days on market $233,900 Active 73 DOM
-
2026-05-21price $233,900
-
2026-04-27price $234,000
-
2026-04-27price $239,000
-
2026-04-07price $244,000
-
2026-03-18$249,000 Active
-
2024-11-20historical
-
2024-11-19$254,000 Active
-
2024-11-19$254,000 Active
ⓘ Source: listings_history table (triggers on properties + properties_extension) + one-shot
backfill from property_details.listing_events for pre-trigger history.
Tax reassessment forecast NC · Resets to sale price
- Current annual tax
- $2,241 · $187/mo
- Projected year-2 tax
- $2,241 · $187/mo
- Expected delta
- $0/yr ($0/mo · 0.0%)
ⓘ Screening estimate from a state-policy table — verify with the county assessor before closing.
Climate risk First Street
- Flood 1/10 Low FEMA zone X (unshaded) · 0% chance over 30 yrs
- Wildfire 4/10 Moderate
- Heat 7/10 Severe 7 d/yr ≥106°F today · 17 d/yr by 30 yrs out
- Wind 7/10 Severe 75% chance of damaging wind over 30 yrs
- Air quality 3/10 Moderate 3 unhealthy d/yr today · 3 by 30 yrs out
Nearby sold comps map
Loading sold comps map…
Walkable amenities ~0.75 mi
Loading nearby amenities…
Taxation est. · year 1
- Rental income
- $21,600
- − Mortgage interest
- −$12,318
- − Property taxes
- −$2,241
- − Insurance
- −$1,100
- − Repairs & maintenance
- −$1,728
- − Management
- −$1,728
- − Depreciation
- −$6,397
- Taxable loss
- −$3,911
- Est. tax savings @ 24.0%
- +$939
- After-tax cash flow
- $824/yr
For passive investors: Depreciation is non-cash, so a rental often shows a tax loss while cash-flowing — sheltering income. Rental losses are passive: they offset passive income freely, and up to $25,000/yr can offset ordinary (W-2) income if you actively participate and your MAGI is under $100k (phasing out to $0 by $150k); unused losses carry forward. On sale, claimed depreciation is recaptured at up to 25%, and gains may owe capital-gains tax (a 1031 exchange can defer both). Figures are a year-1 estimate at your 24.0% rate — not tax advice; consult a CPA.
Schools (NCES district)
- District
- Johnston County Public Schools
- NCES district ID
- 3702370
- Math proficiency
- 39% ▲ 4.00%
- Reading proficiency
- 42% ▲ 2.00%
- Median HH income
- $50,912
- Composite
- 34.99/100
- National rank
- #5052
- State rank
- #105 of 178 in NC
Livability — Kenly
- Score
- 68/100
- State rank
- #183
- US rank
- #9261
Category grades
Schools grade is shown separately in the Schools card above.
Census & demographics
- Census place
- Kenly, NC
- Population (ZIP)
- 9,441
Population outlook (Johnston County) Hauer SSP2
- Today (2025)
- 222,440 people
- By 2030
- 240,227 · +8.0%
- By 2040
- 274,616 · +23.5%
- By 2050
- 304,915 · +37.1%
- By 2075
- 369,507 · +66.1%
- By 2100
- 406,280 · +82.6%
Race, ethnicity, and origin ACS 2023
- Neighborhood character
- Predominantly White (74%)
- Race & ethnicity
- White 74% Black 13% Hispanic / Latino 9% Two or more races 9%
- Hispanic origin (detail)
- Mexican 8%
- Common ancestry
- Scotch-Irish 3% Serbian 1% Scottish 1%
- Foreign-born
- 4% · Canada
- Languages at home
- 91% English-only · Spanish 9%
Political lean MEDSL · Johnston
- 2024 margin
- Strong R (+21.5) · D 38.7% · R 60.2% · Other 1.1%
- 2008→2024 swing
- +2.2pp toward D · 2008: -23.7pp · 2024: -21.5pp
- All cycles
- 2024: R+21.5 2020: R+24.3 2016: R+30.7 2012: R+27.8 2008: R+23.7
Not yet ingested
- Civics
- —
Market trends
- HPI YoY
- ▲ 40.03%
- Current HPI
- 280.6408
- Rent YoY
- —
- Metro
- —
- State GDP YoY
- ▲ 3.28%
- F500 in state
- 26
Industry mix (Fortune 500 HQ in NC)
| Industry | F500 HQs | Revenue |
|---|---|---|
| Financial Services | 2 | $213B |
|
||
| Retail | 2 | $95B |
|
||
| Industrial Conglomerate | 1 | $38B |
|
||
| Metals / Steel | 1 | $35B |
|
||
| Utilities | 1 | $30B |
|
||
| Industrial Machinery | 1 | $19B |
|
||
Price history
-7.9% since first listed8 events — show timeline
- 2026-05-21 Price Changed $233,900 TMLS
- 2026-04-27 Price Changed $234,000 TMLS
- 2026-04-27 Price Changed $239,000 TMLS
- 2026-04-07 Price Changed $244,000 TMLS
- 2026-03-18 Listed $249,000 TMLS
- 2024-11-20 Listing Removed — TMLS
- 2024-11-19 Listed $254,000 TMLS
- 2024-11-19 Listed $254,000 Hive MLS
Property tax history
+3.6%/yrLatest (2025): $2,241 · +53.5% YoY. Source: county tax records.
Cash-flow waterfall
monthlySold comps — $/sqft
last 12 mo · ≤1 miLoading sold comps…