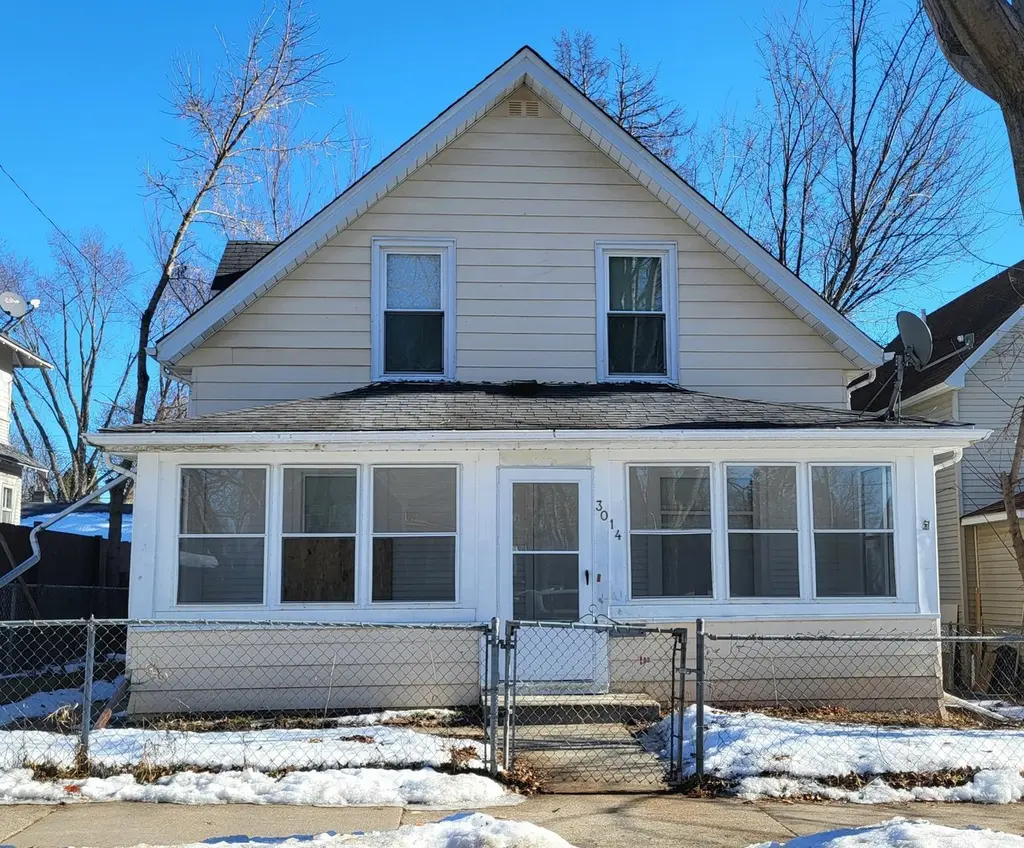
3014 Russell Ave N · Minneapolis, MN
Flood risk 1/10 · Minimal
- FEMA flood zone
- X (unshaded)
- Chance of flooding over 30 yrs
- 0.0%
- Est. flood insurance / yr
- $473 – $860
Fire risk 1/10 · Minimal
- Est. fire insurance / yr
- $888 – $1,650
Heat risk 2/10 · Minimal
- Hot days now (above 99°F)
- 7 days/yr
- Hot days in 30 yrs
- 14 days/yr
Wind risk 2/10 · Minimal
- Chance of severe wind over 30 yrs
- —
Air-quality risk 2/10 · Minimal
- Unhealthy air days now
- 1 days/yr
- Unhealthy air days in 30 yrs
- 1 days/yr
Risk factors via First Street. Map © Google.
Why this score? — see what drove the B- grade
The composite is a weighted blend of 9 inputs, each scored 0–100. Each bar is that input's sub-score; the figure is the points it added to the 100-point composite (weight × sub-score).
- Cash flow +24.1/30.0
- ARV discount +15.0/15.0
- DSCR +7.8/10.0
- 1% rule +5.4/10.0
- Rent growth +4.3/5.0
- Livability +3.9/5.0
- Schools +3.5/10.0
- Condition / age +2.5/5.0
- Appreciation +0.0/10.0
$209,899
🖨 Deal sheet 📄 Offer letter ✓ Due diligence
Listing remarks MLS
$15,000 in Forgivable Down Payment Grant Assistance available for this 4 beds, 2 baths recently updated home that is close to shopping and the bus line, perfect for those who want to live a stress-free lifestyle and enjoy everything Minneapolis has to offer. Close to HyVee, the hospital and more. This home has an updated kitchen, paint, flooring and bathrooms. A wonderful front porch gives you a relaxing area to take in the evenings once the weather warms up. Large, flat backyard gives you ample space for pets. This is affordable living in the city. Make this home yours today!
Key facts
- Close to hospital
- Updated kitchen
- Large flat backyard
Tags
Neighborhood map
What this means for you Summary
Snapshot
- This is a 4-bed/1.5-bath single-family listed at $210k.
Deal economics
- At list price, monthly cash flow is $413 ($5k/yr) — positive.
- The deal already cash-flows at list — no discount required.
- Meets the 1% rule at list price ($2k rent vs $210k).
- Recommended offer: $185k (12.0% below list) — sets the bar for market timing.
- Cap rate 8.7% vs local median 3.1% in Minneapolis — top-decile yield for the area; either an underpriced asset or a hidden risk that comps aren't pricing in. Stress-test before assuming the spread holds.
Location & tenants
- Location reads 78/100 on livability (#110 in MN, #2,525 nationally) — a middle-class / working-renter tenant base. Strengths: amenities A+, commute A+, housing A+; Watch: cost of living C-, crime F.
- Minneapolis Public School District (urban): math 35% / reading 46% proficiency, ranked #217 of 301 in MN (top 72%) — families likely to look elsewhere, expect single-tenant / working-renter base with shorter leases.
- Market conditions: Rents rising fast (+7.3%/yr); 132 active listings in the ZIP; 26 comparable units currently listed for rent nearby; rentals at typical pace (median 24d on market — plan ~3-4 weeks tenant-placement turnaround); 4,651 units permitted in Hennepin County in 2024 (2,443 in 5+ unit buildings).
- This rent runs 44% of the median local income ($60k/yr) — at the standard rent-burdened threshold; future hikes will face affordability resistance.
Forward outlook
- Local home prices are declining (-3.0%/yr); year-one equity from $1k of loan paydown is wiped out by about $6k of value loss. Plan a longer hold.
- Hennepin County population projected at +30% by 2050 — long-run rental-demand tailwind backs the buy-and-hold thesis.
- At projected returns (-3.0% appreciation + 7.3% rent growth), your $59k cash investment doubles in ~9 years — after that, you're playing with house money.
Negotiation context
- It's been on market 153 days — a 12% lower offer ($185k) is reasonable based on typical stale-listing flexibility.
- 5 sale attempts since 15y ago with the ask held roughly flat each time — persistent listings suggest the price (not the market) is what's stuck; bring a comps-based counter.
- Current owner paid $13k; list at $210k implies a 1546% gain — meaningful room to come down on a strong offer.
Risks & watch-outs
- Watch-outs: built in 1915 — expect roof / HVAC / electrical / plumbing capex.
Questions for the listing agent
- It's been on market 153 days. Have you received any prior offers? Is the seller open to a 12% concession, seller financing, or rate buy-down credit?
- Built in 1915 — when were the roof, HVAC, electrical panel, plumbing, and water heater last replaced?
- Why hasn't it sold? Are there any deal-killer items the seller is aware of (foundation, flood, title, zoning, code violations)?
- Is there a deadline driving the sale (1031 exchange, divorce, estate, relocation)? That informs how much negotiation room exists.
- Crime grade is F in this area — have there been break-ins, vandalism, or insurance claims at this property in the last 3 years? What carrier currently insures it and at what premium?
- What's the average days-on-market for RENTAL listings here right now (not sales)? A rising rental-DOM trend means longer vacancies and softer asking-rent achievability than the comps imply.
- What's the recent tenant-quality profile in this submarket — average credit score on applications, eviction rate, late-payment / NSF rate, and stable-employment percentage? A property-management company in the area should have these aggregated.
- How much new for-sale + rental construction is in the pipeline within 1–3 miles? Heavy new supply typically softens prices + rents 12–24 months out; constrained supply supports both.
Investment metrics
- 1% rule
- 1.04% ✓
- Cap rate
- 8.66%
- Cash-on-cash
- 8.44%
- DSCR
- 1.38
- GRM
- 8.0
CMA / ARV
- ARV (median comp)
- $253,218
- List price
- $209,899
- Delta
- -17.11%
- Verdict
- UNDERPRICED
- Comps
- 7 within 1.0 mi
Show comp detail 1 sale within ~0.75 mi
| Address | Dist | Beds/Ba | Sqft | Sold | Price | $/sf | Match |
|---|---|---|---|---|---|---|---|
| 2806 Penn Ave N | 0.24mi | 3/2.0 (-1) | 1,080 (-1%) | 13mo | $214,500 | $199 | 69 |
Match score weights: distance 35% · size 25% · config 20% · recency 20%. Top-matched comps best support the ARV.
Projected returns pro-forma
-3.0% appreciation · 7.35% rent growth · sell at horizon
- IRR
- 1.0%
- Equity multiple
- 1.04×
- Total profit
- $2,276
- Equity at exit
- $31,297
- IRR
- 14.3%
- Equity multiple
- 2.37×
- Total profit
- $80,627
- Equity at exit
- $18,148
Cash invested: $58,772 (down + closing). Projections, not guarantees.
Landlord ↔ Tenant lean methodology
- Overall (CITY)
- 34 Tenant-Leaning
- State Minnesota
- 46 Balanced · D+2
- County
- — inherits STATE
- City Minneapolis
- 34 Tenant-Leaning · D+50
ZIP-level market 55411
- Home prices YoY
- -8.7%
- Rents YoY
- 7.3%
- Active inventory
- 132
- Price-to-rent
- 8.0×
Monthly cashflow live
- Estimated rent
- $2,191 high interval (Pro) →
- Mortgage (P&I)
- −$1,101
- Tax from tax record
- −$130 /mo · $1,554/yr
- Insurance
- −$87
- HOA
- −$0
- Vacancy / Maint / Mgmt
- −$460
- Net cashflow
- $413
Break-even live
UW: 25.0% down · 7.5% · 30yr · 1.5% tax · 5.0% vac · 8.0% maint · 8.0% mgmt
Financing live
Cash to close
- Down payment
- $52,475
- Closing costs
- $6,297
- Reserves months
- —
- Total cash needed
- —
Loan-product check · same deal, 3 products live
Conventional
25% down · 7.5% · 30yr
- Down + closing
- —
- Monthly P&I
- —
- Monthly cashflow
- —
- DSCR
- —
- Eligible?
- —
Personal DTI + credit; lowest rate.
DSCR
20% down · 8.5% · 30yr
- Down + closing
- —
- Monthly P&I
- —
- Monthly cashflow
- —
- DSCR
- —
- Eligible?
- —
No personal income docs; deal must DSCR.
Hard money
10% down · 12.0% · 12mo
- Down + closing
- —
- Monthly P&I
- —
- Monthly cashflow
- —
- DSCR
- —
- Eligible?
- —
Short-term bridge; refi at stabilization.
Rent comps 26 comps
| Address | Beds | Baths | Sqft | Rent | $/sqft | DOM | Units | Dist |
|---|---|---|---|---|---|---|---|---|
| 3114 Morgan Ave N Minneapolis, MN | 4.0 | 2.0 | 1362 | $2,000 | $1.47 | 14d | 1 | 0.34mi |
| 3315 James Ave N Minneapolis, MN | 4.0 | 1.0 | 1400 | $2,100 | $1.50 | 4d | 1 | 0.55mi |
| 2356 N Thomas Ave Unit 2 Minneapolis, MN | 3.0 | 1.0 | 1000 | $1,800 | $1.80 | 43d | 1 | 0.56mi |
| 3526 Newton Ave N Minneapolis, MN | 5.0 | 2.0 | 1470 | $2,795 | $1.90 | 1d | 1 | 0.58mi |
| 3238 Humboldt Ave N Minneapolis, MN | 5.0 | 1.0 | 1389 | $2,100 | $1.51 | 43d | 1 | 0.67mi |
| 2703 Humboldt Ave N Minneapolis, MN | 3.0 | 1.0 | 1218 | $1,450 | $1.19 | 21d | 1 | 0.68mi |
| 3105 N Girard Ave Unit 2 Minneapolis, MN | 4.0 | 1.0 | 1250 | $2,300 | $1.84 | 24d | 1 | 0.68mi |
| 2324 Logan Ave N Minneapolis, MN | 4.0 | 1.5 | 1400 | $2,300 | $1.64 | 44d | 1 | 0.69mi |
| 2211 Queen Ave N Unit 1 Minneapolis, MN | 3.0 | 1.0 | 983 | $1,695 | $1.72 | 17d | 1 | 0.70mi |
| 1510 N 22nd Ave #1 Minneapolis, MN | 3.0 | 1.0 | 1500 | $1,875 | $1.25 | 4d | 1 | 0.89mi |
| 1510 N 22nd Ave #1 Minneapolis, MN | 3.0 | 1.0 | 1500 | $1,875 | $1.25 | 21d | 1 | 0.89mi |
| 1523 22nd Ave N Minneapolis, MN | 3.0 | 1.0 | 943 | $1,695 | $1.80 | 14d | 1 | 0.90mi |
| 2411 Golden Valley Rd Unit 2 Minneapolis, MN | 4.0 | 2.0 | 1200 | $2,395 | $2.00 | 14d | 1 | 0.93mi |
| 3419 Grimes Ave N Minneapolis, MN | 3.0 | 1.5 | 1300 | $2,050 | $1.58 | 43d | 1 | 1.01mi |
| 1816 Zephyr Pl Minneapolis, MN | 3.0 | 1.0 | 1120 | $2,050 | $1.83 | 43d | 1 | 1.03mi |
| 1649 Russell Ave N Unit 2 Minneapolis, MN | 3.0 | 1.0 | 1011 | $1,700 | $1.68 | 20d | 1 | 1.06mi |
| 3522 Bryant Ave N Minneapolis, MN | 5.0 | 2.0 | 1449 | $2,995 | $2.07 | 43d | 1 | 1.13mi |
| 3211 N 6th St Unit 2 Minneapolis, MN | 4.0 | 1.0 | 900 | $1,450 | $1.61 | 24d | 1 | 1.19mi |
| 3247 N 6th St Minneapolis, MN | 5.0 | 1.5 | 1405 | $2,350 | $1.67 | 21d | 1 | 1.20mi |
| 3247 N 6th St Minneapolis, MN | 5.0 | 1.5 | 1405 | $2,350 | $1.67 | 43d | 1 | 1.20mi |
| 3247 N 6th St Minneapolis, MN | 5.0 | 1.5 | 1405 | $2,350 | $1.67 | 24d | 1 | 1.20mi |
| 1507 N Newton Ave Unit 2 Minneapolis, MN | 4.0 | 1.0 | 1068 | $1,499 | $1.40 | 43d | 1 | 1.24mi |
| 1429 Knox Ave N Unit 1429 Minneapolis, MN | 4.0 | 1.0 | 1260 | $1,995 | $1.58 | 43d | 1 | 1.31mi |
| 318 N 27th Ave #2 Minneapolis, MN | 3.0 | 1.0 | 1200 | $1,800 | $1.50 | 43d | 1 | 1.35mi |
| 318 N 27th Ave #2 Minneapolis, MN | 3.0 | 1.0 | 1200 | $1,800 | $1.50 | 4d | 1 | 1.35mi |
| 2419 Plymouth Ave N Minneapolis, MN | 2.0–3.0 | 1.0 | 836 | $1,795 | $2.15 | 4d | 2 | 1.43mi |
Listing history 27 events
-
2026-06-18days on market $209,899 Active 153 DOM
-
2026-06-17days on market $209,899 Active 152 DOM
-
2026-06-16remarks 589-char remark
-
2026-06-16pricedays on market $209,899 Active 151 DOM
-
2026-06-15days on market $209,900 Active 150 DOM
-
2026-06-13days on market $209,900 Active 148 DOM
-
2026-06-09days on market $209,900 Active 144 DOM
-
2026-06-08days on market $209,900 Active 143 DOM
-
2026-06-07days on market $209,900 Active 142 DOM
-
2026-06-04days on market $209,900 Active 139 DOM
-
2026-06-03days on market $209,900 Active 138 DOM
-
2026-06-02days on market $209,900 Active 137 DOM
-
2026-06-01days on market $209,900 Active 136 DOM
-
2026-05-31days on market $209,900 Active 135 DOM
-
2026-01-16$209,900 Active 586-char remark
Show marketing remark (586 chars)
$15,000 in Forgivable Down Payment Grant Assistance available for this 4 beds, 2 baths recently updated home that is close to shopping and the bus line, perfect for those who want to live a stress-free lifestyle and enjoy everything Minneapolis has to offer. Close to HyVee, the hospital and more. This home has an updated kitchen, paint, flooring and bathrooms. A wonderful front porch gives you a relaxing area to take in the evenings once the weather warms up. Large, flat backyard gives you ample space for pets. This is affordable living in the city. Make this home yours today!
-
2026-01-01historical
-
2025-09-03$209,900 Active
-
2025-09-01historical
-
2025-08-18price $209,900
-
2025-07-03price $215,000
-
2025-06-13price $225,000
-
2025-05-10$249,900 Active
-
2012-01-20soldstatus $12,750
-
2011-10-21$12,500
-
2011-07-31historical
-
2011-01-31$24,900
-
1999-08-06soldstatus $65,000
ⓘ Source: listings_history table (triggers on properties + properties_extension) + one-shot
backfill from property_details.listing_events for pre-trigger history.
Tax reassessment forecast MN · Partial reset (capped growth)
- Current annual tax
- $1,554 · $130/mo
- Projected year-2 tax
- $1,953 · $163/mo
- Expected delta
- +$398/yr (+$33/mo · 25.6%)
ⓘ Screening estimate from a state-policy table — verify with the county assessor before closing.
Climate risk First Street
- Flood 1/10 Low FEMA zone X (unshaded) · 0% chance over 30 yrs
- Wildfire 1/10 Low
- Heat 2/10 Low 7 d/yr ≥99°F today · 14 d/yr by 30 yrs out
- Wind 2/10 Low
- Air quality 2/10 Low 1 unhealthy d/yr today · 1 by 30 yrs out
Nearby sold comps map
Loading sold comps map…
Walkable amenities ~0.75 mi
Loading nearby amenities…
Taxation est. · year 1
- Rental income
- $26,295
- − Mortgage interest
- −$11,758
- − Property taxes
- −$1,554
- − Insurance
- −$1,049
- − Repairs & maintenance
- −$2,104
- − Management
- −$2,104
- − Depreciation
- −$6,106
- Taxable income
- $1,620
- Est. tax owed @ 24.0%
- −$389
- After-tax cash flow
- $4,572/yr
For passive investors: Depreciation is non-cash, so a rental often shows a tax loss while cash-flowing — sheltering income. Rental losses are passive: they offset passive income freely, and up to $25,000/yr can offset ordinary (W-2) income if you actively participate and your MAGI is under $100k (phasing out to $0 by $150k); unused losses carry forward. On sale, claimed depreciation is recaptured at up to 25%, and gains may owe capital-gains tax (a 1031 exchange can defer both). Figures are a year-1 estimate at your 24.0% rate — not tax advice; consult a CPA.
Schools (NCES district)
- District
- Minneapolis Public School District
- NCES district ID
- 2721240
- Math proficiency
- 35% ▼ -7.00%
- Reading proficiency
- 46% ▼ -1.00%
- Median HH income
- $50,521
- Composite
- 34.92/100
- National rank
- #5067
- State rank
- #217 of 301 in MN
Livability — Minneapolis
- Score
- 78/100
- State rank
- #110
- US rank
- #2525
Category grades
Schools grade is shown separately in the Schools card above.
Census & demographics
- Census place
- Minneapolis, MN
- County
- Hennepin County · 1,150,272 people
- City population
- 417,555
- Metro
- Minneapolis-St. Paul-Bloomington, MN-WI
- Population (ZIP)
- 27,741
- Household income
- $60,225
- Rent vs Own
- Severe rent burden
- 1826.0
Population outlook (Hennepin County) Hauer SSP2
- Today (2025)
- 1,405,227 people
- By 2030
- 1,492,650 · +6.2%
- By 2040
- 1,660,157 · +18.1%
- By 2050
- 1,823,498 · +29.8%
- By 2075
- 2,221,283 · +58.1%
- By 2100
- 2,509,976 · +78.6%
Race, ethnicity, and origin ACS 2023
- Neighborhood character
- Diverse neighborhood (Simpson 0.68)
- Race & ethnicity
- Black 49% White 23% Two or more races 11% Hispanic / Latino 11% Asian 9%
- Hispanic origin (detail)
- Mexican 7% Puerto Rican 1%
- Common ancestry
- Portuguese 3% Lithuanian 2% Italian 1%
- Foreign-born
- 19% · Canada, Guatemala
- Languages at home
- 68% English-only · Other Asian/Pacific 8% Spanish 8%
Political lean MEDSL · Hennepin
- 2024 margin
- Solid D (+42.6) · D 70.2% · R 27.5% · Other 2.3%
- 2008→2024 swing
- +14.0pp toward D · 2008: 28.6pp · 2024: 42.6pp
- All cycles
- 2024: D+42.6 2020: D+43.2 2016: D+35.3 2012: D+27.1 2008: D+28.6
Not yet ingested
- Civics
- —
Market trends
- HPI YoY
- ▼ -33.91%
- Current HPI
- 356.6758
- Rent YoY
- ▲ 7.35%
- Metro
- Minneapolis-St. Paul-Bloomington, MN-WI
- State GDP YoY
- ▲ 2.41%
- F500 in state
- 34
Industry mix (Fortune 500 HQ in MN)
| Industry | F500 HQs | Revenue |
|---|---|---|
| Healthcare | 2 | $407B |
|
||
| Retail | 2 | $150B |
|
||
| Consumer Goods | 2 | $32B |
|
||
| Industrial Machinery | 2 | $6B |
|
||
| Agriculture | 1 | $40B |
|
||
| Healthcare / Medical Devices | 1 | $32B |
|
||
Price history
+222.9% since first listed13 events — show timeline
- 2026-01-16 Listed $209,900 NORTHSTARMLS as Distributed by MLS Grid
- 2026-01-01 Listing Removed — NORTHSTARMLS as Distributed by MLS Grid
- 2025-09-03 Listed $209,900 NORTHSTARMLS as Distributed by MLS Grid
- 2025-09-01 Listing Removed — NORTHSTARMLS as Distributed by MLS Grid
- 2025-08-18 Price Changed $209,900 NORTHSTARMLS as Distributed by MLS Grid
- 2025-07-03 Price Changed $215,000 NORTHSTARMLS as Distributed by MLS Grid
- 2025-06-13 Price Changed $225,000 NORTHSTARMLS as Distributed by MLS Grid
- 2025-05-10 Listed $249,900 NORTHSTARMLS as Distributed by MLS Grid
- 2012-01-20 Sold (MLS) $12,750 NORTHSTARMLS as Distributed by MLS Grid
- 2011-10-21 Listed $12,500 NORTHSTARMLS as Distributed by MLS Grid
- 2011-07-31 Listing Removed — NORTHSTARMLS as Distributed by MLS Grid
- 2011-01-31 Listed $24,900 NORTHSTARMLS as Distributed by MLS Grid
- 1999-08-06 Sold (Public Records) $65,000 Public Records
Property tax history
+2.5%/yrLatest (2025): $1,554 · -29.1% YoY. Source: county tax records.
Cash-flow waterfall
monthlySold comps — $/sqft
last 12 mo · ≤1 miLoading sold comps…