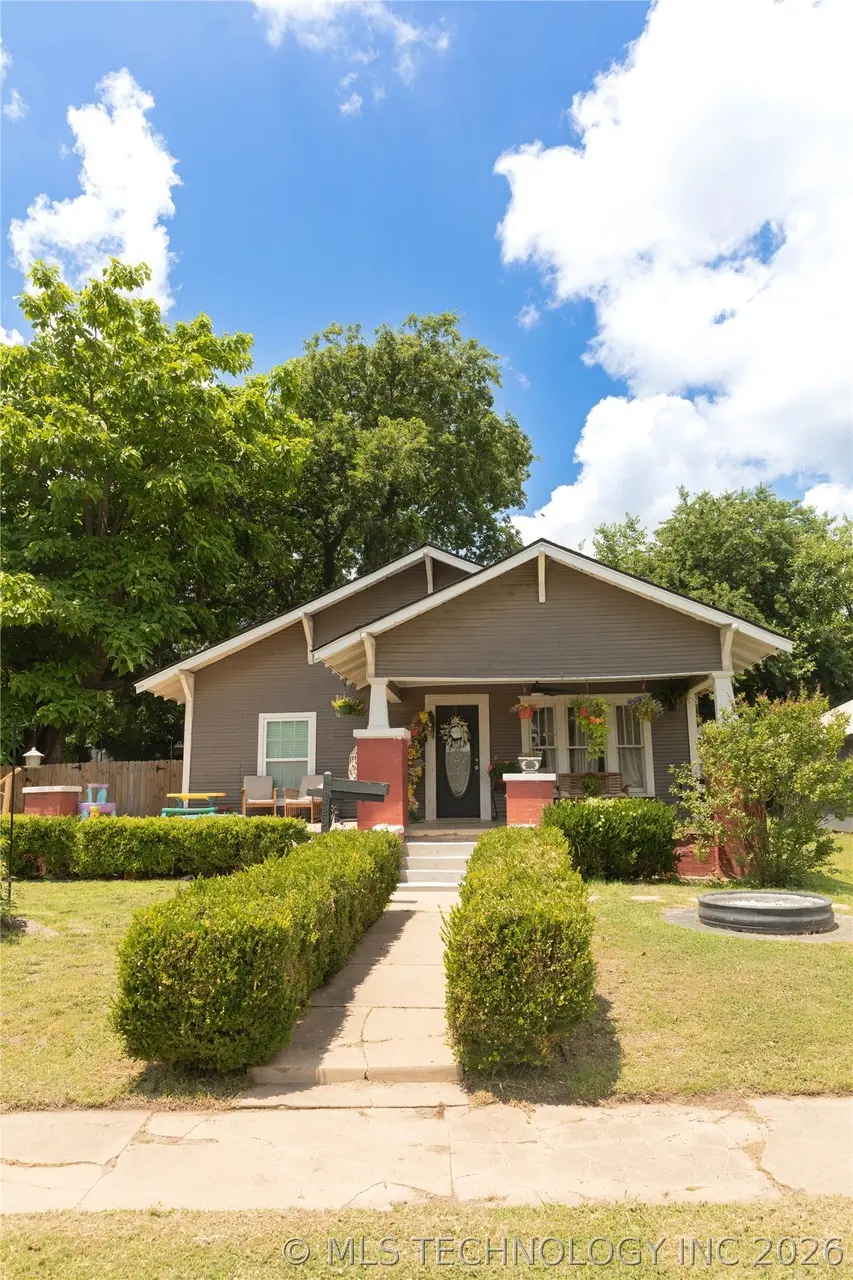
423 S Johnston St · Ada, OK
Flood risk 1/10 · Minimal
- FEMA flood zone
- X (unshaded)
- Chance of flooding over 30 yrs
- 0.0%
- Est. flood insurance / yr
- $507 – $1,088
Fire risk 7/10 · Major
- Est. fire insurance / yr
- $2,463 – $4,575
Heat risk 6/10 · Moderate
- Hot days now (above 109°F)
- 7 days/yr
- Hot days in 30 yrs
- 19 days/yr
Wind risk 4/10 · Minor
- Chance of severe wind over 30 yrs
- 9.0%
Air-quality risk 2/10 · Minimal
- Unhealthy air days now
- 1 days/yr
- Unhealthy air days in 30 yrs
- 1 days/yr
Risk factors via First Street. Map © Google.
Why this score? — see what drove the C+ grade
The composite is a weighted blend of 9 inputs, each scored 0–100. Each bar is that input's sub-score; the figure is the points it added to the 100-point composite (weight × sub-score).
- Cash flow +23.7/30.0
- ARV discount +15.0/15.0
- DSCR +7.6/10.0
- 1% rule +5.3/10.0
- Rent growth +3.7/5.0
- Livability +3.5/5.0
- Condition / age +2.5/5.0
- Schools +1.6/10.0
- Appreciation +0.0/10.0
$115,000
🖨 Deal sheet 📄 Offer letter ✓ Due diligence
Listing remarks MLS
Looking for an affordable move-in ready home? This is it! Home offers 3 bedrooms, 1 roomy updated bathroom, large living/dining room areas, updated kitchen with pantry, CH & A & much more. Home is situated on a spacious corner lot!
Key facts
- Water softener
- Gas log fireplace
- Move in ready
Tags
Property features AI
Finance
- HOA & community: Sidewalks
Exterior
- Parking: Detached garage (1 car)
- Security: No safety shelter
- Utilities: Public water; Public sewer; Cable available; Phone available
- Home design: Single-story; Faces east; Entry on main level
- Construction: Wood siding and wood frame construction; Asphalt/fiberglass roof; Crawlspace foundation; Built per public records
- Exterior features: Covered porch; Corner lot
Interior
- Kitchen: Dishwasher; Oven; Range; Refrigerator; Gas water heater
- Flooring: Laminate flooring
- Bathrooms: 1 full bathroom
- Heating & cooling: Central heating (gas); Central air conditioning
- Interior features: Ceiling fan(s); Laminate counters; Vinyl windows with wood frames; Gas range connection
- Laundry & utility: Electric dryer hookup; Water softener
Neighborhood map
What this means for you Summary
Snapshot
- This is a 3-bed/1.0-bath single-family listed at $115k.
Deal economics
- At list price, monthly cash flow is $220 ($3k/yr) — positive.
- The deal already cash-flows at list — no discount required.
- Meets the 1% rule at list price ($1k rent vs $115k).
- Cap rate 8.6% vs local median 4.0% in Ada — top-decile yield for the area; either an underpriced asset or a hidden risk that comps aren't pricing in. Stress-test before assuming the spread holds.
Location & tenants
- Location reads 70/100 on livability (#41 in OK) — a middle-class / working-renter tenant base. Strengths: cost of living A+, housing A+, health & safety A; Watch: schools D, employment D, crime D-.
- Ada (town): math 17% / reading 23% proficiency, ranked #177 of 270 in OK (top 66%) — low school quality limits family demand, transient renter base, plan for 1-2y turnover.
- Market conditions: Rents rising fast (+4.8%/yr); 305 active listings in the ZIP; 2 units permitted in Pontotoc County in 2024 (0 in 5+ unit buildings).
Forward outlook
- Local home prices are declining (-3.0%/yr); year-one equity from $795 of loan paydown is wiped out by about $3k of value loss. Plan a longer hold.
- Pontotoc County population projected at +7% by 2050 — modest demand growth; plan on rents tracking national, not racing it.
- At projected returns (-3.0% appreciation + 4.8% rent growth), your $32k cash investment doubles in ~10 years — after that, you're playing with house money.
Negotiation context
- Only 1 days on market — expect competitive offers; lowballing is unlikely to land.
- 3 sale attempts since 10y ago with the ask held roughly flat each time — persistent listings suggest the price (not the market) is what's stuck; bring a comps-based counter.
- Current owner paid $68k; list at $115k implies a 70% gain — meaningful room to come down on a strong offer.
Risks & watch-outs
- Watch-outs: built in 1940 — expect roof / HVAC / electrical / plumbing capex.
- Climate carrying-cost: major wildfire risk; extreme-heat days projected 7→19/yr by 2055 (HVAC capex compounding) — expect insurance premiums to compound above CPI over the hold.
Questions for the listing agent
- Built in 1940 — when were the roof, HVAC, electrical panel, plumbing, and water heater last replaced?
- Is there a deadline driving the sale (1031 exchange, divorce, estate, relocation)? That informs how much negotiation room exists.
- Schools are D-rated, which usually means shorter tenancies and higher turnover. Who's the typical renter profile here, and what's been the actual vacancy rate?
- Crime grade is D in this area — have there been break-ins, vandalism, or insurance claims at this property in the last 3 years? What carrier currently insures it and at what premium?
- What's the average days-on-market for RENTAL listings here right now (not sales)? A rising rental-DOM trend means longer vacancies and softer asking-rent achievability than the comps imply.
- What's the recent tenant-quality profile in this submarket — average credit score on applications, eviction rate, late-payment / NSF rate, and stable-employment percentage? A property-management company in the area should have these aggregated.
- How much new for-sale + rental construction is in the pipeline within 1–3 miles? Heavy new supply typically softens prices + rents 12–24 months out; constrained supply supports both.
Investment metrics
- 1% rule
- 1.03% ✓
- Cap rate
- 8.59%
- Cash-on-cash
- 8.19%
- DSCR
- 1.36
- GRM
- 8.1
CMA / ARV
- ARV (on-the-fly)
- $151,320
- Comps found
- 12
Show comp detail 12 sales within ~0.75 mi
| Address | Dist | Beds/Ba | Sqft | Sold | Price | $/sf | Match |
|---|---|---|---|---|---|---|---|
| 812 S Johnston St | 0.27mi | 3/2.0 | 1,173 (+1%) | 3mo | $165,000 | $141 | 80 |
| 716 W 12th St | 0.31mi | 2/1.0 (-1) | 1,189 (+2%) | 1mo | $124,000 | $104 | 76 |
| 704 W 21st St | 0.48mi | 3/1.0 | 1,139 (-2%) | 2mo | $152,000 | $133 | 72 |
| 301 S Hickory | 0.29mi | 2/1.0 (-1) | 1,100 (-6%) | 3mo | $51,500 | $47 | 70 |
| 912 W 13th St | 0.41mi | 3/1.0 | 1,080 (-7%) | 1mo | $150,000 | $139 | 68 |
| 516 W 7th St | 0.58mi | 2/1.0 (-1) | 1,184 (+2%) | 3mo | $52,500 | $44 | 62 |
| 319 E 13th St | 0.63mi | 3/1.0 | 1,284 (+10%) | 1mo | $138,000 | $107 | 53 |
| 419 W 5th | 0.70mi | 3/1.0 | 1,056 (-9%) | 1mo | $6,000 | $6 | 51 |
| 914 Charles Dr | 0.74mi | 3/1.0 | 1,047 (-10%) | 1mo | $100,000 | $96 | 48 |
| 1209 S Ash Ave | 0.58mi | 3/1.0 | 996 (-14%) | 1mo | $129,500 | $130 | 48 |
| 620 W 23rd | 0.60mi | 3/1.0 | 1,002 (-14%) | 2mo | $143,000 | $143 | 47 |
| 418 W 6th St | 0.66mi | 2/1.0 (-1) | 1,012 (-13%) | 1mo | $132,000 | $130 | 42 |
Match score weights: distance 35% · size 25% · config 20% · recency 20%. Top-matched comps best support the ARV.
Projected returns pro-forma
-3.0% appreciation · 4.83% rent growth · sell at horizon
- IRR
- -2.0%
- Equity multiple
- 0.92×
- Total profit
- $-2,431
- Equity at exit
- $17,147
- IRR
- 9.5%
- Equity multiple
- 1.79×
- Total profit
- $25,300
- Equity at exit
- $9,943
Cash invested: $32,200 (down + closing). Projections, not guarantees.
Landlord ↔ Tenant lean methodology
- Overall (STATE)
- 83 Strongly Landlord-Friendly
- State Oklahoma
- 83 Strongly Landlord-Friendly · R+20
- County
- — inherits STATE
- City
- — inherits STATE
ZIP-level market 74820
- Home prices YoY
- -11.5%
- Rents YoY
- 4.8%
- Active inventory
- 305
- Price-to-rent
- 8.1×
Monthly cashflow live
- Estimated rent
- $1,190 medium interval (Pro) →
- Mortgage (P&I)
- −$603
- Tax from tax record
- −$69 /mo · $827/yr
- Insurance
- −$48
- HOA
- −$0
- Vacancy / Maint / Mgmt
- −$250
- Net cashflow
- $220
Break-even live
UW: 25.0% down · 7.5% · 30yr · 1.5% tax · 5.0% vac · 8.0% maint · 8.0% mgmt
Financing live
Cash to close
- Down payment
- $28,750
- Closing costs
- $3,450
- Reserves months
- —
- Total cash needed
- —
Loan-product check · same deal, 3 products live
Conventional
25% down · 7.5% · 30yr
- Down + closing
- —
- Monthly P&I
- —
- Monthly cashflow
- —
- DSCR
- —
- Eligible?
- —
Personal DTI + credit; lowest rate.
DSCR
20% down · 8.5% · 30yr
- Down + closing
- —
- Monthly P&I
- —
- Monthly cashflow
- —
- DSCR
- —
- Eligible?
- —
No personal income docs; deal must DSCR.
Hard money
10% down · 12.0% · 12mo
- Down + closing
- —
- Monthly P&I
- —
- Monthly cashflow
- —
- DSCR
- —
- Eligible?
- —
Short-term bridge; refi at stabilization.
Listing history 10 events
-
2026-05-30status Pending
-
2026-05-29$115,000 Active
-
2023-04-05soldstatus $67,500
-
2023-04-04soldstatus $67,500 Closed 243-char remark
Show marketing remark (243 chars)
Looking for an affordable move-in ready home? This is it! Home offers 3 bedrooms, 1 roomy updated bathroom, large living/dining room areas, updated kitchen with pantry, CH & A & much more. Home is situated on a spacious corner lot!
-
2023-02-20status Pending 243-char remark
Show marketing remark (243 chars)
Looking for an affordable move-in ready home? This is it! Home offers 3 bedrooms, 1 roomy updated bathroom, large living/dining room areas, updated kitchen with pantry, CH & A & much more. Home is situated on a spacious corner lot!
-
2023-02-19$69,900 Active 243-char remark
Show marketing remark (243 chars)
Looking for an affordable move-in ready home? This is it! Home offers 3 bedrooms, 1 roomy updated bathroom, large living/dining room areas, updated kitchen with pantry, CH & A & much more. Home is situated on a spacious corner lot!
-
2017-02-22soldstatus $65,500
-
2017-02-20soldstatus $65,500 234-char remark
Show marketing remark (234 chars)
This home definitely catches your eye! This adorable home sitting on a corner lot has had a recent makeover! New exterior paint, updated kitchen and bath and flooring makes this an excellent home for the money! Home Warranty included!
-
2016-08-22$69,900 234-char remark
Show marketing remark (234 chars)
This home definitely catches your eye! This adorable home sitting on a corner lot has had a recent makeover! New exterior paint, updated kitchen and bath and flooring makes this an excellent home for the money! Home Warranty included!
-
2002-02-28soldstatus $25,000
ⓘ Source: listings_history table (triggers on properties + properties_extension) + one-shot
backfill from property_details.listing_events for pre-trigger history.
Tax reassessment forecast OK · Resets to sale price
- Current annual tax
- $827 · $69/mo
- Projected year-2 tax
- $1,035 · $86/mo
- Expected delta
- +$208/yr (+$17/mo · 25.2%)
ⓘ Screening estimate from a state-policy table — verify with the county assessor before closing.
Climate risk First Street
- Flood 1/10 Low FEMA zone X (unshaded) · 0% chance over 30 yrs
- Wildfire 7/10 Severe
- Heat 6/10 Major 7 d/yr ≥109°F today · 19 d/yr by 30 yrs out
- Wind 4/10 Moderate 9% chance of damaging wind over 30 yrs
- Air quality 2/10 Low 1 unhealthy d/yr today · 1 by 30 yrs out
Nearby sold comps map
Loading sold comps map…
Walkable amenities ~0.75 mi
Loading nearby amenities…
Taxation est. · year 1
- Rental income
- $14,275
- − Mortgage interest
- −$6,442
- − Property taxes
- −$827
- − Insurance
- −$575
- − Repairs & maintenance
- −$1,142
- − Management
- −$1,142
- − Depreciation
- −$3,345
- Taxable income
- $802
- Est. tax owed @ 24.0%
- −$192
- After-tax cash flow
- $2,446/yr
For passive investors: Depreciation is non-cash, so a rental often shows a tax loss while cash-flowing — sheltering income. Rental losses are passive: they offset passive income freely, and up to $25,000/yr can offset ordinary (W-2) income if you actively participate and your MAGI is under $100k (phasing out to $0 by $150k); unused losses carry forward. On sale, claimed depreciation is recaptured at up to 25%, and gains may owe capital-gains tax (a 1031 exchange can defer both). Figures are a year-1 estimate at your 24.0% rate — not tax advice; consult a CPA.
Schools (NCES district)
- District
- Ada
- NCES district ID
- 4002430
- Math proficiency
- 17% ▼ -11.00%
- Reading proficiency
- 23% ▼ -8.00%
- Median HH income
- $33,907
- Composite
- 16.36/100
- National rank
- #9203
- State rank
- #177 of 270 in OK
Livability — Ada
- Score
- 70/100
- State rank
- #41
- US rank
- #7835
Category grades
Schools grade is shown separately in the Schools card above.
Census & demographics
- Census place
- Ada, OK
- County
- Pontotoc County · 31,943 people
- City population
- 31,943
- Metro
- Ada, OK
- Population (ZIP)
- 31,943
- Household income
- $62,357
- Rent vs Own
- Severe rent burden
- 774.0
Population outlook (Pontotoc County) Hauer SSP2
- Today (2025)
- 39,521 people
- By 2030
- 40,140 · +1.6%
- By 2040
- 41,242 · +4.4%
- By 2050
- 42,293 · +7.0%
- By 2075
- 44,678 · +13.0%
- By 2100
- 46,015 · +16.4%
Race, ethnicity, and origin ACS 2023
- Neighborhood character
- Diverse neighborhood (Simpson 0.61)
- Race & ethnicity
- White 62% Native American 19% Two or more races 13% Hispanic / Latino 7% Black 3% Asian 1%
- Hispanic origin (detail)
- Mexican 6%
- Common ancestry
- Slovak 3% Lithuanian 2% Italian 1%
- Foreign-born
- 2% · Canada
- Languages at home
- 96% English-only · Spanish 2%
Political lean MEDSL · Pontotoc
- 2024 margin
- Solid R (+46.6) · D 25.7% · R 72.3% · Other 2.1%
- 2008→2024 swing
- -9.9pp toward R · 2008: -36.7pp · 2024: -46.6pp
- All cycles
- 2024: R+46.6 2020: R+43.7 2016: R+45.8 2012: R+38.8 2008: R+36.7
Not yet ingested
- Civics
- —
Market trends
- HPI YoY
- ▼ -32.45%
- Current HPI
- 250.7685
- Rent YoY
- ▲ 4.83%
- Metro
- Ada, OK
- State GDP YoY
- ▲ 1.55%
- F500 in state
- 6
Industry mix (Fortune 500 HQ in OK)
| Industry | F500 HQs | Revenue |
|---|---|---|
| Energy | 3 | $48B |
|
||
Price history
+360.0% since first listed10 events — show timeline
- 2026-05-30 Pending — MLS Technology, Inc.
- 2026-05-29 Listed $115,000 MLS Technology, Inc.
- 2023-04-05 Sold (Public Records) $67,500 Public Records
- 2023-04-04 Sold (MLS) $67,500 MLS Technology, Inc.
- 2023-02-20 Pending — MLS Technology, Inc.
- 2023-02-19 Listed $69,900 MLS Technology, Inc.
- 2017-02-22 Sold (Public Records) $65,500 Public Records
- 2017-02-20 Sold (MLS) $65,500 MLS Technology, Inc.
- 2016-08-22 Listed $69,900 MLS Technology, Inc.
- 2002-02-28 Sold (Public Records) $25,000 Public Records
Property tax history
+14.1%/yrLatest (2025): $827 · -2.0% YoY. Source: county tax records.
Cash-flow waterfall
monthlySold comps — $/sqft
last 12 mo · ≤1 miLoading sold comps…