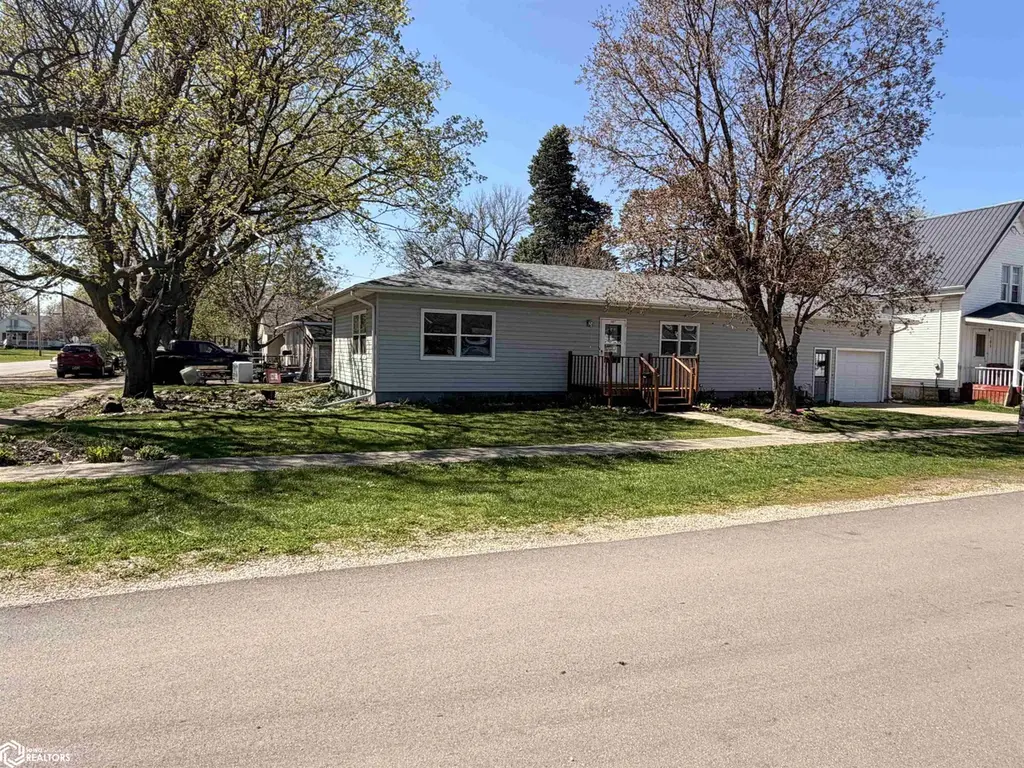
107 11th St S · Northwood, IA
Flood risk 1/10 · Minimal
- FEMA flood zone
- X (unshaded)
- Chance of flooding over 30 yrs
- 0.0%
- Est. flood insurance / yr
- $473 – $860
Fire risk 2/10 · Minimal
- Est. fire insurance / yr
- $902 – $1,676
Heat risk 2/10 · Minimal
- Hot days now (above 99°F)
- 7 days/yr
- Hot days in 30 yrs
- 15 days/yr
Wind risk 2/10 · Minimal
- Chance of severe wind over 30 yrs
- —
Air-quality risk 1/10 · Minimal
- Unhealthy air days now
- 0 days/yr
- Unhealthy air days in 30 yrs
- 0 days/yr
Risk factors via First Street. Map © Google.
Why this score? — see what drove the D grade
The composite is a weighted blend of 9 inputs, each scored 0–100. Each bar is that input's sub-score; the figure is the points it added to the 100-point composite (weight × sub-score).
- Cash flow +15.6/30.0
- Schools +5.8/10.0
- DSCR +4.8/10.0
- 1% rule +4.0/10.0
- Livability +4.0/5.0
- Rent growth +2.5/5.0
- Condition / age +2.5/5.0
- ARV discount +1.1/15.0
- Appreciation +0.7/10.0
$140,000
🖨 Deal sheet (PDF) 📄 Offer letter ✓ Due diligence
Listing remarks
Welcome home to this charming 3-bedroom, 2-bath ranch in Northwood, Iowa! NEW ROOF, AND NEW UPDATED ELECTICAL. Beautiful hardwood floors and the spacious living room that offers plenty of room to gather with family and friends. With 1,296 square feet on the main floor, this home has a comfortable layout that feels both cozy and functional. The full finished basement adds even more living space, perfect for a family room, rec area, home office, or hobbies. The extra-long single-stall garage provides great space for parking plus additional storage or workspace. Out back, you’ll love the deck—an ideal spot to enjoy your morning coffee or unwind at the end of the day. Additional upd
Key facts
- Deck
- New roof
- Hardwood floors
Tags
Property features AI
Exterior
- Parking: Attached concrete garage with 1 space
- Utilities: Public water; Public sewer
- Home design: Single-family residence; Residential property
- Construction: Vinyl siding
- Exterior features: 66 x 99 lot (0.15 acres)
Interior
- Bathrooms: One full bathroom; One three-quarter bathroom
- Heating & cooling: Hot water heating; Window air conditioning units
- Interior features: Basement
Neighborhood map
What this means for you Summary
Snapshot
- This is a 3-bed/2.5-bath single-family listed at $140k.
Deal economics
- At list price, monthly cash flow is $60 ($714/yr) — positive.
- The deal already cash-flows at list — no discount required.
- To meet the 1% rule (rent ≥ 1% of price), the offer needs to be $126k (9.7% below list).
- Recommended offer: $126k (9.7% below list) — sets the bar for 1% rule.
Location & tenants
- Location reads 79/100 on livability (#99 in IA, #2,022 nationally) — a middle-class / working-renter tenant base. Strengths: crime A+, cost of living A+, housing A+; Watch: amenities F, commute F.
- Northwood-Kensett Community School District (rural): math 63% / reading 74% proficiency, ranked #167 of 289 in IA (top 58%) — acceptable for families but not a draw, mixed tenant base, ~2y average lease.
- Market conditions: 19 active listings in the ZIP.
Forward outlook
- Local home prices are declining (-3.0%/yr); year-one equity from $968 of loan paydown is wiped out by about $4k of value loss. Plan a longer hold.
Negotiation context
- It's been on market 19 days — a 2% lower offer ($138k) is reasonable based on typical stale-listing flexibility.
- 3 sale attempts with the ask held roughly flat each time — persistent listings suggest the price (not the market) is what's stuck; bring a comps-based counter.
- Current owner paid $91k; list at $140k implies a 54% gain — meaningful room to come down on a strong offer.
Risks & watch-outs
- Watch-outs: built in 1950 — expect roof / HVAC / electrical / plumbing capex.
Questions for the listing agent
- Built in 1950 — when were the roof, HVAC, electrical panel, plumbing, and water heater last replaced?
- Is there a deadline driving the sale (1031 exchange, divorce, estate, relocation)? That informs how much negotiation room exists.
- Schools are B-rated — typically a magnet for longer-tenancy family renters. What's the average tenant stay here, and is there a school-zone premium baked into asking?
- The area grade is low — what's the realistic commute time and amenity access for the typical tenant pool here? Any planned neighborhood developments (good or bad) we should know about?
- What's the average days-on-market for RENTAL listings here right now (not sales)? A rising rental-DOM trend means longer vacancies and softer asking-rent achievability than the comps imply.
- What's the recent tenant-quality profile in this submarket — average credit score on applications, eviction rate, late-payment / NSF rate, and stable-employment percentage? A property-management company in the area should have these aggregated.
- How much new for-sale + rental construction is in the pipeline within 1–3 miles? Heavy new supply typically softens prices + rents 12–24 months out; constrained supply supports both.
Investment metrics
- 1% rule
- 0.90% ✗
- Cap rate
- 6.80%
- Cash-on-cash
- 1.82%
- DSCR
- 1.08
- GRM
- 9.2
CMA / ARV
- ARV (median comp)
- $122,662
- List price
- $140,000
- Delta
- 21.47%
- Verdict
- OVERPRICED
- Comps
- 20 within 1.0 mi
Show comp detail 12 sales within ~0.75 mi
| Address | Dist | Beds/Ba | Sqft | Sold | Price | $/sf | Match |
|---|---|---|---|---|---|---|---|
| 204 N 11th St St | 0.29mi | 3/1.8 | 1,896 (0%) | 6mo | $150,000 | $79 | 78 |
| 605 S 10th ST St | 0.26mi | 2/1.5 (-1) | 1,868 (-2%) | 3mo | $246,000 | $132 | 74 |
| 1310 2nd Ave Ave S | 0.18mi | 3/1.5 | 1,985 (+5%) | 10mo | $200,000 | $101 | 72 |
| 100 N 5th St St | 0.44mi | 4/2.0 (+1) | 1,960 (+3%) | 1mo | $88,000 | $45 | 66 |
| 204 N 9th ST St | 0.33mi | 3/1.0 | 1,772 (-6%) | 8mo | $124,000 | $70 | 61 |
| 801 10th St St S | 0.33mi | 3/2.5 | 2,160 (+14%) | 3mo | $180,000 | $83 | 59 |
| 204 15th ST St S | 0.28mi | 4/2.0 (+1) | 1,640 (-14%) | 0mo | $127,700 | $78 | 57 |
| 403 N 11th ST St | 0.44mi | 3/2.0 | 1,696 (-10%) | 8mo | $92,000 | $54 | 53 |
| 608 1st Ave Ave N | 0.33mi | 3/1.5 | 1,632 (-14%) | 8mo | $128,750 | $79 | 50 |
| 810 6th Ave Ave N | 0.60mi | 3/2.0 | 2,114 (+12%) | 2mo | $152,000 | $72 | 49 |
| 97 6th St St N | 0.34mi | 2/0.8 (-1) | 1,646 (-13%) | 5mo | $74,000 | $45 | 46 |
| 801 N 11th St St | 0.73mi | 3/1.5 | 2,100 (+11%) | 11mo | $163,000 | $78 | 34 |
Match score weights: distance 35% · size 25% · config 20% · recency 20%. Top-matched comps best support the ARV.
Projected returns pro-forma
-3.0% appreciation · 3.0% rent growth · sell at horizon
- IRR
- -13.4%
- Equity multiple
- 0.52×
- Total profit
- $-18,892
- Equity at exit
- $20,874
- IRR
- -4.5%
- Equity multiple
- 0.71×
- Total profit
- $-11,560
- Equity at exit
- $12,105
Cash invested: $39,200 (down + closing). Projections, not guarantees.
Landlord ↔ Tenant lean methodology
- Overall (STATE)
- 83 Strongly Landlord-Friendly
- State Iowa
- 83 Strongly Landlord-Friendly · R+6
- County
- — inherits STATE
- City
- — inherits STATE
ZIP-level market 50459
- Home prices YoY
- -3.8%
- Active inventory
- 19
- Price-to-rent
- 9.2×
Monthly cashflow live
- Estimated rent
- $1,265 medium interval (Pro) →
- Mortgage (P&I)
- −$734
- Tax from tax record
- −$147 /mo · $1,764/yr
- Insurance
- −$58
- HOA
- −$0
- Vacancy / Maint / Mgmt
- −$266
- Net cashflow
- $60
Break-even live
Sensitivity live
| Price | -10% $139 | -5% $99 | +0% $60 | +5% $20 | +10% $-20 |
|---|---|---|---|---|---|
| Rent | -10% $-40 | -5% $10 | +0% $60 | +5% $109 | +10% $159 |
| Rate | -1.0pp $130 | -0.5pp $95 | base $60 | +0.5pp $23 | +1.0pp $-14 |
UW: 25.0% down · 7.5% · 30yr · 1.5% tax · 5.0% vac · 8.0% maint · 8.0% mgmt
Financing live
Cash to close
- Down payment
- $35,000
- Closing costs
- $4,200
- Reserves months
- —
- Total cash needed
- —
Loan-product check · same deal, 3 products live
Conventional
25% down · 7.5% · 30yr
- Down + closing
- —
- Monthly P&I
- —
- Monthly cashflow
- —
- DSCR
- —
- Eligible?
- —
Personal DTI + credit; lowest rate.
DSCR
20% down · 8.5% · 30yr
- Down + closing
- —
- Monthly P&I
- —
- Monthly cashflow
- —
- DSCR
- —
- Eligible?
- —
No personal income docs; deal must DSCR.
Hard money
10% down · 12.0% · 12mo
- Down + closing
- —
- Monthly P&I
- —
- Monthly cashflow
- —
- DSCR
- —
- Eligible?
- —
Short-term bridge; refi at stabilization.
Listing history 23 events
-
2026-06-21days on market $140,000 Active 19 DOM
-
2026-06-18days on market $140,000 Active 17 DOM
-
2026-06-17price $140,000 Active 16 DOM
-
2026-06-17days on market $145,000 Active 16 DOM
-
2026-06-16days on market $145,000 Active 15 DOM
-
2026-06-15days on market $145,000 Active 14 DOM
-
2026-06-13days on market $145,000 Active 12 DOM
-
2026-06-12days on market $145,000 Active 11 DOM
-
2026-06-09days on market $145,000 Active 8 DOM
-
2026-06-08days on market $145,000 Active 7 DOM
-
2026-06-07days on market $145,000 Active 6 DOM
-
2026-06-07days on market $145,000 Active 5 DOM
-
2026-06-04days on market $145,000 Active 2 DOM
-
2026-06-01remarks 687-char remark
-
2026-06-01pricedays on market $145,000 Active 1 DOM
-
2026-06-01days on market $149,000 Active 38 DOM
-
2026-05-31days on market $149,000 Active 37 DOM
-
2026-05-31days on market $149,000 Active 36 DOM
-
2026-04-24$149,000 Active 905-char remark
-
2026-04-16soldstatus $91,000
-
2025-12-05price $170,000
-
2025-11-10$175,200 Active
-
2006-08-18soldstatus $90,000
ⓘ Source: listings_history table (triggers on properties + properties_extension) + one-shot
backfill from property_details.listing_events for pre-trigger history.
Tax reassessment forecast IA · Partial reset (capped growth)
- Current annual tax
- $1,764 · $147/mo
- Projected year-2 tax
- $1,981 · $165/mo
- Expected delta
- +$217/yr (+$18/mo · 12.3%)
ⓘ Screening estimate from a state-policy table — verify with the county assessor before closing.
Climate risk First Street
- Flood 1/10 Low FEMA zone X (unshaded) · 0% chance over 30 yrs
- Wildfire 2/10 Low
- Heat 2/10 Low 7 d/yr ≥99°F today · 15 d/yr by 30 yrs out
- Wind 2/10 Low
- Air quality 1/10 Low 0 unhealthy d/yr today · 0 by 30 yrs out
Nearby sold comps map
Loading sold comps map…
Walkable amenities ~0.75 mi
Loading nearby amenities…
Taxation est. · year 1
- Rental income
- $15,175
- − Mortgage interest
- −$7,842
- − Property taxes
- −$1,764
- − Insurance
- −$700
- − Repairs & maintenance
- −$1,214
- − Management
- −$1,214
- − Depreciation
- −$4,073
- Taxable loss
- −$1,632
- Est. tax savings @ 24.0%
- +$392
- After-tax cash flow
- $1,106/yr
For passive investors: Depreciation is non-cash, so a rental often shows a tax loss while cash-flowing — sheltering income. Rental losses are passive: they offset passive income freely, and up to $25,000/yr can offset ordinary (W-2) income if you actively participate and your MAGI is under $100k (phasing out to $0 by $150k); unused losses carry forward. On sale, claimed depreciation is recaptured at up to 25%, and gains may owe capital-gains tax (a 1031 exchange can defer both). Figures are a year-1 estimate at your 24.0% rate — not tax advice; consult a CPA.
Schools (NCES district)
- District
- Northwood-Kensett Community School District
- NCES district ID
- 1921210
- Math proficiency
- 63% ▼ -1.00%
- Reading proficiency
- 74% ▲ 3.00%
- Median HH income
- $46,859
- Composite
- 57.78/100
- National rank
- #1051
- State rank
- #167 of 289 in IA
Livability — Northwood
- Score
- 79/100
- State rank
- #99
- US rank
- #2022
Category grades
Schools grade is shown separately in the Schools card above.
Census & demographics
- Census place
- Northwood, IA
- Population (ZIP)
- 3,027
Population outlook (Worth County) Hauer SSP2
- Today (2025)
- 7,751 people
- By 2030
- 7,775 · +0.3%
- By 2040
- 7,722 · -0.4%
- By 2050
- 7,645 · -1.4%
- By 2075
- 7,785 · +0.4%
- By 2100
- 7,554 · -2.5%
Race, ethnicity, and origin ACS 2023
- Neighborhood character
- Predominantly White (94%)
- Race & ethnicity
- White 94% Hispanic / Latino 3% Two or more races 2% Asian 1%
- Common ancestry
- Portuguese 32% Iranian 2% Slovak 1%
- Foreign-born
- 1%
- Languages at home
- 96% English-only · German/W. Germanic 3% Other Asian/Pacific 1%
Political lean MEDSL · Worth
- 2024 margin
- Strong R (+28.2) · D 35.2% · R 63.5% · Other 1.3%
- 2008→2024 swing
- -50.6pp toward R · 2008: 22.4pp · 2024: -28.2pp
- All cycles
- 2024: R+28.2 2020: R+25.9 2016: R+21.8 2012: D+14.5 2008: D+22.4
Not yet ingested
- Civics
- —
Market trends
- HPI YoY
- ▼ -8.62%
- Current HPI
- 216.7341
- Rent YoY
- —
- Metro
- —
- State GDP YoY
- ▲ 2.48%
- F500 in state
- 4
Industry mix (Fortune 500 HQ in IA)
| Industry | F500 HQs | Revenue |
|---|---|---|
| Financial Services | 1 | $16B |
|
||
| Retail / Convenience | 1 | $15B |
|
||
Price history
+55.6% since first listed7 events — show timeline
- 2026-06-17 Price Changed $140,000 IAR
- 2026-06-01 Listed $145,000 IAR
- 2026-04-24 Listed $149,000 IAR
- 2026-04-16 Sold (Public Records) $91,000 Public Records
- 2025-12-05 Price Changed $170,000 IAR
- 2025-11-10 Listed $175,200 IAR
- 2006-08-18 Sold (Public Records) $90,000 Public Records
Property tax history
+3.7%/yrLatest (2025): $1,764 · +2.9% YoY. Source: county tax records.
Cash-flow waterfall
monthlySold comps — $/sqft
last 12 mo · ≤1 miLoading sold comps…