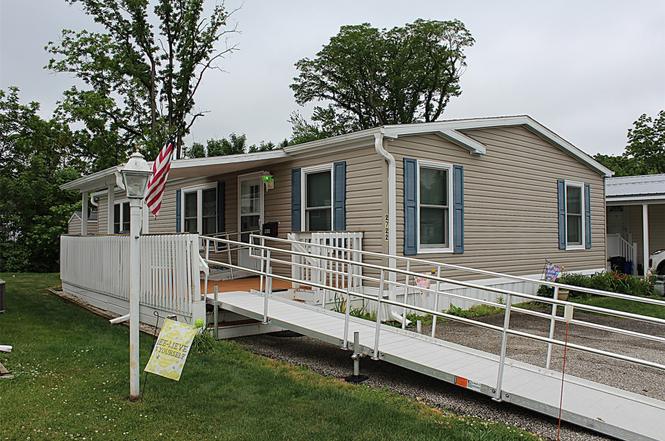
2722 W Park Ln · Millcreek, PA
Flood risk No data
- FEMA flood zone
- —
- Chance of flooding over 30 yrs
- —
- Est. flood insurance / yr
- —
Fire risk No data
- Est. fire insurance / yr
- —
Heat risk No data
- Hot days now (above threshold)
- —
- Hot days in 30 yrs
- —
Wind risk No data
- Chance of severe wind over 30 yrs
- —
Air-quality risk No data
- Unhealthy air days now
- —
- Unhealthy air days in 30 yrs
- —
Risk factors via First Street. Map © Google.
Why this score? — see what drove the B- grade
The composite is a weighted blend of 9 inputs, each scored 0–100. Each bar is that input's sub-score; the figure is the points it added to the 100-point composite (weight × sub-score).
- Cash flow +30.0/30.0
- 1% rule +10.0/10.0
- DSCR +10.0/10.0
- ARV discount +7.5/15.0
- Schools +4.8/10.0
- Rent growth +2.5/5.0
- Livability +2.5/5.0
- Condition / age +2.5/5.0
- Appreciation +0.0/10.0
$104,900
🖨 Deal sheet (PDF) 📄 Offer letter ✓ Due diligence
Listing remarks
Super well maintained one-owner 2011 doublewide manufactured home located in Millcreek's popular Meadow Green Acres Park. Conveniently located with numerous nearby shopping options. The home had the roof replaced in 2022, new Andersen windows in 2025, gutters in 2024, central air conditioning upgraded in 2020, water heater in 2023, kitchen countertops in 2024, freshly repainted in neutral colors in 2024, and newer carpeting. Lovely spacious covered outside deck for warm weather entertaining. Backyard storage shed. Lot backs up to wooded area for extra privacy. Two off-street parking spaces.
Key facts
- New gutters
- New water heater
- New andersen windows
Tags
Property features AI
Finance
- HOA & community: Homeowners association with a $417 monthly fee; Association fee includes snow removal and trash service
Exterior
- Parking: 2 parking spaces
- Security: Fire alarm
- Utilities: Public water; Public sewer
- Home design: Residential double-wide mobile home; Composition roof
- Construction: Vinyl siding
- Exterior features: Deck; Storage; Shed(s); Level lot; See remarks for additional lot details; Paved road
Interior
- Kitchen: Dishwasher; Gas oven; Gas range; Refrigerator
- Bedrooms: Total rooms: 8; No basement
- Flooring: Carpet
- Bathrooms: 2 full bathrooms
- Heating & cooling: Central air conditioning; Forced air heating
- Interior features: Dishwasher; Gas oven; Gas range; Refrigerator; Dryer; Washer; Carpet flooring; Fire alarm
- Laundry & utility: Washer and dryer included
Neighborhood map
What this means for you Summary
Snapshot
- This is a 3-bed/2.0-bath manufactured listed at $105k.
Deal economics
- At list price, monthly cash flow is $397 ($5k/yr) — positive.
- The deal already cash-flows at list — no discount required.
- Meets the 1% rule at list price ($2k rent vs $105k).
Location & tenants
- Location reads: area grade B — affects rentability + tenant quality, not the cash-flow math above.
- Millcreek Township SD (suburban): math 46% / reading 65% proficiency, ranked #105 of 539 in PA (top 20%) — acceptable for families but not a draw, mixed tenant base, ~2y average lease.
- Zoned schools: Asbury El Sch (math 61% / reading 74%, grade B+, #192 of 1,518 statewide, top 13%, 539 students, 34% FRL); Westlake Ms (math 29% / reading 60%, grade D, #194 of 512 statewide, top 39%, 470 students, 59% FRL); Mcdowell Hs (math 76% / reading 50%, grade B-, #72 of 437 statewide, top 16%, 2,205 students, 40% FRL) — zoned schools average 45% FRL vs 29% district-wide (15 pts higher); higher-poverty schools than district average — tighter screening recommended.
- Market conditions: 99 active listings in the ZIP; 1 comparable units currently listed for rent nearby; solid renter incomes; 364 units permitted in Erie County in 2024 (188 in 5+ unit buildings).
Forward outlook
- Local home prices are declining (-3.0%/yr); year-one equity from $725 of loan paydown is wiped out by about $3k of value loss. Plan a longer hold.
- Erie County population projected at -14% by 2050 — secular population decline; favor cash flow + early exit over multi-decade hold.
- At projected returns (-3.0% appreciation + 3.0% rent growth), your $29k cash investment doubles in ~8 years — after that, you're playing with house money.
Negotiation context
- Only 3 days on market — expect competitive offers; lowballing is unlikely to land.
Risks & watch-outs
- Watch-outs: HOA is 21% of rent.
Questions for the listing agent
- What does the HOA fee cover, when was the last increase, and are there any pending special assessments or reserve-fund shortfalls?
- Is there a deadline driving the sale (1031 exchange, divorce, estate, relocation)? That informs how much negotiation room exists.
- What's the average days-on-market for RENTAL listings here right now (not sales)? A rising rental-DOM trend means longer vacancies and softer asking-rent achievability than the comps imply.
- What's the recent tenant-quality profile in this submarket — average credit score on applications, eviction rate, late-payment / NSF rate, and stable-employment percentage? A property-management company in the area should have these aggregated.
- How much new for-sale + rental construction is in the pipeline within 1–3 miles? Heavy new supply typically softens prices + rents 12–24 months out; constrained supply supports both.
Investment metrics
- 1% rule
- 1.86% ✓
- Cap rate
- 10.83%
- Cash-on-cash
- 16.21%
- DSCR
- 1.72
- GRM
- 4.5
CMA / ARV
No comps found within radius.
Projected returns pro-forma
-3.0% appreciation · 3.0% rent growth · sell at horizon
- IRR
- 7.4%
- Equity multiple
- 1.29×
- Total profit
- $8,562
- Equity at exit
- $15,641
- IRR
- 16.9%
- Equity multiple
- 2.40×
- Total profit
- $41,166
- Equity at exit
- $9,070
Cash invested: $29,372 (down + closing). Projections, not guarantees.
Landlord ↔ Tenant lean methodology
- Overall (STATE)
- 62 Landlord-Friendly
- State Pennsylvania
- 62 Landlord-Friendly · EVEN
- County
- — inherits STATE
- City
- — inherits STATE
ZIP-level market 16506
- Active inventory
- 99
- Price-to-rent
- 4.5×
Monthly cashflow live
- Estimated rent
- $1,951 medium interval (Pro) →
- Mortgage (P&I)
- −$550
- Tax from tax record
- −$133 /mo · $1,601/yr
- Insurance
- −$44
- HOA
- −$417
- Vacancy / Maint / Mgmt
- −$410
- Net cashflow
- $397
Break-even live
Sensitivity live
| Price | -10% $456 | -5% $427 | +0% $397 | +5% $367 | +10% $337 |
|---|---|---|---|---|---|
| Rent | -10% $243 | -5% $320 | +0% $397 | +5% $474 | +10% $551 |
| Rate | -1.0pp $450 | -0.5pp $423 | base $397 | +0.5pp $370 | +1.0pp $342 |
UW: 25.0% down · 7.5% · 30yr · 1.5% tax · 5.0% vac · 8.0% maint · 8.0% mgmt
Financing live
Cash to close
- Down payment
- $26,225
- Closing costs
- $3,147
- Reserves months
- —
- Total cash needed
- —
Loan-product check · same deal, 3 products live
Conventional
25% down · 7.5% · 30yr
- Down + closing
- —
- Monthly P&I
- —
- Monthly cashflow
- —
- DSCR
- —
- Eligible?
- —
Personal DTI + credit; lowest rate.
DSCR
20% down · 8.5% · 30yr
- Down + closing
- —
- Monthly P&I
- —
- Monthly cashflow
- —
- DSCR
- —
- Eligible?
- —
No personal income docs; deal must DSCR.
Hard money
10% down · 12.0% · 12mo
- Down + closing
- —
- Monthly P&I
- —
- Monthly cashflow
- —
- DSCR
- —
- Eligible?
- —
Short-term bridge; refi at stabilization.
Rent comps 1 comps
| Address | Beds | Baths | Sqft | Rent | $/sqft | DOM | Units | Dist |
|---|---|---|---|---|---|---|---|---|
| 2412 Powell Ave Erie, PA | 3.0 | 2.0 | 1500 | $1,550 | $1.03 | 45d | 1 | 1.20mi |
HOA detail
- Monthly dues
- $417 · $5,004/yr
- Likely covers
- water
Listing history 3 events
-
2026-06-21days on market $104,900 Active 3 DOM
-
2026-06-19remarks 597-char remark
-
2026-06-19$104,900 Active 1 DOM
ⓘ Source: listings_history table (triggers on properties + properties_extension) + one-shot
backfill from property_details.listing_events for pre-trigger history.
Tax reassessment forecast PA · Partial reset (capped growth)
- Current annual tax
- $1,601 · $133/mo
- Projected year-2 tax
- $1,629 · $136/mo
- Expected delta
- +$28/yr (+$2/mo · 1.8%)
ⓘ Screening estimate from a state-policy table — verify with the county assessor before closing.
Nearby sold comps map
Loading sold comps map…
Walkable amenities ~0.75 mi
Loading nearby amenities…
Taxation est. · year 1
- Rental income
- $23,408
- − Mortgage interest
- −$5,876
- − Property taxes
- −$1,601
- − Insurance
- −$524
- − Repairs & maintenance
- −$1,873
- − Management
- −$1,873
- − HOA
- −$5,004
- − Depreciation
- −$3,052
- Taxable income
- $3,606
- Est. tax owed @ 24.0%
- −$865
- After-tax cash flow
- $3,896/yr
For passive investors: Depreciation is non-cash, so a rental often shows a tax loss while cash-flowing — sheltering income. Rental losses are passive: they offset passive income freely, and up to $25,000/yr can offset ordinary (W-2) income if you actively participate and your MAGI is under $100k (phasing out to $0 by $150k); unused losses carry forward. On sale, claimed depreciation is recaptured at up to 25%, and gains may owe capital-gains tax (a 1031 exchange can defer both). Figures are a year-1 estimate at your 24.0% rate — not tax advice; consult a CPA.
Schools (NCES district)
- District
- Millcreek Township SD
- NCES district ID
- 4215330
- Math proficiency
- 46% ▼ -13.00%
- Reading proficiency
- 65% ▼ -9.00%
- Median HH income
- $55,734
- Composite
- 47.82/100
- National rank
- #2224
- State rank
- #105 of 539 in PA
Livability — Millcreek
No livability data for this city. (Only ~50 U.S. cities are tracked.)
Census & demographics
- County
- Erie County · 92,215 people
- Metro
- Erie, PA
- Population (ZIP)
- 24,070
- Household income
- $81,060
- Rent vs Own
- Severe rent burden
- 894.0
Population outlook (Erie County) Hauer SSP2
- Today (2025)
- 272,159 people
- By 2030
- 266,299 · -2.2%
- By 2040
- 250,987 · -7.8%
- By 2050
- 234,925 · -13.7%
- By 2075
- 199,164 · -26.8%
- By 2100
- 162,985 · -40.1%
Race, ethnicity, and origin ACS 2023
- Neighborhood character
- Predominantly White (88%)
- Race & ethnicity
- White 88% Two or more races 5% Asian 4% Black 2% Hispanic / Latino 2%
- Common ancestry
- Romanian 11% Italian 2% Lithuanian 1%
- Foreign-born
- 5% · Canada, China
- Languages at home
- 93% English-only · Other Indo-European 2% Spanish 1% Russian/Polish/Slavic 1%
Political lean MEDSL · Erie
- 2024 margin
- Toss-up / Even · D 49.0% · R 50.0%
- 2008→2024 swing
- -20.9pp toward R · 2008: 19.9pp · 2024: -1.0pp
- All cycles
- 2024: R+1.0 2020: D+1.0 2016: R+2.0 2012: D+16.9 2008: D+19.9
Not yet ingested
- Civics
- —
Market trends
- HPI YoY
- ▼ -152.21%
- Current HPI
- 228.7506
- Rent YoY
- —
- Metro
- Erie, PA
- State GDP YoY
- ▲ 1.68%
- F500 in state
- 34
Industry mix (Fortune 500 HQ in PA)
| Industry | F500 HQs | Revenue |
|---|---|---|
| Healthcare | 2 | $309B |
|
||
| Insurance | 2 | $27B |
|
||
| Telecommunications / Media | 1 | $124B |
|
||
| Industrial Distribution | 1 | $22B |
|
||
| Financial Services | 1 | $20B |
|
||
| Chemicals / Materials | 1 | $18B |
|
||
Price history
1 event — show timeline
- 2026-06-18 Listed $104,900 GEBOR
Property tax history
+2.5%/yrLatest (2026): $1,601 · +3.6% YoY. Source: county tax records.
Cash-flow waterfall
monthlySold comps — $/sqft
last 12 mo · ≤1 miLoading sold comps…