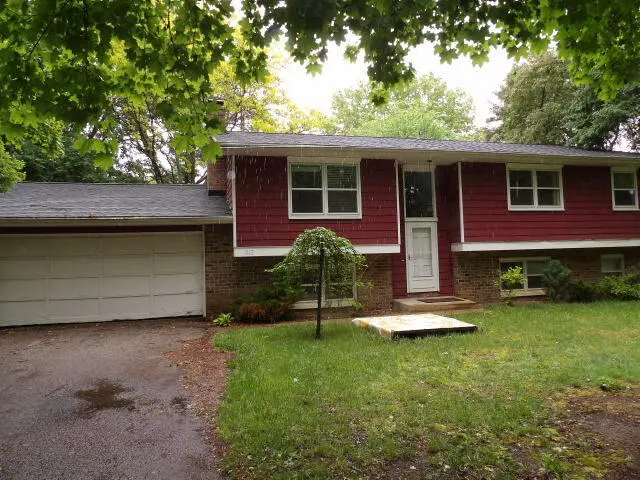
243 Devon Rd · Battle Creek, MI
Flood risk 1/10 · Minimal
- FEMA flood zone
- X (unshaded)
- Chance of flooding over 30 yrs
- 0.0%
- Est. flood insurance / yr
- $507 – $1,088
Fire risk 1/10 · Minimal
- Est. fire insurance / yr
- $784 – $1,456
Heat risk 2/10 · Minimal
- Hot days now (above 98°F)
- 7 days/yr
- Hot days in 30 yrs
- 16 days/yr
Wind risk 2/10 · Minimal
- Chance of severe wind over 30 yrs
- —
Air-quality risk 3/10 · Minor
- Unhealthy air days now
- 2 days/yr
- Unhealthy air days in 30 yrs
- 3 days/yr
Risk factors via First Street. Map © Google.
Why this score? — see what drove the D grade
The composite is a weighted blend of 9 inputs, each scored 0–100. Each bar is that input's sub-score; the figure is the points it added to the 100-point composite (weight × sub-score).
- ARV discount +15.0/15.0
- Cash flow +7.2/30.0
- Rent growth +5.0/5.0
- Livability +3.7/5.0
- 1% rule +3.1/10.0
- Schools +3.0/10.0
- Condition / age +2.5/5.0
- DSCR +1.3/10.0
- Appreciation +0.0/10.0
$199,900
🖨 Deal sheet 📄 Offer letter ✓ Due diligence
Listing remarks MLS
This 5 Bedroom home with 2 full bathrooms has a lot of potential. Bi level home has 3 bedrooms with 2 full bathrooms on the upper level including dining room and kitchen and living room, lower level has 2 bedrooms with a large rec room with fireplace and 2 car attached garage and storage shed. All bids be made at www. Auction. comHowever, the seller requires that all non-cash -offers must be pre-qualified by . NewRez Home Loan Division prior to offer acceptance. For the free pre-qualification Call 888-673-5521
Key facts
- 0.41 acre lot
- 2 garage spots
- Built 1978
Property features AI
Exterior
- Parking: Attached 2-car garage; Attached parking
- Utilities: Well water; Natural gas connected
- Home design: Single-family residence; Residential property
- Construction: Built in 1978; Aluminum siding and brick exterior; Composition roof
- Exterior features: Paved road access; Lot approximately 0.41 acres
Interior
- Kitchen: Eat-in kitchen; Pantry
- Bedrooms: Primary bedroom (11 x 15); Bedroom 2 (12 x 12); Bedroom 3 (10 x 12); Bedroom 4 (13 x 11); Bedroom 5 (11 x 10)
- Bathrooms: 2 full bathrooms; Primary bathroom (8 x 8)
- Heating & cooling: Forced air heating; Has heating; Has cooling
- Interior features: Garage door opener; Eat-in kitchen; Pantry; Wood-burning fireplace; Storm windows and screens; Full basement; Six total rooms
- Laundry & utility: Dedicated laundry room (10 x 10)
Neighborhood map
What this means for you Summary
Snapshot
- This is a 3-bed/2.0-bath single-family listed at $200k.
Deal economics
- At list price, monthly cash flow is $-279 ($-3k/yr) — negative.
- To cash-flow at today's rent, offer at most $151k (24.6% below list).
- To meet the 1% rule (rent ≥ 1% of price), the offer needs to be $162k (19.0% below list).
- Recommended offer: $151k (24.6% below list) — sets the bar for cash-flow.
Location & tenants
- Location reads 73/100 on livability (#198 in MI) — a middle-class / working-renter tenant base. Strengths: cost of living A+, housing A+, health & safety A+; Watch: schools C-, amenities C-, crime F.
- Lakeview School District (Calhoun) (urban): math 28% / reading 40% proficiency, ranked #291 of 540 in MI (top 54%) — families likely to look elsewhere, expect single-tenant / working-renter base with shorter leases.
- Market conditions: Rents rising fast (+11.1%/yr); 165 active listings in the ZIP; 1 comparable units currently listed for rent nearby; 132 units permitted in Calhoun County in 2024 (0 in 5+ unit buildings).
Forward outlook
- Local home prices are declining (-3.0%/yr); year-one equity from $1k of loan paydown is wiped out by about $6k of value loss. Plan a longer hold.
- Calhoun County population projected at -16% by 2050 — secular population decline; favor cash flow + early exit over multi-decade hold.
Negotiation context
- It's been on market 24 days — a 2% lower offer ($197k) is reasonable based on typical stale-listing flexibility.
- 9 sale attempts since 23y ago with the ask held roughly flat each time — persistent listings suggest the price (not the market) is what's stuck; bring a comps-based counter.
- Current owner paid $121k; list at $200k implies a 65% gain — meaningful room to come down on a strong offer.
Risks & watch-outs
- Watch-outs: property tax is 2.6% of price.
Questions for the listing agent
- What do current leases actually rent for vs. the listed asking? Can we see a recent rent roll and the last 12 months of T-12 income?
- Built in 1978 — when were the roof, HVAC, electrical panel, plumbing, and water heater last replaced?
- Property tax is high relative to price — has the assessment been appealed recently, and will the sale trigger a re-assessment?
- Is there a deadline driving the sale (1031 exchange, divorce, estate, relocation)? That informs how much negotiation room exists.
- Crime grade is F in this area — have there been break-ins, vandalism, or insurance claims at this property in the last 3 years? What carrier currently insures it and at what premium?
- The area grade is low — what's the realistic commute time and amenity access for the typical tenant pool here? Any planned neighborhood developments (good or bad) we should know about?
- What's the average days-on-market for RENTAL listings here right now (not sales)? A rising rental-DOM trend means longer vacancies and softer asking-rent achievability than the comps imply.
- What's the recent tenant-quality profile in this submarket — average credit score on applications, eviction rate, late-payment / NSF rate, and stable-employment percentage? A property-management company in the area should have these aggregated.
- How much new for-sale + rental construction is in the pipeline within 1–3 miles? Heavy new supply typically softens prices + rents 12–24 months out; constrained supply supports both.
Investment metrics
- 1% rule
- 0.81% ✗
- Cap rate
- 4.62%
- Cash-on-cash
- -5.97%
- DSCR
- 0.73
- GRM
- 10.3
CMA / ARV
- ARV (on-the-fly)
- $284,570
- Comps found
- 12
Show comp detail 12 sales within ~0.75 mi
| Address | Dist | Beds/Ba | Sqft | Sold | Price | $/sf | Match |
|---|---|---|---|---|---|---|---|
| 219 W Hamilton Ln | 0.53mi | 3/2.0 | 1,956 (-2%) | 7mo | $279,000 | $143 | 67 |
| 172 W Hamilton Ln | 0.53mi | 3/2.0 | 2,099 (+6%) | 0mo | $273,000 | $130 | 66 |
| 396 South Hills Dr | 0.25mi | 4/2.5 (+1) | 2,128 (+7%) | 6mo | $305,000 | $143 | 65 |
| 215 Beckwith Dr | 0.43mi | 4/2.0 (+1) | 1,878 (-6%) | 7mo | $290,000 | $154 | 60 |
| 127 Morningside Dr | 0.65mi | 3/2.0 | 1,900 (-4%) | 6mo | $235,000 | $124 | 57 |
| 54 Shortridge Rd | 0.62mi | 3/1.5 | 2,131 (+7%) | 3mo | $260,000 | $122 | 55 |
| 509 E Hamilton Ln | 0.68mi | 4/3.0 (+1) | 2,020 (+2%) | 6mo | $305,000 | $151 | 52 |
| 604 Country Club Blvd | 0.54mi | 3/2.0 | 1,728 (-13%) | 4mo | $273,000 | $158 | 50 |
| 68 Birch Hill Dr | 0.60mi | 3/2.0 | 2,195 (+10%) | 7mo | $315,000 | $144 | 49 |
| 620 E Minges Rd | 0.51mi | 4/2.5 (+1) | 2,212 (+11%) | 2mo | $303,000 | $137 | 48 |
| 66 Wealthy Ave | 0.65mi | 3/1.0 | 1,794 (-10%) | 3mo | $220,000 | $123 | 47 |
| 226 Morningside Dr | 0.67mi | 4/1.5 (+1) | 1,776 (-11%) | 4mo | $240,000 | $135 | 40 |
Match score weights: distance 35% · size 25% · config 20% · recency 20%. Top-matched comps best support the ARV.
Projected returns pro-forma
-3.0% appreciation · 8.0% rent growth · sell at horizon
- IRR
- -20.3%
- Equity multiple
- 0.26×
- Total profit
- $-41,451
- Equity at exit
- $29,806
- IRR
- -4.3%
- Equity multiple
- 0.65×
- Total profit
- $-19,463
- Equity at exit
- $17,284
Cash invested: $55,972 (down + closing). Projections, not guarantees.
Landlord ↔ Tenant lean methodology
- Overall (STATE)
- 62 Landlord-Friendly
- State Michigan
- 62 Landlord-Friendly · EVEN
- County
- — inherits STATE
- City
- — inherits STATE
ZIP-level market 49015
- Rents YoY
- 11.1%
- Active inventory
- 165
- Price-to-rent
- 10.3×
Monthly cashflow live
- Estimated rent
- $1,619 medium interval (Pro) →
- Mortgage (P&I)
- −$1,048
- Tax from tax record
- −$426 /mo · $5,115/yr
- Insurance
- −$83
- HOA
- −$0
- Vacancy / Maint / Mgmt
- −$340
- Net cashflow
- $-279
Break-even live
UW: 25.0% down · 7.5% · 30yr · 1.5% tax · 5.0% vac · 8.0% maint · 8.0% mgmt
Financing live
Cash to close
- Down payment
- $49,975
- Closing costs
- $5,997
- Reserves months
- —
- Total cash needed
- —
Loan-product check · same deal, 3 products live
Conventional
25% down · 7.5% · 30yr
- Down + closing
- —
- Monthly P&I
- —
- Monthly cashflow
- —
- DSCR
- —
- Eligible?
- —
Personal DTI + credit; lowest rate.
DSCR
20% down · 8.5% · 30yr
- Down + closing
- —
- Monthly P&I
- —
- Monthly cashflow
- —
- DSCR
- —
- Eligible?
- —
No personal income docs; deal must DSCR.
Hard money
10% down · 12.0% · 12mo
- Down + closing
- —
- Monthly P&I
- —
- Monthly cashflow
- —
- DSCR
- —
- Eligible?
- —
Short-term bridge; refi at stabilization.
Rent comps 1 comps
| Address | Beds | Baths | Sqft | Rent | $/sqft | DOM | Units | Dist |
|---|---|---|---|---|---|---|---|---|
| 10 Rambling Ln Battle Creek, MI | 1.0–2.0 | 1.0–2.5 | 988 | $1,609 | $1.63 | 13d | 33 | 1.42mi |
Listing history 31 events
-
2026-06-19days on market $199,900 Active 24 DOM
-
2026-06-18days on market $199,900 Active 23 DOM
-
2026-06-17days on market $199,900 Active 22 DOM
-
2026-06-16days on market $199,900 Active 21 DOM
-
2026-06-15days on market $199,900 Active 20 DOM
-
2026-06-14days on market $199,900 Active 18 DOM
-
2026-06-13days on market $199,900 Active 17 DOM
-
2026-06-09days on market $199,900 Active 16 DOM
-
2026-06-08days on market $199,900 Active 15 DOM
-
2026-06-07days on market $199,900 Active 14 DOM
-
2026-06-05days on market $199,900 Active 11 DOM
-
2026-06-02days on market $199,900 Active 9 DOM
-
2026-06-01days on market $199,900 Active 8 DOM
-
2026-05-31days on market $199,900 Active 7 DOM
-
2026-05-30days on market $199,900 Active 6 DOM
-
2026-05-24$199,900 Active 518-char remark
Show marketing remark (515 chars)
This 5 Bedroom home with 2 full bathrooms has a lot of potential. Bi level home has 3 bedrooms with 2 full bathrooms on the upper level including dining room and kitchen and living room, lower level has 2 bedrooms with a large rec room with fireplace and 2 car attached garage and storage shed. All bids be made at www. Auction. comHowever, the seller requires that all non-cash -offers must be pre-qualified by . NewRez Home Loan Division prior to offer acceptance. For the free pre-qualification Call 888-673-5521
-
2026-05-24$199,900 Active 515-char remark
Show marketing remark (515 chars)
This 5 Bedroom home with 2 full bathrooms has a lot of potential. Bi level home has 3 bedrooms with 2 full bathrooms on the upper level including dining room and kitchen and living room, lower level has 2 bedrooms with a large rec room with fireplace and 2 car attached garage and storage shed. All bids be made at www. Auction. comHowever, the seller requires that all non-cash -offers must be pre-qualified by . NewRez Home Loan Division prior to offer acceptance. For the free pre-qualification Call 888-673-5521
-
2026-05-24$199,900 Active
Show marketing remark (515 chars)
This 5 Bedroom home with 2 full bathrooms has a lot of potential. Bi level home has 3 bedrooms with 2 full bathrooms on the upper level including dining room and kitchen and living room, lower level has 2 bedrooms with a large rec room with fireplace and 2 car attached garage and storage shed. All bids be made at www. Auction. comHowever, the seller requires that all non-cash -offers must be pre-qualified by . NewRez Home Loan Division prior to offer acceptance. For the free pre-qualification Call 888-673-5521
-
2014-09-26historical
-
2010-02-12soldstatus $121,000
-
2009-07-30soldstatus $105,400
-
2009-07-30soldstatus $105,400
-
2008-12-04$109,800
-
2008-12-04$109,800
-
2008-09-17historical
-
2008-03-17$161,900
-
2008-03-17$161,900
-
2003-08-12soldstatus $158,300
-
2003-08-12soldstatus $158,300
-
2003-05-06$159,900
-
2003-05-06$159,900
ⓘ Source: listings_history table (triggers on properties + properties_extension) + one-shot
backfill from property_details.listing_events for pre-trigger history.
Tax reassessment forecast MI · Partial reset (capped growth)
- Current annual tax
- $5,115 · $426/mo
- Projected year-2 tax
- $5,115 · $426/mo
- Expected delta
- $0/yr ($0/mo · 0.0%)
ⓘ Screening estimate from a state-policy table — verify with the county assessor before closing.
Climate risk First Street
- Flood 1/10 Low FEMA zone X (unshaded) · 0% chance over 30 yrs
- Wildfire 1/10 Low
- Heat 2/10 Low 7 d/yr ≥98°F today · 16 d/yr by 30 yrs out
- Wind 2/10 Low
- Air quality 3/10 Moderate 2 unhealthy d/yr today · 3 by 30 yrs out
Nearby sold comps map
Loading sold comps map…
Walkable amenities ~0.75 mi
Loading nearby amenities…
Taxation est. · year 1
- Rental income
- $19,430
- − Mortgage interest
- −$11,198
- − Property taxes
- −$5,115
- − Insurance
- −$1,000
- − Repairs & maintenance
- −$1,554
- − Management
- −$1,554
- − Depreciation
- −$5,815
- Taxable loss
- −$6,806
- Est. tax savings @ 24.0%
- +$1,633
- After-tax cash flow
- $-1,711/yr
For passive investors: Depreciation is non-cash, so a rental often shows a tax loss while cash-flowing — sheltering income. Rental losses are passive: they offset passive income freely, and up to $25,000/yr can offset ordinary (W-2) income if you actively participate and your MAGI is under $100k (phasing out to $0 by $150k); unused losses carry forward. On sale, claimed depreciation is recaptured at up to 25%, and gains may owe capital-gains tax (a 1031 exchange can defer both). Figures are a year-1 estimate at your 24.0% rate — not tax advice; consult a CPA.
Schools (NCES district)
- District
- Lakeview School District (Calhoun)
- NCES district ID
- 2620850
- Math proficiency
- 28% ▼ -10.00%
- Reading proficiency
- 40% ▼ -6.00%
- Median HH income
- $52,353
- Composite
- 29.7/100
- National rank
- #6455
- State rank
- #291 of 540 in MI
Livability — Battle Creek
- Score
- 73/100
- State rank
- #198
- US rank
- #5031
Category grades
Schools grade is shown separately in the Schools card above.
Census & demographics
- Census place
- Battle Creek, MI
- County
- Calhoun County · 91,590 people
- City population
- 91,590
- Metro
- Battle Creek, MI
- Population (ZIP)
- 27,765
- Household income
- $68,821
- Rent vs Own
- Severe rent burden
- 755.0
Population outlook (Calhoun County) Hauer SSP2
- Today (2025)
- 130,157 people
- By 2030
- 126,691 · -2.7%
- By 2040
- 118,517 · -8.9%
- By 2050
- 109,855 · -15.6%
- By 2075
- 90,486 · -30.5%
- By 2100
- 70,766 · -45.6%
Race, ethnicity, and origin ACS 2023
- Neighborhood character
- Predominantly White (71%)
- Race & ethnicity
- White 71% Two or more races 11% Hispanic / Latino 7% Asian 7% Black 7%
- Hispanic origin (detail)
- Mexican 5%
- Common ancestry
- Iranian 4% Lithuanian 4% Romanian 3%
- Foreign-born
- 10% · Philippines, Canada
- Languages at home
- 86% English-only · Other Asian/Pacific 7% Spanish 4% Other Indo-European 1%
Political lean MEDSL · Calhoun
- 2024 margin
- R (+14.1) · D 42.3% · R 56.4% · Other 1.3%
- 2008→2024 swing
- -23.4pp toward R · 2008: 9.4pp · 2024: -14.1pp
- All cycles
- 2024: R+14.1 2020: R+11.1 2016: R+12.5 2012: D+1.6 2008: D+9.4
Not yet ingested
- Civics
- —
Market trends
- HPI YoY
- ▼ -116.20%
- Current HPI
- 206.7754
- Rent YoY
- ▲ 11.13%
- Metro
- Battle Creek, MI
- State GDP YoY
- ▲ 1.37%
- F500 in state
- 28
Industry mix (Fortune 500 HQ in MI)
| Industry | F500 HQs | Revenue |
|---|---|---|
| Automotive Parts | 3 | $48B |
|
||
| Automotive | 2 | $372B |
|
||
| Chemicals | 1 | $45B |
|
||
| Automotive Retail | 1 | $29B |
|
||
| Healthcare / Medical Devices | 1 | $23B |
|
||
| Automotive Technology | 1 | $20B |
|
||
Price history
+25.0% since first listed16 events — show timeline
- 2026-05-24 Listed $199,900 REALCOMP
- 2026-05-24 Listed $199,900 SW Michigan MLS
- 2026-05-24 Listed $199,900 MiRealSource-MiMLS
- 2014-09-26 Listing Removed — SW Michigan MLS
- 2010-02-12 Sold (Public Records) $121,000 Public Records
- 2009-07-30 Sold (MLS) $105,400 REALCOMP
- 2009-07-30 Sold (MLS) $105,400 SW Michigan MLS
- 2008-12-04 Listed $109,800 REALCOMP
- 2008-12-04 Listed $109,800 SW Michigan MLS
- 2008-09-17 Listing Removed — REALCOMP
- 2008-03-17 Listed $161,900 REALCOMP
- 2008-03-17 Listed $161,900 SW Michigan MLS
- 2003-08-12 Sold (MLS) $158,300 REALCOMP
- 2003-08-12 Sold (MLS) $158,300 SW Michigan MLS
- 2003-05-06 Listed $159,900 REALCOMP
- 2003-05-06 Listed $159,900 SW Michigan MLS
Property tax history
-7.2%/yrLatest (2025): $5,115 · -38.1% YoY. Source: county tax records.
Cash-flow waterfall
monthlySold comps — $/sqft
last 12 mo · ≤1 miLoading sold comps…