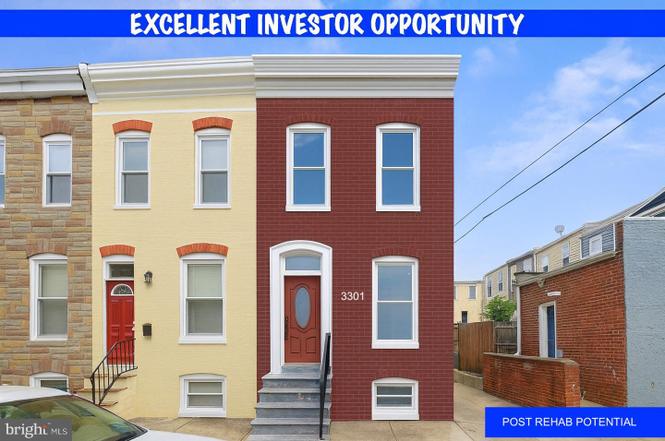
3301 Noble St · Baltimore, MD
Flood risk 1/10 · Minimal
- FEMA flood zone
- X (unshaded)
- Chance of flooding over 30 yrs
- 0.0%
- Est. flood insurance / yr
- $473 – $860
Fire risk 1/10 · Minimal
- Est. fire insurance / yr
- $755 – $1,403
Heat risk 8/10 · Major
- Hot days now (above 103°F)
- 7 days/yr
- Hot days in 30 yrs
- 15 days/yr
Wind risk 6/10 · Moderate
- Chance of severe wind over 30 yrs
- 27.0%
Air-quality risk 4/10 · Minor
- Unhealthy air days now
- 6 days/yr
- Unhealthy air days in 30 yrs
- 7 days/yr
Risk factors via First Street. Map © Google.
Why this score? — see what drove the B- grade
The composite is a weighted blend of 9 inputs, each scored 0–100. Each bar is that input's sub-score; the figure is the points it added to the 100-point composite (weight × sub-score).
- Cash flow +30.0/30.0
- 1% rule +10.0/10.0
- DSCR +10.0/10.0
- ARV discount +7.5/15.0
- Livability +3.8/5.0
- Rent growth +2.8/5.0
- Condition / age +2.5/5.0
- Schools +1.0/10.0
- Appreciation +0.0/10.0
$65,000
🖨 Deal sheet (PDF) 📄 Offer letter ✓ Due diligence
Listing remarks MLS
TOTALLY RENOVATED 3B 1FB END OF UNIT TOWNHOME - SPACIOUS KITCHEN WITH NEW STAINLESS APPLIANCES - 2ND LEVEL WITH 3/ BEDROOMS HARDWOOD FLOOR - FINISHED BASEMENT WITH ANOTHER BEDROOM-REAR FENCE PATIO THAT COULD BE CONVERTED IN A PARKING PAD.
Key facts
- End-unit rowhome
- Complete renovation
- Corner footprint
Tags
Property features AI
Finance
- Other: Below-grade unfinished area reported as 480; Above-grade finished area reported as 960; Total below grade area reported as 480; Property located within Baltimore City limits
Exterior
- Parking: On-street parking
- Utilities: Public water; Public sewer
- Home design: End of Row/Townhouse; Fee simple ownership; Building winterized
- Construction: Brick construction; Block foundation; Built year reported by assessor
- Exterior features: End of row townhouse; Unfinished basement; Above-grade and below-grade structures
Interior
- Kitchen: Kitchen included (open to dining area)
- Bedrooms: Three bedrooms on the upper level (1st upper level)
- Bathrooms: One full bathroom
- Heating & cooling: Natural gas heating (listed as Other heating type); Natural gas hot water
- Interior features: Open floor plan; Combination living and dining area; Combination kitchen and dining area
Neighborhood map
What this means for you Summary
Snapshot
- This is a 3-bed/1.0-bath townhouse listed at $65k.
Deal economics
- At list price, monthly cash flow is $1k ($12k/yr) — positive.
- The deal already cash-flows at list — no discount required.
- Meets the 1% rule at list price ($2k rent vs $65k).
- Recommended offer: $61k (6.0% below list) — sets the bar for market timing.
- Cap rate 25.4% vs local median 6.0% in Baltimore — top-decile yield for the area; either an underpriced asset or a hidden risk that comps aren't pricing in. Stress-test before assuming the spread holds.
Location & tenants
- Location reads 76/100 on livability (#90 in MD, #3,396 nationally) — a middle-class / working-renter tenant base. Strengths: amenities A+, commute A+, housing A+; Watch: schools D, crime F.
- Baltimore City Public Schools (urban): math 7% / reading 16% proficiency, ranked #24 of 24 in MD (top 100%) — low school quality limits family demand, transient renter base, plan for 1-2y turnover; 79% free/reduced lunch — lower-income household profile, screen leases tightly.
- Market conditions: Rents rising (+1.3%/yr); 393 active listings in the ZIP; 40 comparable units currently listed for rent nearby; rentals at typical pace (median 25d on market — plan ~3-4 weeks tenant-placement turnaround); solid renter incomes; 1,273 units permitted in Baltimore city in 2024 (1,104 in 5+ unit buildings).
Forward outlook
- Local home prices are declining (-3.0%/yr); year-one equity from $449 of loan paydown is wiped out by about $2k of value loss. Plan a longer hold.
- Baltimore County population projected to shrink 4% by 2050 — rents likely to lag national; underwrite the cash flow, not the appreciation.
- At projected returns (-3.0% appreciation + 1.3% rent growth), your $18k cash investment doubles in ~2 years — after that, you're playing with house money.
Negotiation context
- It's been on market 67 days — a 6% lower offer ($61k) is reasonable based on typical stale-listing flexibility.
- 23 sale attempts since 30y ago; this cycle's ask has dropped $5k (7%) from the opening price — seller is motivated, your offer sets the floor, not the list.
Risks & watch-outs
- Watch-outs: property tax is 3.0% of price; built in 1900 — expect roof / HVAC / electrical / plumbing capex.
- Climate carrying-cost: major wind risk, 27% chance of damaging wind over 30y; extreme-heat days projected 7→15/yr by 2055 (HVAC capex compounding) — expect insurance premiums to compound above CPI over the hold.
Questions for the listing agent
- It's been on market 67 days. Have you received any prior offers? Is the seller open to a 6% concession, seller financing, or rate buy-down credit?
- Built in 1900 — when were the roof, HVAC, electrical panel, plumbing, and water heater last replaced?
- Property tax is high relative to price — has the assessment been appealed recently, and will the sale trigger a re-assessment?
- Why hasn't it sold? Are there any deal-killer items the seller is aware of (foundation, flood, title, zoning, code violations)?
- Is there a deadline driving the sale (1031 exchange, divorce, estate, relocation)? That informs how much negotiation room exists.
- Schools are D-rated, which usually means shorter tenancies and higher turnover. Who's the typical renter profile here, and what's been the actual vacancy rate?
- Crime grade is F in this area — have there been break-ins, vandalism, or insurance claims at this property in the last 3 years? What carrier currently insures it and at what premium?
- What's the average days-on-market for RENTAL listings here right now (not sales)? A rising rental-DOM trend means longer vacancies and softer asking-rent achievability than the comps imply.
- What's the recent tenant-quality profile in this submarket — average credit score on applications, eviction rate, late-payment / NSF rate, and stable-employment percentage? A property-management company in the area should have these aggregated.
- How much new for-sale + rental construction is in the pipeline within 1–3 miles? Heavy new supply typically softens prices + rents 12–24 months out; constrained supply supports both.
Investment metrics
- 1% rule
- 3.05% ✓
- Cap rate
- 25.43%
- Cash-on-cash
- 68.34%
- DSCR
- 4.04
- GRM
- 2.7
CMA / ARV
- ARV (on-the-fly)
- $171,840
- Comps found
- 12
Show comp detail 12 sales within ~0.75 mi
| Address | Dist | Beds/Ba | Sqft | Sold | Price | $/sf | Match |
|---|---|---|---|---|---|---|---|
| 441 N East Ave | 0.29mi | 3/1.5 | 976 (+2%) | 2mo | $175,000 | $179 | 80 |
| 530 N Curley St | 0.44mi | 3/1.0 | 960 (0%) | 2mo | $85,000 | $89 | 78 |
| 3534 E Fairmount Ave | 0.16mi | 2/1.0 (-1) | 1,018 (+6%) | 2mo | $86,000 | $84 | 76 |
| 20 N Decker Ave | 0.20mi | 3/1.0 | 1,040 (+8%) | 2mo | $149,000 | $143 | 75 |
| 155 N Streeper St | 0.36mi | 2/2.0 (-1) | 912 (-5%) | 0mo | $220,000 | $241 | 66 |
| 3500 E Fairmount Ave | 0.12mi | 2/1.0 (-1) | 1,092 (+14%) | 2mo | $107,000 | $98 | 65 |
| 735 N Lakewood Ave | 0.66mi | 3/1.5 | 970 (+1%) | 2mo | $80,000 | $82 | 64 |
| 14 S Curley St | 0.29mi | 2/1.0 (-1) | 1,092 (+14%) | 1mo | $269,000 | $246 | 58 |
| 309 S Fagley St | 0.45mi | 2/2.0 (-1) | 1,030 (+7%) | 1mo | $225,000 | $218 | 58 |
| 629 N Kenwood Ave | 0.55mi | 2/1.5 (-1) | 1,100 (+15%) | 1mo | $76,500 | $70 | 42 |
| 816 S Dean St | 0.72mi | 2/1.5 (-1) | 1,088 (+13%) | 2mo | $279,900 | $257 | 36 |
| 806 S Bouldin St | 0.68mi | 2/2.5 (-1) | 1,080 (+12%) | 1mo | $360,000 | $333 | 35 |
Match score weights: distance 35% · size 25% · config 20% · recency 20%. Top-matched comps best support the ARV.
Projected returns pro-forma
-3.0% appreciation · 1.31% rent growth · sell at horizon
- IRR
- 65.8%
- Equity multiple
- 3.87×
- Total profit
- $52,243
- Equity at exit
- $9,692
- IRR
- 69.5%
- Equity multiple
- 7.46×
- Total profit
- $117,661
- Equity at exit
- $5,620
Cash invested: $18,200 (down + closing). Projections, not guarantees.
Landlord ↔ Tenant lean methodology
- Overall (CITY)
- 12 Strongly Tenant-Friendly
- State Maryland
- 27 Tenant-Leaning · D+14
- County
- — inherits STATE
- City Baltimore
- 12 Strongly Tenant-Friendly · D+58
ZIP-level market 21224
- Rents YoY
- 1.3%
- Active inventory
- 393
- Price-to-rent
- 2.7×
Monthly cashflow live
- Estimated rent
- $1,984 high interval (Pro) →
- Mortgage (P&I)
- −$341
- Tax from tax record
- −$163 /mo · $1,957/yr
- Insurance
- −$27
- HOA
- −$0
- Vacancy / Maint / Mgmt
- −$417
- Net cashflow
- $1,036
Break-even live
Sensitivity live
| Price | -10% $1,073 | -5% $1,055 | +0% $1,036 | +5% $1,018 | +10% $1,000 |
|---|---|---|---|---|---|
| Rent | -10% $880 | -5% $958 | +0% $1,036 | +5% $1,115 | +10% $1,193 |
| Rate | -1.0pp $1,069 | -0.5pp $1,053 | base $1,036 | +0.5pp $1,020 | +1.0pp $1,003 |
UW: 25.0% down · 7.5% · 30yr · 1.5% tax · 5.0% vac · 8.0% maint · 8.0% mgmt
Financing live
Cash to close
- Down payment
- $16,250
- Closing costs
- $1,950
- Reserves months
- —
- Total cash needed
- —
Loan-product check · same deal, 3 products live
Conventional
25% down · 7.5% · 30yr
- Down + closing
- —
- Monthly P&I
- —
- Monthly cashflow
- —
- DSCR
- —
- Eligible?
- —
Personal DTI + credit; lowest rate.
DSCR
20% down · 8.5% · 30yr
- Down + closing
- —
- Monthly P&I
- —
- Monthly cashflow
- —
- DSCR
- —
- Eligible?
- —
No personal income docs; deal must DSCR.
Hard money
10% down · 12.0% · 12mo
- Down + closing
- —
- Monthly P&I
- —
- Monthly cashflow
- —
- DSCR
- —
- Eligible?
- —
Short-term bridge; refi at stabilization.
Rent comps 40 comps
| Address | Beds | Baths | Sqft | Rent | $/sqft | DOM | Units | Dist |
|---|---|---|---|---|---|---|---|---|
| 3205 Esther Pl Baltimore, MD | 2.0 | 2.0 | 960 | $1,850 | $1.93 | 25d | 1 | 0.09mi |
| 29 N Ellwood Ave Baltimore, MD | 3.0 | 1.5 | 1100 | $2,395 | $2.18 | 25d | 1 | 0.12mi |
| 3413 Leverton Ave Baltimore, MD | 2.0 | 1.0 | 832 | $1,000 | $1.20 | 25d | 1 | 0.15mi |
| 203 N Ellwood Ave Unit Main Baltimore, MD | 2.0 | 2.0 | 880 | $2,200 | $2.50 | 25d | 1 | 0.18mi |
| 520 N Decker Ave Baltimore, MD | 2.0 | 1.0 | 1000 | $1,650 | $1.65 | 44d | 1 | 0.36mi |
| 400 S Highland Ave Unit 402 Baltimore, MD | 2.0 | 1.0 | 900 | $1,700 | $1.89 | 44d | 1 | 0.40mi |
| 223 Grundy St Baltimore, MD | 2.0 | 1.0 | 864 | $1,450 | $1.68 | 25d | 1 | 0.46mi |
| 415 N Belnord Ave Baltimore, MD | 2.0 | 1.0 | 1008 | $1,300 | $1.29 | 25d | 1 | 0.46mi |
| 127 N Glover St Baltimore, MD | 2.0 | 1.5 | 1110 | $2,100 | $1.89 | 3d | 1 | 0.47mi |
| 321 Fagley St Baltimore, MD | 2.0 | 1.0 | 800 | $1,650 | $2.06 | 21d | 1 | 0.48mi |
| 2608 E Fayette St Unit 1 Baltimore, MD | 2.0 | 1.0 | 900 | $1,700 | $1.89 | 16d | 1 | 0.50mi |
| 531 N Belnord Ave Baltimore, MD | 2.0 | 1.5 | 1100 | $1,700 | $1.55 | 25d | 1 | 0.52mi |
| 415 N Glover St Baltimore, MD | 2.0 | 2.5 | 1092 | $1,600 | $1.47 | 25d | 1 | 0.53mi |
| 3905 Bank St Baltimore, MD | 4.0 | 1.0–3.0 | 909 | $2,820 | $3.10 | 3d | 20 | 0.54mi |
| 104 N Rose St Baltimore, MD | 3.0 | 2.0 | 936 | $2,500 | $2.67 | 44d | 1 | 0.56mi |
| 502 N Glover St Baltimore, MD | 2.0 | 1.5 | 827 | $1,250 | $1.51 | 21d | 1 | 0.57mi |
| 233 N Rose St Baltimore, MD | 2.0 | 2.5 | 934 | $1,750 | $1.87 | 19d | 1 | 0.57mi |
| 224 N Rose St Baltimore, MD | 2.0 | 2.5 | 1120 | $1,875 | $1.67 | 19d | 1 | 0.58mi |
| 643 S Potomac St Baltimore, MD | 2.0 | 1.0 | 785 | $1,650 | $2.10 | 44d | 1 | 0.61mi |
| 107 N Port St Baltimore, MD | 2.0 | 2.0 | 870 | $1,995 | $2.29 | 25d | 1 | 0.62mi |
| 4015 Eastern Ave Unit 2L Baltimore, MD | 3.0 | 2.0 | 1100 | $1,800 | $1.64 | 44d | 1 | 0.62mi |
| 517 N Rose St Baltimore, MD | 3.0 | 1.0 | 845 | $1,400 | $1.66 | 5d | 1 | 0.63mi |
| 402 N Milton Ave Unit 402B Baltimore, MD | 2.0 | 1.0 | 950 | $1,290 | $1.36 | 44d | 1 | 0.64mi |
| 2729 Ashland Ave Baltimore, MD | 3.0 | 1.0 | 1000 | $1,350 | $1.35 | 3d | 1 | 0.68mi |
| 437 N Montford Ave Baltimore, MD | 3.0 | 1.5 | 1100 | $1,450 | $1.32 | 44d | 1 | 0.70mi |
| 16 N Bradford St Baltimore, MD | 2.0 | 3.5 | 930 | $2,400 | $2.58 | 5d | 1 | 0.71mi |
| 2308 Jefferson St Baltimore, MD | 3.0 | 1.0 | 907 | $1,450 | $1.60 | 44d | 1 | 0.76mi |
| 618 N Montford Ave Baltimore, MD | 3.0 | 1.0 | 1050 | $1,468 | $1.40 | 16d | 1 | 0.78mi |
| 618 N Montford Ave Baltimore, MD | 3.0 | 1.0 | 1050 | $1,468 | $1.40 | 44d | 1 | 0.78mi |
| 108 N Madeira St Baltimore, MD | 2.0 | 2.0 | 1098 | $1,900 | $1.73 | 44d | 1 | 0.79mi |
| 720 N Port St Baltimore, MD | 2.0 | 1.0 | 950 | $1,300 | $1.37 | 44d | 1 | 0.79mi |
| 3610 Dillon St Baltimore, MD | 1.0–2.0 | 1.0–2.0 | 828 | $2,820 | $3.41 | 44d | 1 | 0.81mi |
| 211 S Madeira St Baltimore, MD | 2.0 | 1.0 | 819 | $1,650 | $2.01 | 5d | 1 | 0.81mi |
| 227 S Madeira St Baltimore, MD | 2.0 | 2.5 | 1100 | $2,200 | $2.00 | 44d | 1 | 0.81mi |
| 305 S Collington Ave Baltimore, MD | 3.0 | 2.5 | 722 | $2,895 | $4.01 | 18d | 1 | 0.88mi |
| 328 S Collington Ave Baltimore, MD | 2.0 | 2.0 | 1100 | $2,300 | $2.09 | 44d | 1 | 0.90mi |
| 3518 Elliott St Baltimore, MD | 3.0 | 2.5 | 1036 | $2,800 | $2.70 | 19d | 1 | 0.94mi |
| 1310 N Ellwood Ave #1 Baltimore, MD | 2.0 | 1.0 | 1000 | $1,550 | $1.55 | 23d | 1 | 0.95mi |
| 1310 N Ellwood Ave Baltimore, MD | 2.0 | 1.0 | 1000 | $1,450 | $1.45 | 13d | 1 | 0.95mi |
| 712 N Duncan St Baltimore, MD | 2.0 | 1.5 | 1000 | $2,000 | $2.00 | 44d | 1 | 0.98mi |
Listing history 50 events
-
2026-06-21days on market $65,000 Active 67 DOM
-
2026-06-18days on market $65,000 Active 64 DOM
-
2026-06-17days on market $65,000 Active 63 DOM
-
2026-06-16days on market $65,000 Active 62 DOM
-
2026-06-15days on market $65,000 Active 61 DOM
-
2026-06-13days on market $65,000 Active 59 DOM
-
2026-06-09days on market $65,000 Active 55 DOM
-
2026-06-08days on market $65,000 Active 54 DOM
-
2026-06-07days on market $65,000 Active 53 DOM
-
2026-06-04pricedays on market $65,000 Active 50 DOM
-
2026-06-03days on market $69,900 Active 49 DOM
-
2026-06-02days on market $69,900 Active 48 DOM
-
2026-06-02status $69,900 Active 47 DOM
-
2026-01-21historical Active Under Contract
-
2025-12-05$69,900 Active
-
2022-02-17soldstatus $1,523,875
-
2018-04-13soldstatus $62,000
-
2018-04-10soldstatus $62,000 Sold 238-char remark
Show marketing remark (238 chars)
TOTALLY RENOVATED 3B 1FB END OF UNIT TOWNHOME - SPACIOUS KITCHEN WITH NEW STAINLESS APPLIANCES - 2ND LEVEL WITH 3/ BEDROOMS HARDWOOD FLOOR - FINISHED BASEMENT WITH ANOTHER BEDROOM-REAR FENCE PATIO THAT COULD BE CONVERTED IN A PARKING PAD.
-
2018-04-10soldstatus $62,000 Closed 238-char remark
Show marketing remark (238 chars)
TOTALLY RENOVATED 3B 1FB END OF UNIT TOWNHOME - SPACIOUS KITCHEN WITH NEW STAINLESS APPLIANCES - 2ND LEVEL WITH 3/ BEDROOMS HARDWOOD FLOOR - FINISHED BASEMENT WITH ANOTHER BEDROOM-REAR FENCE PATIO THAT COULD BE CONVERTED IN A PARKING PAD.
-
2018-03-12status Pending 238-char remark
Show marketing remark (238 chars)
TOTALLY RENOVATED 3B 1FB END OF UNIT TOWNHOME - SPACIOUS KITCHEN WITH NEW STAINLESS APPLIANCES - 2ND LEVEL WITH 3/ BEDROOMS HARDWOOD FLOOR - FINISHED BASEMENT WITH ANOTHER BEDROOM-REAR FENCE PATIO THAT COULD BE CONVERTED IN A PARKING PAD.
-
2018-03-12status Contract 238-char remark
Show marketing remark (238 chars)
TOTALLY RENOVATED 3B 1FB END OF UNIT TOWNHOME - SPACIOUS KITCHEN WITH NEW STAINLESS APPLIANCES - 2ND LEVEL WITH 3/ BEDROOMS HARDWOOD FLOOR - FINISHED BASEMENT WITH ANOTHER BEDROOM-REAR FENCE PATIO THAT COULD BE CONVERTED IN A PARKING PAD.
-
2018-02-14status Active 238-char remark
Show marketing remark (238 chars)
TOTALLY RENOVATED 3B 1FB END OF UNIT TOWNHOME - SPACIOUS KITCHEN WITH NEW STAINLESS APPLIANCES - 2ND LEVEL WITH 3/ BEDROOMS HARDWOOD FLOOR - FINISHED BASEMENT WITH ANOTHER BEDROOM-REAR FENCE PATIO THAT COULD BE CONVERTED IN A PARKING PAD.
-
2018-01-18status Contract 238-char remark
Show marketing remark (238 chars)
TOTALLY RENOVATED 3B 1FB END OF UNIT TOWNHOME - SPACIOUS KITCHEN WITH NEW STAINLESS APPLIANCES - 2ND LEVEL WITH 3/ BEDROOMS HARDWOOD FLOOR - FINISHED BASEMENT WITH ANOTHER BEDROOM-REAR FENCE PATIO THAT COULD BE CONVERTED IN A PARKING PAD.
-
2018-01-05status Active 238-char remark
Show marketing remark (238 chars)
TOTALLY RENOVATED 3B 1FB END OF UNIT TOWNHOME - SPACIOUS KITCHEN WITH NEW STAINLESS APPLIANCES - 2ND LEVEL WITH 3/ BEDROOMS HARDWOOD FLOOR - FINISHED BASEMENT WITH ANOTHER BEDROOM-REAR FENCE PATIO THAT COULD BE CONVERTED IN A PARKING PAD.
-
2018-01-03status Contract 238-char remark
Show marketing remark (238 chars)
TOTALLY RENOVATED 3B 1FB END OF UNIT TOWNHOME - SPACIOUS KITCHEN WITH NEW STAINLESS APPLIANCES - 2ND LEVEL WITH 3/ BEDROOMS HARDWOOD FLOOR - FINISHED BASEMENT WITH ANOTHER BEDROOM-REAR FENCE PATIO THAT COULD BE CONVERTED IN A PARKING PAD.
-
2017-11-28$69,900 Active 238-char remark
Show marketing remark (238 chars)
TOTALLY RENOVATED 3B 1FB END OF UNIT TOWNHOME - SPACIOUS KITCHEN WITH NEW STAINLESS APPLIANCES - 2ND LEVEL WITH 3/ BEDROOMS HARDWOOD FLOOR - FINISHED BASEMENT WITH ANOTHER BEDROOM-REAR FENCE PATIO THAT COULD BE CONVERTED IN A PARKING PAD.
-
2017-09-20historical
-
2017-09-20historical Withdrawn
-
2017-07-25price
-
2017-06-01price
-
2017-04-27status Active
-
2017-04-15status Contract
-
2017-03-03price
-
2017-01-18price
-
2016-10-14price
-
2016-09-28Active
-
2016-09-28$79,000
-
2014-05-29soldstatus $45,000 Sold
-
2014-05-29soldstatus $45,000
-
2014-05-20historical
-
2014-04-25status Contract
-
2014-04-25price $49,900
-
2014-04-08price $52,500
-
2014-02-28status Active
-
2014-01-27status Contract
-
2014-01-24status Active
-
2014-01-24historical
-
2014-01-20status Active
-
2014-01-14status Contract
ⓘ Source: listings_history table (triggers on properties + properties_extension) + one-shot
backfill from property_details.listing_events for pre-trigger history.
Tax reassessment forecast MD · Partial reset (capped growth)
- Current annual tax
- $1,957 · $163/mo
- Projected year-2 tax
- $1,957 · $163/mo
- Expected delta
- $0/yr ($0/mo · 0.0%)
ⓘ Screening estimate from a state-policy table — verify with the county assessor before closing.
Climate risk First Street
- Flood 1/10 Low FEMA zone X (unshaded) · 0% chance over 30 yrs
- Wildfire 1/10 Low
- Heat 8/10 Severe 7 d/yr ≥103°F today · 15 d/yr by 30 yrs out
- Wind 6/10 Major 27% chance of damaging wind over 30 yrs
- Air quality 4/10 Moderate 6 unhealthy d/yr today · 7 by 30 yrs out
Nearby sold comps map
Loading sold comps map…
Walkable amenities ~0.75 mi
Loading nearby amenities…
Taxation est. · year 1
- Rental income
- $23,810
- − Mortgage interest
- −$3,641
- − Property taxes
- −$1,957
- − Insurance
- −$325
- − Repairs & maintenance
- −$1,905
- − Management
- −$1,905
- − Depreciation
- −$1,891
- Taxable income
- $12,187
- Est. tax owed @ 24.0%
- −$2,925
- After-tax cash flow
- $9,513/yr
For passive investors: Depreciation is non-cash, so a rental often shows a tax loss while cash-flowing — sheltering income. Rental losses are passive: they offset passive income freely, and up to $25,000/yr can offset ordinary (W-2) income if you actively participate and your MAGI is under $100k (phasing out to $0 by $150k); unused losses carry forward. On sale, claimed depreciation is recaptured at up to 25%, and gains may owe capital-gains tax (a 1031 exchange can defer both). Figures are a year-1 estimate at your 24.0% rate — not tax advice; consult a CPA.
Schools (NCES district)
- District
- Baltimore City Public Schools
- NCES district ID
- 2400090
- Math proficiency
- 7% ▼ -9.00%
- Reading proficiency
- 16% ▼ -5.00%
- Median HH income
- $42,108
- Composite
- 10.08/100
- National rank
- #9805
- State rank
- #24 of 24 in MD
Livability — Baltimore
- Score
- 76/100
- State rank
- #90
- US rank
- #3396
Category grades
Schools grade is shown separately in the Schools card above.
Census & demographics
- Census place
- Baltimore, MD
- County
- Baltimore City · 558,601 people
- City population
- 588,727
- Metro
- Baltimore-Columbia-Towson, MD
- Population (ZIP)
- 47,465
- Household income
- $89,017
- Rent vs Own
- Severe rent burden
- 1786.0
Population outlook (Baltimore County) Hauer SSP2
- Today (2025)
- 624,249 people
- By 2030
- 621,541 · -0.4%
- By 2040
- 609,756 · -2.3%
- By 2050
- 597,249 · -4.3%
- By 2075
- 552,236 · -11.5%
- By 2100
- 513,934 · -17.7%
Race, ethnicity, and origin ACS 2023
- Neighborhood character
- Diverse neighborhood (Simpson 0.62)
- Race & ethnicity
- White 55% Hispanic / Latino 21% Black 16% Two or more races 7% Asian 4%
- Hispanic origin (detail)
- Mexican 4% Puerto Rican 2% Dominican 1%
- Common ancestry
- Romanian 5% Lithuanian 2% Italian 1%
- Foreign-born
- 17% · Canada, China, Vietnam
- Languages at home
- 76% English-only · Spanish 18% Other Indo-European 2% Russian/Polish/Slavic 1%
Political lean MEDSL · Baltimore
- 2024 margin
- Solid D (+73.0) · D 85.2% · R 12.2% · Other 2.6%
- 2008→2024 swing
- -2.5pp toward R · 2008: 75.5pp · 2024: 73.0pp
- All cycles
- 2024: D+73.0 2020: D+76.6 2016: D+74.6 2012: D+76.4 2008: D+75.5
Not yet ingested
- Civics
- —
Market trends
- HPI YoY
- ▼ -332.23%
- Current HPI
- 241.284
- Rent YoY
- ▲ 1.31%
- Metro
- Baltimore-Columbia-Towson, MD
- State GDP YoY
- ▲ 2.97%
- F500 in state
- 12
Industry mix (Fortune 500 HQ in MD)
| Industry | F500 HQs | Revenue |
|---|---|---|
| Aerospace / Defense | 1 | $71B |
|
||
| Utilities | 1 | $25B |
|
||
| Hotels | 1 | $24B |
|
||
| Consumer Goods | 1 | $7B |
|
||
| Real Estate | 1 | $6B |
|
||
| Chemicals | 1 | $2B |
|
||
Price history
+482.6% since first listed71 events — show timeline
- 2026-01-21 Contingent — BRIGHT MLS
- 2025-12-05 Listed $69,900 BRIGHT MLS
- 2022-02-17 Sold (Public Records) $1,523,875 Public Records
- 2018-04-13 Sold (Public Records) $62,000 Public Records
- 2018-04-10 Sold (MLS) $62,000 BRIGHT MLS
- 2018-04-10 Sold (MLS) $62,000 MRIS
- 2018-03-12 Pending — BRIGHT MLS
- 2018-03-12 Pending — MRIS
- 2018-02-14 Relisted — MRIS
- 2018-01-18 Pending — MRIS
- 2018-01-05 Relisted — MRIS
- 2018-01-03 Pending — MRIS
- 2017-11-28 Listed $69,900 BRIGHT MLS
- 2017-11-28 Listed $69,900 MRIS
- 2017-09-20 Delisted — MRIS
- 2017-09-20 Listing Removed — BRIGHT MLS
- 2017-07-25 Price Changed — MRIS
- 2017-06-01 Price Changed — MRIS
- 2017-04-27 Relisted — MRIS
- 2017-04-15 Pending — MRIS
- 2017-03-03 Price Changed — MRIS
- 2017-01-18 Price Changed — MRIS
- 2016-10-14 Price Changed — MRIS
- 2016-09-28 Listed — MRIS
- 2016-09-28 Listed $79,000 BRIGHT MLS
- 2014-05-29 Sold (MLS) $45,000 BRIGHT MLS
- 2014-05-29 Sold (MLS) $45,000 MRIS
- 2014-05-20 Listing Removed — BRIGHT MLS
- 2014-04-25 Pending — MRIS
- 2014-04-25 Price Changed $49,900 MRIS
- 2014-04-08 Price Changed $52,500 MRIS
- 2014-02-28 Relisted — MRIS
- 2014-01-27 Pending — MRIS
- 2014-01-24 Relisted — MRIS
- 2014-01-24 Delisted — MRIS
- 2014-01-20 Relisted — MRIS
- 2014-01-14 Pending — MRIS
- 2014-01-14 Relisted — MRIS
- 2014-01-13 Pending — MRIS
- 2014-01-07 Price Changed $55,000 MRIS
- 2013-12-04 Listed $59,900 MRIS
- 2013-12-04 Listed $49,900 BRIGHT MLS
- 2011-10-12 Delisted — MRIS
- 2011-10-12 Listing Removed — BRIGHT MLS
- 2011-04-22 Price Changed — MRIS
- 2010-12-24 Price Changed — MRIS
- 2010-10-29 Price Changed — MRIS
- 2010-10-11 Listed — MRIS
- 2010-10-11 Listed $65,000 BRIGHT MLS
- 2010-08-01 Delisted — MRIS
- 2010-08-01 Listing Removed — BRIGHT MLS
- 2010-04-26 Price Changed — MRIS
- 2010-02-15 Price Changed — MRIS
- 2010-02-03 Listed — MRIS
- 2010-02-03 Listed $85,000 BRIGHT MLS
- 2007-05-29 Sold (Public Records) $100,000 Public Records
- 2004-09-03 Sold (MLS) $18,400 MRIS
- 2004-08-13 Delisted — MRIS
- 2004-07-12 Listed $19,900 MRIS
- 2004-01-22 Delisted — MRIS
- 2003-09-12 Listed — MRIS
- 1997-06-30 Sold (MLS) $11,000 MRIS
- 1997-06-06 Delisted — MRIS
- 1997-03-09 Listed $17,900 MRIS
- 1997-02-28 Delisted — MRIS
- 1997-01-01 Listed — MRIS
- 1996-09-23 Delisted — MRIS
- 1996-06-25 Listed — MRIS
- 1990-12-10 Sold (Public Records) $22,900 Public Records
- 1989-07-13 Sold (Public Records) $11,500 Public Records
- 1989-07-13 Sold (Public Records) $11,997 Public Records
Property tax history
+0.6%/yrLatest (2025): $1,957 · +7.9% YoY. Source: county tax records.
Cash-flow waterfall
monthlySold comps — $/sqft
last 12 mo · ≤1 miLoading sold comps…