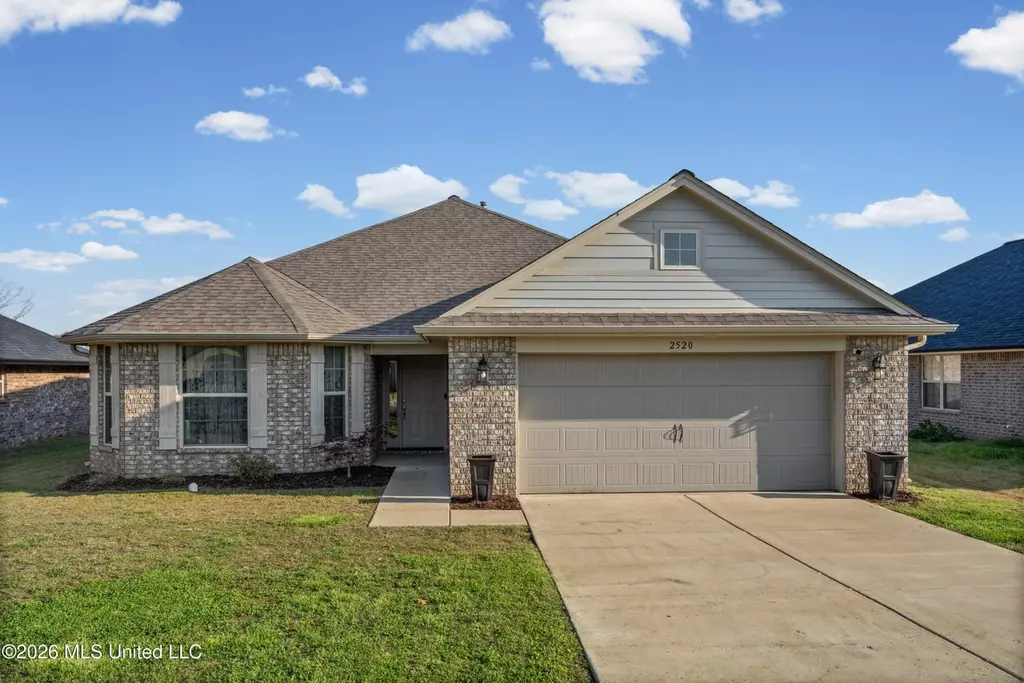
2520 Rutherford Dr · Southaven, MS
Flood risk 1/10 · Minimal
- FEMA flood zone
- X (unshaded)
- Chance of flooding over 30 yrs
- 0.0%
- Est. flood insurance / yr
- $507 – $1,088
Fire risk 4/10 · Minor
- Est. fire insurance / yr
- $1,241 – $2,305
Heat risk 6/10 · Moderate
- Hot days now (above 109°F)
- 7 days/yr
- Hot days in 30 yrs
- 21 days/yr
Wind risk 4/10 · Minor
- Chance of severe wind over 30 yrs
- 16.0%
Air-quality risk 2/10 · Minimal
- Unhealthy air days now
- 2 days/yr
- Unhealthy air days in 30 yrs
- 2 days/yr
Risk factors via First Street. Map © Google.
Why this score? — see what drove the C- grade
The composite is a weighted blend of 9 inputs, each scored 0–100. Each bar is that input's sub-score; the figure is the points it added to the 100-point composite (weight × sub-score).
- Cash flow +16.2/30.0
- ARV discount +14.7/15.0
- DSCR +5.0/10.0
- Schools +4.0/10.0
- Condition / age +4.0/5.0
- 1% rule +3.8/10.0
- Livability +3.2/5.0
- Rent growth +2.5/5.0
- Appreciation +0.0/10.0
$285,000
🖨 Deal sheet 📄 Offer letter ✓ Due diligence
Listing remarks MLS
Just Like New! Built in 2022 -This beautiful home features an open floor plan perfect for entertaining, with four bedrooms, two full bathrooms, a separate dining room, and a spacious kitchen equipped with stainless steel appliances--including the refrigerator in the kitchen and the refrigertor in the garage. The kitchen offers ample counter space and a large island, ideal for family gatherings and everyday living. The primary suite showcases a coffered ceiling and a luxurious en-suite bath with dual vanities, a soaking tub with tile surround, and a separate shower. Additional highlights include extra insulation in the attic and an electrical workbench in the garage. Relax and unwind on the private back patio--perfect for enjoying peaceful mornings or evenings. Located in the desirable DeSoto Central School District near the Snowden Grove area, this home is just minutes from Silo Square, offering a variety of shops, restaurants, and an amphitheater. The property also includes a transferable 10-year structural warranty. Don't miss this opportunity! Schedule your private showing today. This is a short-sale attempt
Key facts
- Open floor plan
- Ample counter space
- Spacious kitchen
Tags
Neighborhood map
What this means for you Summary
Snapshot
- This is a 4-bed/2.0-bath single-family listed at $285k. Condition is rated good.
Deal economics
- At list price, monthly cash flow is $151 ($2k/yr) — positive.
- The deal already cash-flows at list — no discount required.
- To meet the 1% rule (rent ≥ 1% of price), the offer needs to be $249k (12.5% below list).
- Recommended offer: $249k (12.5% below list) — sets the bar for 1% rule.
- Cap rate 6.9% vs local median 5.2% in Southaven — top-decile yield for the area; either an underpriced asset or a hidden risk that comps aren't pricing in. Stress-test before assuming the spread holds.
Location & tenants
- Location reads 65/100 on livability (#107 in MS) — a middle-class / working-renter tenant base. Strengths: cost of living A+, housing A+; Watch: schools D+, amenities F, commute F.
- Desoto County School District (suburban): math 48% / reading 42% proficiency, ranked #20 of 130 in MS (top 15%) — families likely to look elsewhere, expect single-tenant / working-renter base with shorter leases.
- Market conditions: 157 active listings in the ZIP; 14 comparable units currently listed for rent nearby; rentals leasing fast (median 12d on market — plan ~1-2 weeks tenant-placement turnaround); high-income renter base; 1,155 units permitted in DeSoto County in 2024 (0 in 5+ unit buildings).
Forward outlook
- Local home prices are declining (-3.0%/yr); year-one equity from $2k of loan paydown is wiped out by about $9k of value loss. Plan a longer hold.
- DeSoto County population projected at +33% by 2050 — long-run rental-demand tailwind backs the buy-and-hold thesis.
Negotiation context
- It's been on market 46 days — a 3% lower offer ($276k) is reasonable based on typical stale-listing flexibility.
- 4 sale attempts since 4y ago with the ask held roughly flat each time — persistent listings suggest the price (not the market) is what's stuck; bring a comps-based counter.
Risks & watch-outs
- Climate carrying-cost: extreme-heat days projected 7→21/yr by 2055 (HVAC capex compounding) — expect insurance premiums to compound above CPI over the hold.
Questions for the listing agent
- It's been on market 46 days. Have you received any prior offers? Is the seller open to a 12% concession, seller financing, or rate buy-down credit?
- Is there a deadline driving the sale (1031 exchange, divorce, estate, relocation)? That informs how much negotiation room exists.
- Schools are D-rated, which usually means shorter tenancies and higher turnover. Who's the typical renter profile here, and what's been the actual vacancy rate?
- What's the average days-on-market for RENTAL listings here right now (not sales)? A rising rental-DOM trend means longer vacancies and softer asking-rent achievability than the comps imply.
- What's the recent tenant-quality profile in this submarket — average credit score on applications, eviction rate, late-payment / NSF rate, and stable-employment percentage? A property-management company in the area should have these aggregated.
- How much new for-sale + rental construction is in the pipeline within 1–3 miles? Heavy new supply typically softens prices + rents 12–24 months out; constrained supply supports both.
Investment metrics
- 1% rule
- 0.88% ✗
- Cap rate
- 6.93%
- Cash-on-cash
- 2.27%
- DSCR
- 1.10
- GRM
- 9.5
CMA / ARV
- ARV (median comp)
- $339,167
- List price
- $285,000
- Delta
- -15.97%
- Verdict
- UNDERPRICED
- Comps
- 20 within 1.0 mi
Show comp detail 12 sales within ~0.75 mi
| Address | Dist | Beds/Ba | Sqft | Sold | Price | $/sf | Match |
|---|---|---|---|---|---|---|---|
| 5945 Antler Trl | 0.13mi | 4/2.0 | 2,167 (-1%) | 3mo | $299,500 | $138 | 90 |
| 2520 Saint Charles Cv | 0.54mi | 3/2.0 (-1) | 2,098 (-4%) | 2mo | $406,900 | $194 | 62 |
| 2557 Saint Charles Cv | 0.52mi | 3/2.0 (-1) | 2,121 (-3%) | 5mo | $410,900 | $194 | 62 |
| 2531 Saint Charles Cv | 0.51mi | 3/2.0 (-1) | 2,079 (-5%) | 7mo | $402,900 | $194 | 58 |
| 6643 Belltower Pl | 0.73mi | 4/3.0 | 2,196 (+1%) | 8mo | $410,000 | $187 | 55 |
| 2595 Hunters Pointe Dr | 0.26mi | 3/2.0 (-1) | 1,890 (-13%) | 7mo | $305,999 | $162 | 54 |
| 5843 Savannah Pkwy | 0.72mi | 4/2.0 | 2,026 (-7%) | 2mo | $289,500 | $143 | 53 |
| 2543 Saint Charles Cv | 0.51mi | 3/2.0 (-1) | 2,000 (-8%) | 5mo | $389,900 | $195 | 53 |
| 6530 Eastland Ct | 0.58mi | 3/3.0 (-1) | 2,326 (+7%) | 3mo | $442,900 | $190 | 51 |
| 8710 Casey Jones Dr | 0.58mi | 4/2.5 | 1,898 (-13%) | 3mo | $308,000 | $162 | 47 |
| 6555 Westland Ct | 0.63mi | 3/2.5 (-1) | 2,378 (+9%) | 5mo | $450,900 | $190 | 45 |
| 3208 Foxdale Loop | 0.70mi | 3/2.0 (-1) | 2,482 (+14%) | 3mo | $382,000 | $154 | 38 |
Match score weights: distance 35% · size 25% · config 20% · recency 20%. Top-matched comps best support the ARV.
Projected returns pro-forma
-3.0% appreciation · 3.0% rent growth · sell at horizon
- IRR
- -12.7%
- Equity multiple
- 0.54×
- Total profit
- $-36,613
- Equity at exit
- $42,494
- IRR
- -3.7%
- Equity multiple
- 0.75×
- Total profit
- $-19,710
- Equity at exit
- $24,642
Cash invested: $79,800 (down + closing). Projections, not guarantees.
Landlord ↔ Tenant lean methodology
- Overall (STATE)
- 90 Strongly Landlord-Friendly
- State Mississippi
- 90 Strongly Landlord-Friendly · R+11
- County
- — inherits STATE
- City
- — inherits STATE
ZIP-level market 38672
- Home prices YoY
- -13.1%
- Active inventory
- 157
- Price-to-rent
- 9.5×
Monthly cashflow live
- Estimated rent
- $2,495 high interval (Pro) →
- Mortgage (P&I)
- −$1,495
- Tax from tax record
- −$206 /mo · $2,476/yr
- Insurance
- −$119
- HOA
- −$0
- Vacancy / Maint / Mgmt
- −$524
- Net cashflow
- $151
Break-even live
UW: 25.0% down · 7.5% · 30yr · 1.5% tax · 5.0% vac · 8.0% maint · 8.0% mgmt
Financing live
Cash to close
- Down payment
- $71,250
- Closing costs
- $8,550
- Reserves months
- —
- Total cash needed
- —
Loan-product check · same deal, 3 products live
Conventional
25% down · 7.5% · 30yr
- Down + closing
- —
- Monthly P&I
- —
- Monthly cashflow
- —
- DSCR
- —
- Eligible?
- —
Personal DTI + credit; lowest rate.
DSCR
20% down · 8.5% · 30yr
- Down + closing
- —
- Monthly P&I
- —
- Monthly cashflow
- —
- DSCR
- —
- Eligible?
- —
No personal income docs; deal must DSCR.
Hard money
10% down · 12.0% · 12mo
- Down + closing
- —
- Monthly P&I
- —
- Monthly cashflow
- —
- DSCR
- —
- Eligible?
- —
Short-term bridge; refi at stabilization.
Rent comps 14 comps
| Address | Beds | Baths | Sqft | Rent | $/sqft | DOM | Units | Dist |
|---|---|---|---|---|---|---|---|---|
| 5764 Deer Ridge Dr Southaven, MS | 4.0 | 2.0 | 1665 | $2,060 | $1.24 | 2d | 1 | 0.15mi |
| 5678 Kuykendall Dr Southaven, MS | 4.0 | 2.0 | 2244 | $2,285 | $1.02 | 4d | 1 | 0.23mi |
| 5683 Antler Trl Southaven, MS | 3.0 | 2.0 | 1794 | $2,015 | $1.12 | 4d | 1 | 0.25mi |
| 2777 Rutherford Dr Southaven, MS | 4.0 | 2.0 | 2320 | $2,200 | $0.95 | 4d | 1 | 0.25mi |
| 6656 Belltower Pl Southaven, MS | 3.0 | 3.0 | 2126 | $4,400 | $2.07 | 43d | 1 | 0.73mi |
| 4919 Rosebrook Cir E Southaven, MS | 3.0 | 2.0 | 1683 | $2,200 | $1.31 | 43d | 1 | 1.24mi |
| 5935 Telford Dr Southaven, MS | 3.0 | 2.0 | 1724 | $1,800 | $1.04 | 23d | 1 | 1.30mi |
| 5962 Stafford Dr Southaven, MS | 4.0 | 2.0 | 1775 | $2,010 | $1.13 | 4d | 1 | 1.34mi |
| 1116 Warwick Pl Southaven, MS | 4.0 | 2.0 | 1900 | $2,155 | $1.13 | 43d | 1 | 1.43mi |
| 1072 Fredrick Dr Southaven, MS | 3.0 | 2.0 | 1897 | $1,955 | $1.03 | 11d | 1 | 1.47mi |
| 1937 Pecan Meadows Dr Southaven, MS | 3.0 | 2.0 | 2072 | $2,040 | $0.98 | 43d | 1 | 1.48mi |
| 2704 Greencliff Dr Southaven, MS | 4.0 | 2.0 | 2150 | $2,345 | $1.09 | 21d | 1 | 1.48mi |
| 4508 Westminister Cir Southaven, MS | 4.0 | 3.0 | 2204 | $2,165 | $0.98 | 11d | 1 | 1.49mi |
| 2722 Nelle Ln Southaven, MS | 4.0 | 3.0 | 2364 | $2,320 | $0.98 | 2d | 1 | 1.49mi |
Listing history 15 events
-
2026-05-05status Pending 1128-char remark
Show marketing remark (1128 chars)
Just Like New! Built in 2022 -This beautiful home features an open floor plan perfect for entertaining, with four bedrooms, two full bathrooms, a separate dining room, and a spacious kitchen equipped with stainless steel appliances--including the refrigerator in the kitchen and the refrigertor in the garage. The kitchen offers ample counter space and a large island, ideal for family gatherings and everyday living. The primary suite showcases a coffered ceiling and a luxurious en-suite bath with dual vanities, a soaking tub with tile surround, and a separate shower. Additional highlights include extra insulation in the attic and an electrical workbench in the garage. Relax and unwind on the private back patio--perfect for enjoying peaceful mornings or evenings. Located in the desirable DeSoto Central School District near the Snowden Grove area, this home is just minutes from Silo Square, offering a variety of shops, restaurants, and an amphitheater. The property also includes a transferable 10-year structural warranty. Don't miss this opportunity! Schedule your private showing today. This is a short-sale attempt
-
2026-03-20$285,000 Active 1128-char remark
Show marketing remark (1128 chars)
Just Like New! Built in 2022 -This beautiful home features an open floor plan perfect for entertaining, with four bedrooms, two full bathrooms, a separate dining room, and a spacious kitchen equipped with stainless steel appliances--including the refrigerator in the kitchen and the refrigertor in the garage. The kitchen offers ample counter space and a large island, ideal for family gatherings and everyday living. The primary suite showcases a coffered ceiling and a luxurious en-suite bath with dual vanities, a soaking tub with tile surround, and a separate shower. Additional highlights include extra insulation in the attic and an electrical workbench in the garage. Relax and unwind on the private back patio--perfect for enjoying peaceful mornings or evenings. Located in the desirable DeSoto Central School District near the Snowden Grove area, this home is just minutes from Silo Square, offering a variety of shops, restaurants, and an amphitheater. The property also includes a transferable 10-year structural warranty. Don't miss this opportunity! Schedule your private showing today. This is a short-sale attempt
-
2026-03-17historical
-
2026-02-11$325,000 Active
-
2026-01-22historical
-
2025-12-30price $326,000
-
2025-12-18price $329,000
-
2025-12-03price $335,000
-
2025-11-21price $338,500
-
2025-11-04price $342,500
-
2025-10-01$345,000 Active
-
2022-07-29soldstatus Closed
-
2022-05-18status Pending
-
2022-05-03price $323,400
-
2022-04-12$320,400 Active
ⓘ Source: listings_history table (triggers on properties + properties_extension) + one-shot
backfill from property_details.listing_events for pre-trigger history.
Tax reassessment forecast MS · Resets to sale price
- Current annual tax
- $2,476 · $206/mo
- Projected year-2 tax
- $2,476 · $206/mo
- Expected delta
- $0/yr ($0/mo · 0.0%)
ⓘ Screening estimate from a state-policy table — verify with the county assessor before closing.
Climate risk First Street
- Flood 1/10 Low FEMA zone X (unshaded) · 0% chance over 30 yrs
- Wildfire 4/10 Moderate
- Heat 6/10 Major 7 d/yr ≥109°F today · 21 d/yr by 30 yrs out
- Wind 4/10 Moderate 16% chance of damaging wind over 30 yrs
- Air quality 2/10 Low 2 unhealthy d/yr today · 2 by 30 yrs out
Nearby sold comps map
Loading sold comps map…
Walkable amenities ~0.75 mi
Loading nearby amenities…
Taxation est. · year 1
- Rental income
- $29,936
- − Mortgage interest
- −$15,964
- − Property taxes
- −$2,476
- − Insurance
- −$1,425
- − Repairs & maintenance
- −$2,395
- − Management
- −$2,395
- − Depreciation
- −$8,291
- Taxable loss
- −$3,010
- Est. tax savings @ 24.0%
- +$722
- After-tax cash flow
- $2,536/yr
For passive investors: Depreciation is non-cash, so a rental often shows a tax loss while cash-flowing — sheltering income. Rental losses are passive: they offset passive income freely, and up to $25,000/yr can offset ordinary (W-2) income if you actively participate and your MAGI is under $100k (phasing out to $0 by $150k); unused losses carry forward. On sale, claimed depreciation is recaptured at up to 25%, and gains may owe capital-gains tax (a 1031 exchange can defer both). Figures are a year-1 estimate at your 24.0% rate — not tax advice; consult a CPA.
Condition & rehab AI · 12 photos
This 2022-built home is in excellent condition with a good condition score of 80. It features an open floor plan, modern kitchen, and bathrooms. The exterior is well-maintained, and the interior is fresh and clean. The home is move-in ready and would benefit from a fresh coat of paint and some updates to the kitchen appliances to further increase its value.
Value-add opportunities
- Resale paint exterior — enhances curb appeal
- Both install new flooring — improves aesthetics and value
- Both update kitchen appliances — modernizes space and adds value
Renovation cost estimate screening
Value-add ROI direction
- Resale paint exterior — enhances curb appeal ↑
- Both install new flooring — improves aesthetics and value ↑
- Both update kitchen appliances — modernizes space and adds value ↑
ⓘ Cost ranges are severity-bucket heuristics (US national rule-of-thumb). Get contractor quotes + a written scope before underwriting a rehab budget.
Schools (NCES district)
- District
- Desoto County School District
- NCES district ID
- 2801320
- Math proficiency
- 48% ▼ -13.00%
- Reading proficiency
- 42% ▼ -6.00%
- Median HH income
- $59,272
- Composite
- 39.56/100
- National rank
- #3933
- State rank
- #20 of 130 in MS
Livability — Southaven
- Score
- 65/100
- State rank
- #107
- US rank
- #12584
Category grades
Schools grade is shown separately in the Schools card above.
Census & demographics
- Census place
- Southaven, MS
- County
- DeSoto County · 176,513 people
- City population
- 53,755
- Metro
- Memphis, TN-MS-AR
- Population (ZIP)
- 16,436
- Household income
- $116,184
- Rent vs Own
- Severe rent burden
- 44.0
Population outlook (DeSoto County) Hauer SSP2
- Today (2025)
- 203,338 people
- By 2030
- 217,692 · +7.1%
- By 2040
- 245,320 · +20.6%
- By 2050
- 270,133 · +32.8%
- By 2075
- 323,341 · +59.0%
- By 2100
- 348,742 · +71.5%
Race, ethnicity, and origin ACS 2023
- Neighborhood character
- Majority White (60%)
- Race & ethnicity
- White 60% Black 31% Hispanic / Latino 5% Two or more races 4% Asian 3%
- Hispanic origin (detail)
- Mexican 3%
- Common ancestry
- Subsaharan African 2% Italian 2% Serbian 1%
- Foreign-born
- 5% · Canada, China
- Languages at home
- 96% English-only · Spanish 2% Chinese 1% Other Asian/Pacific 1%
Political lean MEDSL · DeSoto
- 2024 margin
- Strong R (+24.1) · D 36.7% · R 60.8% · Other 2.5%
- 2008→2024 swing
- +14.2pp toward D · 2008: -38.2pp · 2024: -24.1pp
- All cycles
- 2024: R+24.1 2020: R+23.9 2016: R+34.8 2012: R+33.5 2008: R+38.2
Not yet ingested
- Civics
- —
Market trends
- HPI YoY
- ▼ -25.90%
- Current HPI
- 172.4771
- Rent YoY
- —
- Metro
- Memphis, TN-MS-AR
- State GDP YoY
- —
- F500 in state
- 0
Price history
-11.0% since first listed15 events — show timeline
- 2026-05-05 Pending — MLSU
- 2026-03-20 Listed $285,000 MLSU
- 2026-03-17 Listing Removed — MLSU
- 2026-02-11 Listed $325,000 MLSU
- 2026-01-22 Listing Removed — MLSU
- 2025-12-30 Price Changed $326,000 MLSU
- 2025-12-18 Price Changed $329,000 MLSU
- 2025-12-03 Price Changed $335,000 MLSU
- 2025-11-21 Price Changed $338,500 MLSU
- 2025-11-04 Price Changed $342,500 MLSU
- 2025-10-01 Listed $345,000 MLSU
- 2022-07-29 Sold (MLS) — MLSU
- 2022-05-18 Pending — MLSU
- 2022-05-03 Price Changed $323,400 MLSU
- 2022-04-12 Listed $320,400 MLSU
Property tax history
+53.5%/yrLatest (2025): $2,476 · +17.2% YoY. Source: county tax records.
Cash-flow waterfall
monthlySold comps — $/sqft
last 12 mo · ≤1 miLoading sold comps…