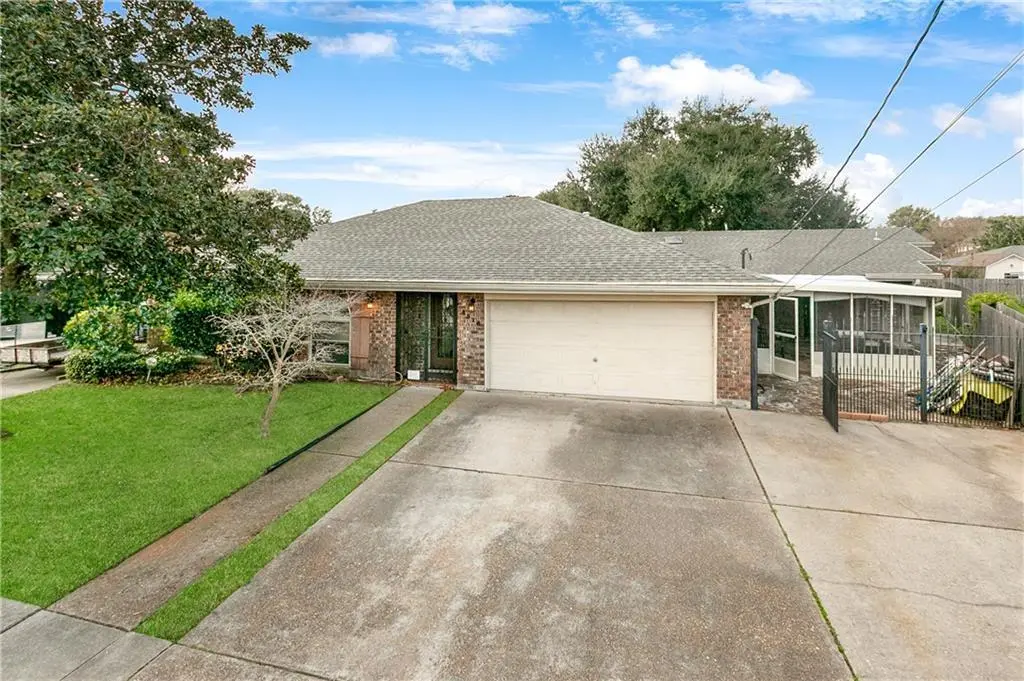
4516 Lefkoe St · Metairie, LA
Flood risk 8/10 · Major
- FEMA flood zone
- X (shaded)
- Chance of flooding over 30 yrs
- 0.6%
- Est. flood insurance / yr
- $507 – $1,088
Fire risk 1/10 · Minimal
- Est. fire insurance / yr
- $1,269 – $2,357
Heat risk 10/10 · Severe
- Hot days now (above 108°F)
- 7 days/yr
- Hot days in 30 yrs
- 21 days/yr
Wind risk 10/10 · Severe
- Chance of severe wind over 30 yrs
- 99.0%
Air-quality risk 3/10 · Minor
- Unhealthy air days now
- 2 days/yr
- Unhealthy air days in 30 yrs
- 3 days/yr
Risk factors via First Street. Map © Google.
Why this score? — see what drove the C- grade
The composite is a weighted blend of 9 inputs, each scored 0–100. Each bar is that input's sub-score; the figure is the points it added to the 100-point composite (weight × sub-score).
- Cash flow +16.4/30.0
- ARV discount +15.0/15.0
- DSCR +5.1/10.0
- Livability +4.4/5.0
- 1% rule +4.2/10.0
- Rent growth +2.5/5.0
- Schools +2.5/10.0
- Condition / age +2.5/5.0
- Appreciation +0.0/10.0
$373,000
🖨 Deal sheet 📄 Offer letter ✓ Due diligence
Listing remarks MLS
Great opportunity in Metairie. VA assumption option available. This property has a full mother in law attached to main house. This can be great for ancillary income or just extra space or income- Mother in law has full kitchen , living area and bedroom and bath, separate entry and covered patio. Main house has fireplace and 3 bedrooms and 2 baths with large open living area.
Key facts
- Full kitchen
- Covered patio
- Separate entry
Tags
Neighborhood map
What this means for you Summary
Snapshot
- This is a 4-bed/3.0-bath single-family listed at $373k.
Deal economics
- At list price, monthly cash flow is $148 ($2k/yr) — positive.
- The deal already cash-flows at list — no discount required.
- To meet the 1% rule (rent ≥ 1% of price), the offer needs to be $342k (8.3% below list).
- Recommended offer: $328k (12.0% below list) — sets the bar for market timing.
- Cap rate 7.0% vs local median 3.6% in Metairie — top-decile yield for the area; either an underpriced asset or a hidden risk that comps aren't pricing in. Stress-test before assuming the spread holds.
Location & tenants
- Location reads 87/100 on livability (#1 in LA, #261 nationally) — a professional / high-income tenant draw. Strengths: commute A+, housing A+, health & safety A+.
- Jefferson Parish (suburban): math 24% / reading 34% proficiency, ranked #44 of 98 in LA (top 45%) — low school quality limits family demand, transient renter base, plan for 1-2y turnover; 70% free/reduced lunch — lower-income household profile, screen leases tightly.
- Market conditions: 76 active listings in the ZIP; 9 comparable units currently listed for rent nearby; rentals at typical pace (median 24d on market — plan ~3-4 weeks tenant-placement turnaround); solid renter incomes; 518 units permitted in Jefferson Parish in 2024 (43 in 5+ unit buildings).
- At $3,419/mo this rent would consume 54% of the median local household income ($77k/yr) (locally 590% of renters already pay >50% of income on rent) — very limited rent-growth headroom before tenants either downsize or default.
Forward outlook
- Local home prices are declining (-3.0%/yr); year-one equity from $3k of loan paydown is wiped out by about $11k of value loss. Plan a longer hold.
Negotiation context
- It's been on market 128 days — a 12% lower offer ($328k) is reasonable based on typical stale-listing flexibility.
- 4 sale attempts since 4y ago with the ask held roughly flat each time — persistent listings suggest the price (not the market) is what's stuck; bring a comps-based counter.
Risks & watch-outs
- Watch-outs: flood insurance adds $66/mo.
- Climate carrying-cost: severe flood risk; severe wind risk, 99% chance of damaging wind over 30y; extreme-heat days projected 7→21/yr by 2055 (HVAC capex compounding) — expect insurance premiums to compound above CPI over the hold.
Questions for the listing agent
- It's been on market 128 days. Have you received any prior offers? Is the seller open to a 12% concession, seller financing, or rate buy-down credit?
- Built in 1979 — when were the roof, HVAC, electrical panel, plumbing, and water heater last replaced?
- What's the actual annual flood-insurance premium (NFIP or private), and is the property in a SFHA with mandatory coverage?
- Why hasn't it sold? Are there any deal-killer items the seller is aware of (foundation, flood, title, zoning, code violations)?
- Is there a deadline driving the sale (1031 exchange, divorce, estate, relocation)? That informs how much negotiation room exists.
- Schools are B-rated — typically a magnet for longer-tenancy family renters. What's the average tenant stay here, and is there a school-zone premium baked into asking?
- What's the average days-on-market for RENTAL listings here right now (not sales)? A rising rental-DOM trend means longer vacancies and softer asking-rent achievability than the comps imply.
- What's the recent tenant-quality profile in this submarket — average credit score on applications, eviction rate, late-payment / NSF rate, and stable-employment percentage? A property-management company in the area should have these aggregated.
- How much new for-sale + rental construction is in the pipeline within 1–3 miles? Heavy new supply typically softens prices + rents 12–24 months out; constrained supply supports both.
Investment metrics
- 1% rule
- 0.92% ✗
- Cap rate
- 6.98%
- Cash-on-cash
- 2.47%
- DSCR
- 1.11
- GRM
- 9.1
CMA / ARV
- ARV (median comp)
- $477,742
- List price
- $373,000
- Delta
- -21.92%
- Verdict
- UNDERPRICED
- Comps
- 20 within 1.0 mi
Show comp detail 12 sales within ~0.75 mi
| Address | Dist | Beds/Ba | Sqft | Sold | Price | $/sf | Match |
|---|---|---|---|---|---|---|---|
| 4909 Sunny Pl | 0.35mi | 4/3.0 | 3,159 (-0%) | 6mo | $358,000 | $113 | 77 |
| 4800 Avron Blvd | 0.28mi | 4/2.5 | 3,009 (-5%) | 3mo | $582,500 | $194 | 74 |
| 4917 Belle Dr | 0.36mi | 4/2.5 | 2,970 (-6%) | 1mo | $445,000 | $150 | 69 |
| 4536 Alphonse Dr | 0.27mi | 4/3.0 | 2,830 (-11%) | 8mo | $420,000 | $148 | 63 |
| 4524 Folse Dr | 0.37mi | 3/2.5 (-1) | 2,997 (-6%) | 5mo | $565,000 | $189 | 62 |
| 4908 Avron Blvd | 0.46mi | 3/2.5 (-1) | 2,889 (-9%) | 2mo | $580,000 | $201 | 55 |
| 4808 Jasper St | 0.52mi | 5/4.0 (+1) | 3,047 (-4%) | 6mo | $455,000 | $149 | 55 |
| 4917 Lake Vista Dr | 0.47mi | 4/2.5 | 2,810 (-12%) | 3mo | $665,000 | $237 | 54 |
| 4508 Kawanee Ave | 0.74mi | 5/3.5 (+1) | 3,328 (+5%) | 1mo | $324,000 | $97 | 50 |
| 5028 Ithaca St | 0.60mi | 5/3.0 (+1) | 2,839 (-11%) | 2mo | $195,500 | $69 | 47 |
| 5124 Belle Dr | 0.65mi | 5/3.0 (+1) | 3,470 (+9%) | 9mo | $540,000 | $156 | 42 |
| 4344 Folse Dr | 0.48mi | 5/3.0 (+1) | 3,650 (+15%) | 8mo | $427,000 | $117 | 41 |
Match score weights: distance 35% · size 25% · config 20% · recency 20%. Top-matched comps best support the ARV.
Projected returns pro-forma
-3.0% appreciation · 3.0% rent growth · sell at horizon
- IRR
- -13.6%
- Equity multiple
- 0.51×
- Total profit
- $-50,963
- Equity at exit
- $55,616
- IRR
- -4.7%
- Equity multiple
- 0.69×
- Total profit
- $-32,072
- Equity at exit
- $32,250
Cash invested: $104,440 (down + closing). Projections, not guarantees.
Landlord ↔ Tenant lean methodology
- Overall (STATE)
- 90 Strongly Landlord-Friendly
- State Louisiana
- 90 Strongly Landlord-Friendly · R+12
- County
- — inherits STATE
- City
- — inherits STATE
ZIP-level market 70006
- Active inventory
- 76
- Price-to-rent
- 9.1×
Monthly cashflow live
- Estimated rent
- $3,419 high interval (Pro) →
- Mortgage (P&I)
- −$1,956
- Tax from tax record
- −$375 /mo · $4,496/yr
- Insurance
- −$155
- Flood insurance flood zone
- −$66 /mo · $798/yr
- HOA
- −$0
- Vacancy / Maint / Mgmt
- −$718
- Net cashflow
- $148
Break-even live
UW: 25.0% down · 7.5% · 30yr · 1.5% tax · 5.0% vac · 8.0% maint · 8.0% mgmt
Financing live
Cash to close
- Down payment
- $93,250
- Closing costs
- $11,190
- Reserves months
- —
- Total cash needed
- —
Loan-product check · same deal, 3 products live
Conventional
25% down · 7.5% · 30yr
- Down + closing
- —
- Monthly P&I
- —
- Monthly cashflow
- —
- DSCR
- —
- Eligible?
- —
Personal DTI + credit; lowest rate.
DSCR
20% down · 8.5% · 30yr
- Down + closing
- —
- Monthly P&I
- —
- Monthly cashflow
- —
- DSCR
- —
- Eligible?
- —
No personal income docs; deal must DSCR.
Hard money
10% down · 12.0% · 12mo
- Down + closing
- —
- Monthly P&I
- —
- Monthly cashflow
- —
- DSCR
- —
- Eligible?
- —
Short-term bridge; refi at stabilization.
Rent comps 9 comps
| Address | Beds | Baths | Sqft | Rent | $/sqft | DOM | Units | Dist |
|---|---|---|---|---|---|---|---|---|
| 4824 W Esplanade Ave Metairie, LA | 4.0 | 3.5 | 3221 | $6,300 | $1.96 | 43d | 1 | 0.28mi |
| 4405 Laplace St Metairie, LA | 4.0 | 2.5 | 2686 | $2,800 | $1.04 | 4d | 1 | 0.38mi |
| 4444 W Esplanade Ave Metairie, LA | 4.0 | 2.0 | 2226 | $2,600 | $1.17 | 14d | 1 | 0.40mi |
| 4908 Mayeaux St Metairie, LA | 4.0 | 2.5 | 3029 | $3,400 | $1.12 | 43d | 1 | 0.40mi |
| 4824 Folse Dr Metairie, LA | 5.0 | 4.5 | 3707 | $3,900 | $1.05 | 43d | 1 | 0.44mi |
| 4632 Ithaca St Metairie, LA | 4.0 | 2.5 | 2860 | $2,600 | $0.91 | 23d | 1 | 0.49mi |
| 3816 Lemon St Metairie, LA | 3.0 | 2.0 | 2200 | $2,500 | $1.14 | 23d | 1 | 0.56mi |
| 5029 Loveland St Metairie, LA | 3.0 | 2.0 | 2100 | $2,500 | $1.19 | 4d | 1 | 0.73mi |
| 4808 Neyrey Dr Metairie, LA | 5.0 | 3.5 | 3992 | $4,500 | $1.13 | 14d | 1 | 1.35mi |
Listing history 25 events
-
2026-06-18days on market $373,000 Active 128 DOM
-
2026-06-17days on market $373,000 Active 127 DOM
-
2026-06-16days on market $373,000 Active 126 DOM
-
2026-06-15days on market $373,000 Active 125 DOM
-
2026-06-13days on market $373,000 Active 123 DOM
-
2026-06-10days on market $373,000 Active 120 DOM
-
2026-06-09days on market $373,000 Active 119 DOM
-
2026-06-08days on market $373,000 Active 118 DOM
-
2026-06-07days on market $373,000 Active 117 DOM
-
2026-06-03days on market $373,000 Active 113 DOM
-
2026-06-02days on market $373,000 Active 112 DOM
-
2026-06-01days on market $373,000 Active 111 DOM
-
2026-05-31days on market $373,000 Active 110 DOM
-
2026-02-10$373,000 Active 377-char remark
Show marketing remark (377 chars)
Great opportunity in Metairie. VA assumption option available. This property has a full mother in law attached to main house. This can be great for ancillary income or just extra space or income- Mother in law has full kitchen , living area and bedroom and bath, separate entry and covered patio. Main house has fireplace and 3 bedrooms and 2 baths with large open living area.
-
2023-02-23soldstatus $375,000
-
2023-02-15soldstatus $375,000 Closed
-
2023-01-18historical Active Under Contract
-
2022-11-16price $399,000
-
2022-11-04price $425,000
-
2022-10-15price $450,000
-
2022-10-06price $465,000
-
2022-08-24$475,000 Active
-
2022-08-24$399,000
-
1979-03-01soldstatus $90,000
ⓘ Source: listings_history table (triggers on properties + properties_extension) + one-shot
backfill from property_details.listing_events for pre-trigger history.
Tax reassessment forecast LA · Resets to sale price
- Current annual tax
- $4,496 · $375/mo
- Projected year-2 tax
- $4,496 · $375/mo
- Expected delta
- $0/yr ($0/mo · 0.0%)
ⓘ Screening estimate from a state-policy table — verify with the county assessor before closing.
Climate risk First Street
- Flood 8/10 Severe FEMA zone X (shaded) · 60% chance over 30 yrs
- Wildfire 1/10 Low
- Heat 10/10 Extreme 7 d/yr ≥108°F today · 21 d/yr by 30 yrs out
- Wind 10/10 Extreme 99% chance of damaging wind over 30 yrs
- Air quality 3/10 Moderate 2 unhealthy d/yr today · 3 by 30 yrs out
Nearby sold comps map
Loading sold comps map…
Walkable amenities ~0.75 mi
Loading nearby amenities…
Taxation est. · year 1
- Rental income
- $41,025
- − Mortgage interest
- −$20,894
- − Property taxes
- −$4,496
- − Insurance
- −$2,662
- − Repairs & maintenance
- −$3,282
- − Management
- −$3,282
- − Depreciation
- −$10,851
- Taxable loss
- −$4,442
- Est. tax savings @ 24.0%
- +$1,066
- After-tax cash flow
- $2,845/yr
For passive investors: Depreciation is non-cash, so a rental often shows a tax loss while cash-flowing — sheltering income. Rental losses are passive: they offset passive income freely, and up to $25,000/yr can offset ordinary (W-2) income if you actively participate and your MAGI is under $100k (phasing out to $0 by $150k); unused losses carry forward. On sale, claimed depreciation is recaptured at up to 25%, and gains may owe capital-gains tax (a 1031 exchange can defer both). Figures are a year-1 estimate at your 24.0% rate — not tax advice; consult a CPA.
Schools (NCES district)
- District
- Jefferson Parish
- NCES district ID
- 2200840
- Math proficiency
- 24% ▼ -36.00%
- Reading proficiency
- 34% ▼ -30.00%
- Median HH income
- $48,421
- Composite
- 25.19/100
- National rank
- #7511
- State rank
- #44 of 98 in LA
Livability — Metairie
- Score
- 87/100
- State rank
- #1
- US rank
- #261
Category grades
Schools grade is shown separately in the Schools card above.
Census & demographics
- Census place
- Metairie, LA
- County
- Jefferson Parish · 426,999 people
- City population
- 137,978
- Metro
- New Orleans-Metairie, LA
- Population (ZIP)
- 16,170
- Household income
- $76,505
- Rent vs Own
- Severe rent burden
- 590.0
Population outlook (Jefferson County) Hauer SSP2
- Today (2025)
- 451,696 people
- By 2030
- 455,451 · +0.8%
- By 2040
- 458,308 · +1.5%
- By 2050
- 461,031 · +2.1%
- By 2075
- 476,351 · +5.5%
- By 2100
- 499,377 · +10.6%
Race, ethnicity, and origin ACS 2023
- Neighborhood character
- Diverse neighborhood (Simpson 0.63)
- Race & ethnicity
- White 54% Hispanic / Latino 26% Two or more races 18% Black 9% Asian 6% Native American 3%
- Hispanic origin (detail)
- Mexican 2% Cuban 1%
- Common ancestry
- Lithuanian 11% Armenian 2% Italian 1%
- Foreign-born
- 24% · Canada, China, Vietnam
- Languages at home
- 65% English-only · Spanish 20% Arabic 6% Other Indo-European 4%
Political lean MEDSL · Jefferson
- 2024 margin
- R (+12.9) · D 42.5% · R 55.5% · Other 2.1%
- 2008→2024 swing
- +13.6pp toward D · 2008: -26.6pp · 2024: -12.9pp
- All cycles
- 2024: R+12.9 2020: R+11.1 2016: R+14.8 2012: R+18.4 2008: R+26.6
Not yet ingested
- Civics
- —
Market trends
- HPI YoY
- ▼ -162.73%
- Current HPI
- 184.7849
- Rent YoY
- —
- Metro
- New Orleans-Metairie, LA
- State GDP YoY
- ▲ 3.29%
- F500 in state
- 10
Industry mix (Fortune 500 HQ in LA)
| Industry | F500 HQs | Revenue |
|---|---|---|
| Telecommunications | 2 | $23B |
|
||
| Utilities | 1 | $12B |
|
||
| Wholesale / Distribution | 1 | $5B |
|
||
| Advertising | 1 | $2B |
|
||
Price history
+314.4% since first listed12 events — show timeline
- 2026-02-10 Listed $373,000 GSREIN
- 2026-02-10 Listed $373,000 AcadianaMLS
- 2023-02-23 Sold (Public Records) $375,000 Public Records
- 2023-02-15 Sold (MLS) $375,000 GSREIN
- 2023-01-18 Contingent — GSREIN
- 2022-11-16 Price Changed $399,000 GSREIN
- 2022-11-04 Price Changed $425,000 GSREIN
- 2022-10-15 Price Changed $450,000 GSREIN
- 2022-10-06 Price Changed $465,000 GSREIN
- 2022-08-24 Listed $399,000 AcadianaMLS
- 2022-08-24 Listed $475,000 GSREIN
- 1979-03-01 Sold (Public Records) $90,000 Public Records
Property tax history
+9.5%/yrLatest (2025): $4,496 · +0.2% YoY. Source: county tax records.
Cash-flow waterfall
monthlySold comps — $/sqft
last 12 mo · ≤1 miLoading sold comps…