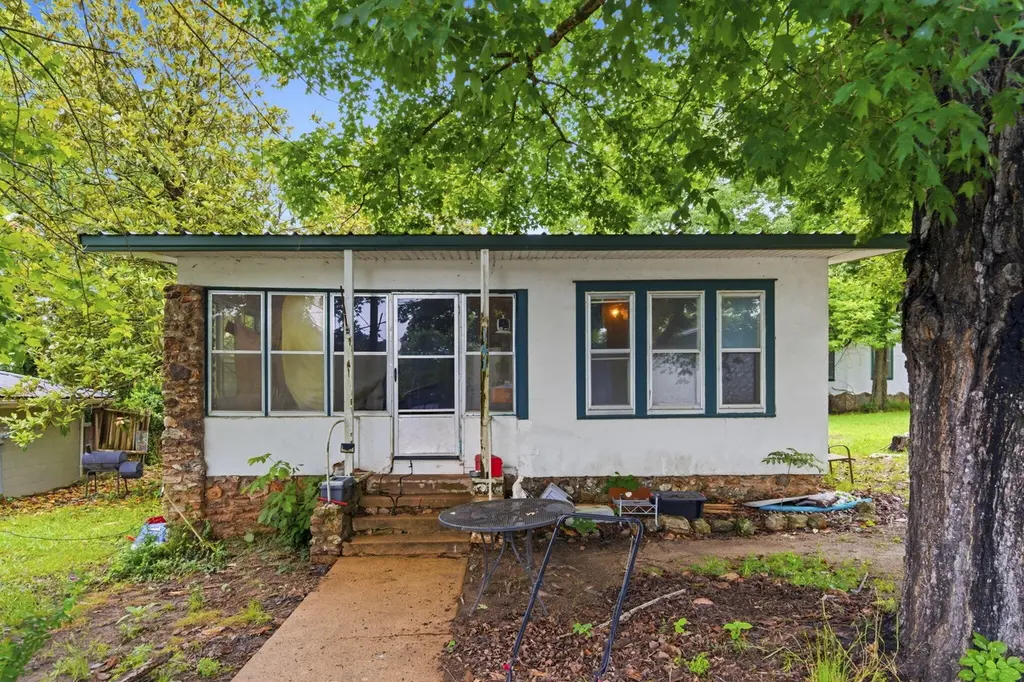
141 Wildflower Ave · Rockaway Beach, MO
Flood risk 1/10 · Minimal
- FEMA flood zone
- X (unshaded)
- Chance of flooding over 30 yrs
- 0.0%
- Est. flood insurance / yr
- $507 – $1,088
Fire risk 3/10 · Minor
- Est. fire insurance / yr
- $1,054 – $1,958
Heat risk 5/10 · Moderate
- Hot days now (above 106°F)
- 7 days/yr
- Hot days in 30 yrs
- 21 days/yr
Wind risk 2/10 · Minimal
- Chance of severe wind over 30 yrs
- 1.0%
Air-quality risk 2/10 · Minimal
- Unhealthy air days now
- 0 days/yr
- Unhealthy air days in 30 yrs
- 1 days/yr
Risk factors via First Street. Map © Google.
Why this score? — see what drove the B+ grade
The composite is a weighted blend of 9 inputs, each scored 0–100. Each bar is that input's sub-score; the figure is the points it added to the 100-point composite (weight × sub-score).
- Cash flow +30.0/30.0
- 1% rule +10.0/10.0
- DSCR +10.0/10.0
- Appreciation +10.0/10.0
- ARV discount +7.5/15.0
- Schools +4.2/10.0
- Livability +3.1/5.0
- Rent growth +2.5/5.0
- Condition / age +2.5/5.0
$95,000
🖨 Deal sheet (PDF) 📄 Offer letter ✓ Due diligence
Listing remarks MLS
Potential is Endless. Great Vacation/Fishing Home or make it your permanent residence. This is a 3 bedroom 1 bath home just 1/2 block from Lake Taneycomo and Rockaway Beach Waterfront. Comes with Stove, Refrigerator and Stackable washer/dryer. Some remodeling has been done but there is opportunity to add your flair and make it your own. Second building has been used as a Storage Shed but could be converted back to a second home for potential income. Lakeview is from the front porch.
Key facts
- Scenic lake views
- Double lot
- Lake area
Tags
Property features AI
Exterior
- Parking: Driveway
- Utilities: Public water; Public sewer; Cable available
- Home design: Single-family residence; One-story
- Construction: Composition roof
- Exterior features: Garden; Lake view
Interior
- Bedrooms: Bedrooms located on one level
- Bathrooms: 1 full bathroom
- Heating & cooling: Electric central heating; Central air
- Interior features: Ceiling fans; Central air
- Laundry & utility: Main-level laundry
Neighborhood map
What this means for you Summary
Snapshot
- This is a 3-bed/1.0-bath other listed at $95k.
Deal economics
- At list price, monthly cash flow is $581 ($7k/yr) — positive.
- The deal already cash-flows at list — no discount required.
- Meets the 1% rule at list price ($1k rent vs $95k).
- Cap rate 13.6% vs local median 2.5% in Rockaway Beach — top-decile yield for the area; either an underpriced asset or a hidden risk that comps aren't pricing in. Stress-test before assuming the spread holds.
Location & tenants
- Location reads 61/100 on livability (#418 in MO) — a middle-class / working-renter tenant base. Strengths: cost of living A+, housing A-; Watch: health & safety C-, employment D+, crime F.
- Branson R-IV (rural): math 48% / reading 52% proficiency, ranked #44 of 324 in MO (top 14%) — acceptable for families but not a draw, mixed tenant base, ~2y average lease.
- Zoned schools: Buchanan Elementary (math 62% / reading 67%, grade B, #70 of 1,115 statewide, top 8%, 594 students, 54% FRL); Branson Jr. High (math 48% / reading 49%, grade C-, #81 of 391 statewide, top 21%, 724 students, 51% FRL); Branson High (math 42% / reading 56%, grade D, #145 of 521 statewide, top 28%, 1,423 students, 46% FRL) — zoned schools at 50% FRL track the district average.
- Market conditions: 99 active listings in the ZIP; 331 units permitted in Taney County in 2024 (50 in 5+ unit buildings).
Forward outlook
- In year one you build about $10k of equity ($657 loan paydown + $10k appreciation (10.0% local appreciation)).
- Taney County population projected at +17% by 2050 — long-run rental-demand tailwind backs the buy-and-hold thesis.
- At projected returns (10.0% appreciation + 3.0% rent growth), your $27k cash investment doubles in ~2 years — after that, you're playing with house money.
- By year 4, paydown + projected appreciation supports a ~$36k cash-out refi (75% LTV) — recoverable capital for the next deal without selling this one.
Negotiation context
- Only 1 days on market — expect competitive offers; lowballing is unlikely to land.
- 2 sale attempts since 7y ago with the ask held roughly flat each time — persistent listings suggest the price (not the market) is what's stuck; bring a comps-based counter.
Risks & watch-outs
- Watch-outs: built in 1933 — expect roof / HVAC / electrical / plumbing capex.
- Climate carrying-cost: extreme-heat days projected 7→21/yr by 2055 (HVAC capex compounding) — expect insurance premiums to compound above CPI over the hold.
Questions for the listing agent
- Built in 1933 — when were the roof, HVAC, electrical panel, plumbing, and water heater last replaced?
- Is there a deadline driving the sale (1031 exchange, divorce, estate, relocation)? That informs how much negotiation room exists.
- Schools are F-rated, which usually means shorter tenancies and higher turnover. Who's the typical renter profile here, and what's been the actual vacancy rate?
- Crime grade is F in this area — have there been break-ins, vandalism, or insurance claims at this property in the last 3 years? What carrier currently insures it and at what premium?
- What's the average days-on-market for RENTAL listings here right now (not sales)? A rising rental-DOM trend means longer vacancies and softer asking-rent achievability than the comps imply.
- What's the recent tenant-quality profile in this submarket — average credit score on applications, eviction rate, late-payment / NSF rate, and stable-employment percentage? A property-management company in the area should have these aggregated.
- How much new for-sale + rental construction is in the pipeline within 1–3 miles? Heavy new supply typically softens prices + rents 12–24 months out; constrained supply supports both.
Investment metrics
- 1% rule
- 1.53% ✓
- Cap rate
- 13.63%
- Cash-on-cash
- 26.21%
- DSCR
- 2.17
- GRM
- 5.4
CMA / ARV
No comps found within radius.
Projected returns pro-forma
10.0% appreciation · 3.0% rent growth · sell at horizon
- IRR
- 44.0%
- Equity multiple
- 4.33×
- Total profit
- $88,704
- Equity at exit
- $85,584
- IRR
- 38.1%
- Equity multiple
- 9.72×
- Total profit
- $232,061
- Equity at exit
- $184,564
Cash invested: $26,600 (down + closing). Projections, not guarantees.
Landlord ↔ Tenant lean methodology
- Overall (STATE)
- 81 Strongly Landlord-Friendly
- State Missouri
- 81 Strongly Landlord-Friendly · R+10
- County
- — inherits STATE
- City
- — inherits STATE
ZIP-level market 65740
- Home prices YoY
- 11.6%
- Active inventory
- 99
- Price-to-rent
- 5.4×
Monthly cashflow live
- Estimated rent
- $1,454 medium interval (Pro) →
- Mortgage (P&I)
- −$498
- Tax from tax record
- −$30 /mo · $363/yr
- Insurance
- −$40
- HOA
- −$0
- Vacancy / Maint / Mgmt
- −$305
- Net cashflow
- $581
Break-even live
Sensitivity live
| Price | -10% $635 | -5% $608 | +0% $581 | +5% $554 | +10% $527 |
|---|---|---|---|---|---|
| Rent | -10% $466 | -5% $523 | +0% $581 | +5% $638 | +10% $696 |
| Rate | -1.0pp $629 | -0.5pp $605 | base $581 | +0.5pp $556 | +1.0pp $531 |
UW: 25.0% down · 7.5% · 30yr · 1.5% tax · 5.0% vac · 8.0% maint · 8.0% mgmt
Financing live
Cash to close
- Down payment
- $23,750
- Closing costs
- $2,850
- Reserves months
- —
- Total cash needed
- —
Loan-product check · same deal, 3 products live
Conventional
25% down · 7.5% · 30yr
- Down + closing
- —
- Monthly P&I
- —
- Monthly cashflow
- —
- DSCR
- —
- Eligible?
- —
Personal DTI + credit; lowest rate.
DSCR
20% down · 8.5% · 30yr
- Down + closing
- —
- Monthly P&I
- —
- Monthly cashflow
- —
- DSCR
- —
- Eligible?
- —
No personal income docs; deal must DSCR.
Hard money
10% down · 12.0% · 12mo
- Down + closing
- —
- Monthly P&I
- —
- Monthly cashflow
- —
- DSCR
- —
- Eligible?
- —
Short-term bridge; refi at stabilization.
Listing history 8 events
-
2026-06-21days on market $95,000 Active 1 DOM
-
2026-06-12days on market $95,000 Active 11 DOM
-
2026-06-09days on market $95,000 Active 8 DOM
-
2026-06-08days on market $95,000 Active 7 DOM
-
2026-06-07days on market $95,000 Active 6 DOM
-
2026-06-03days on market $95,000 Active 2 DOM
-
2026-06-01remarks 629-char remark
-
2026-06-01$95,000 Active 1 DOM
ⓘ Source: listings_history table (triggers on properties + properties_extension) + one-shot
backfill from property_details.listing_events for pre-trigger history.
Tax reassessment forecast MO · Resets to sale price
- Current annual tax
- $363 · $30/mo
- Projected year-2 tax
- $922 · $77/mo
- Expected delta
- +$559/yr (+$47/mo · 153.9%)
ⓘ Screening estimate from a state-policy table — verify with the county assessor before closing.
Climate risk First Street
- Flood 1/10 Low FEMA zone X (unshaded) · 0% chance over 30 yrs
- Wildfire 3/10 Moderate
- Heat 5/10 Major 7 d/yr ≥106°F today · 21 d/yr by 30 yrs out
- Wind 2/10 Low 100% chance of damaging wind over 30 yrs
- Air quality 2/10 Low 0 unhealthy d/yr today · 1 by 30 yrs out
Nearby sold comps map
Loading sold comps map…
Walkable amenities ~0.75 mi
Loading nearby amenities…
Taxation est. · year 1
- Rental income
- $17,452
- − Mortgage interest
- −$5,321
- − Property taxes
- −$363
- − Insurance
- −$475
- − Repairs & maintenance
- −$1,396
- − Management
- −$1,396
- − Depreciation
- −$2,764
- Taxable income
- $5,736
- Est. tax owed @ 24.0%
- −$1,377
- After-tax cash flow
- $5,594/yr
For passive investors: Depreciation is non-cash, so a rental often shows a tax loss while cash-flowing — sheltering income. Rental losses are passive: they offset passive income freely, and up to $25,000/yr can offset ordinary (W-2) income if you actively participate and your MAGI is under $100k (phasing out to $0 by $150k); unused losses carry forward. On sale, claimed depreciation is recaptured at up to 25%, and gains may owe capital-gains tax (a 1031 exchange can defer both). Figures are a year-1 estimate at your 24.0% rate — not tax advice; consult a CPA.
Schools (NCES district)
- District
- Branson R-IV
- NCES district ID
- 2905760
- Math proficiency
- 48% ▼ -6.00%
- Reading proficiency
- 52% ▼ -3.00%
- Median HH income
- $41,473
- Composite
- 41.96/100
- National rank
- #3347
- State rank
- #44 of 324 in MO
Livability — Rockaway Beach
- Score
- 61/100
- State rank
- #418
- US rank
- #17451
Category grades
Schools grade is shown separately in the Schools card above.
Census & demographics
- Census place
- Rockaway Beach, MO
- City population
- 3,495
- Population (ZIP)
- 3,495
Population outlook (Taney County) Hauer SSP2
- Today (2025)
- 59,017 people
- By 2030
- 61,235 · +3.8%
- By 2040
- 65,225 · +10.5%
- By 2050
- 68,842 · +16.6%
- By 2075
- 77,705 · +31.7%
- By 2100
- 82,002 · +38.9%
Race, ethnicity, and origin ACS 2023
- Neighborhood character
- Predominantly White (85%)
- Race & ethnicity
- White 85% Hispanic / Latino 9% Two or more races 8% Black 2%
- Hispanic origin (detail)
- Mexican 6%
- Common ancestry
- Slovak 3% Iranian 3% Lithuanian 1%
- Foreign-born
- 1% · Canada
- Languages at home
- 93% English-only · Spanish 6% German/W. Germanic 1%
Political lean MEDSL · Taney
- 2024 margin
- Solid R (+59.3) · D 19.9% · R 79.2%
- 2008→2024 swing
- -22.2pp toward R · 2008: -37.2pp · 2024: -59.3pp
- All cycles
- 2024: R+59.3 2020: R+57.7 2016: R+59.3 2012: R+47.4 2008: R+37.2
Not yet ingested
- Civics
- —
Market trends
- HPI YoY
- ▲ 30.18%
- Current HPI
- 291.5553
- Rent YoY
- —
- Metro
- —
- State GDP YoY
- ▲ 1.84%
- F500 in state
- 20
Industry mix (Fortune 500 HQ in MO)
| Industry | F500 HQs | Revenue |
|---|---|---|
| Healthcare | 1 | $163B |
|
||
| Insurance | 1 | $21B |
|
||
| Industrial Technology | 1 | $17B |
|
||
| Retail | 1 | $16B |
|
||
| Industrial Distribution | 1 | $10B |
|
||
| Utilities | 1 | $9B |
|
||
Price history
+58.3% since first listed7 events — show timeline
- 2026-06-01 Listed $95,000 SOMO
- 2019-06-17 Sold (Public Records) — Public Records
- 2019-06-14 Sold (MLS) — SOMO
- 2019-04-28 Listed $60,000 SOMO
- 2006-12-07 Sold (Public Records) — Public Records
- 2003-06-02 Sold (Public Records) — Public Records
- 2000-08-04 Sold (Public Records) — Public Records
Property tax history
+2.9%/yrLatest (2025): $363 · -10.1% YoY. Source: county tax records.
Cash-flow waterfall
monthlySold comps — $/sqft
last 12 mo · ≤1 miLoading sold comps…