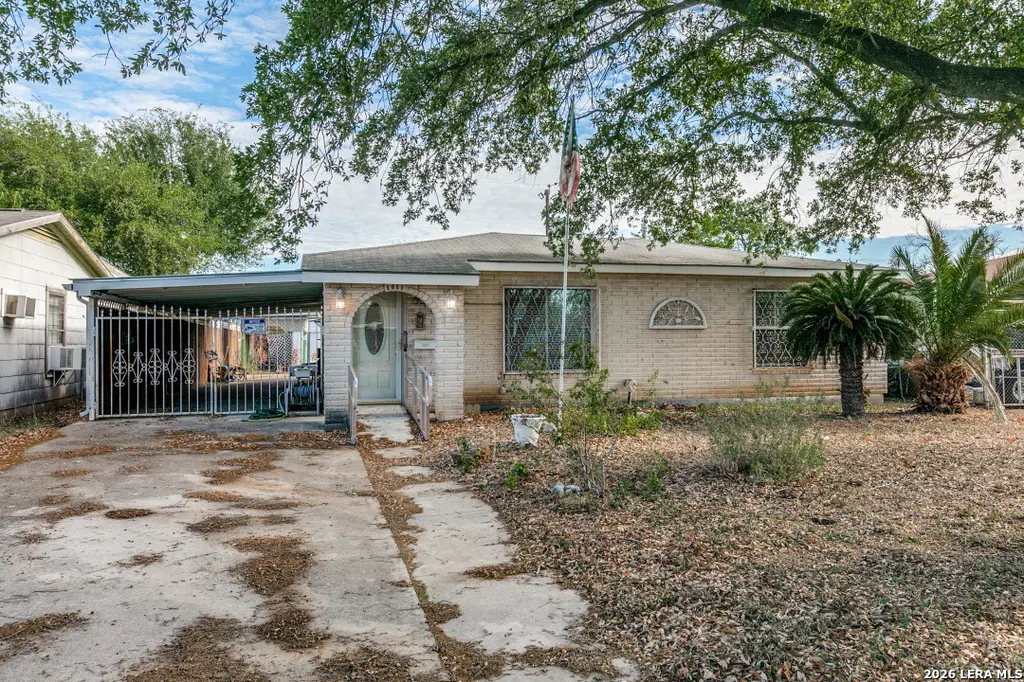
1911 Beechaven Dr · San Antonio, TX
Flood risk 3/10 · Minor
- FEMA flood zone
- X (unshaded)
- Chance of flooding over 30 yrs
- 0.2%
- Est. flood insurance / yr
- $507 – $1,088
Fire risk 1/10 · Minimal
- Est. fire insurance / yr
- $1,222 – $2,270
Heat risk 8/10 · Major
- Hot days now (above 109°F)
- 7 days/yr
- Hot days in 30 yrs
- 22 days/yr
Wind risk 7/10 · Major
- Chance of severe wind over 30 yrs
- 78.0%
Air-quality risk 2/10 · Minimal
- Unhealthy air days now
- 1 days/yr
- Unhealthy air days in 30 yrs
- 2 days/yr
Risk factors via First Street. Map © Google.
Why this score? — see what drove the C grade
The composite is a weighted blend of 9 inputs, each scored 0–100. Each bar is that input's sub-score; the figure is the points it added to the 100-point composite (weight × sub-score).
- ARV discount +14.1/15.0
- Cash flow +13.5/30.0
- Appreciation +10.0/10.0
- 1% rule +4.7/10.0
- Rent growth +4.4/5.0
- DSCR +4.1/10.0
- Livability +4.0/5.0
- Condition / age +2.5/5.0
- Schools +1.4/10.0
$130,000
🖨 Deal sheet (PDF) 📄 Offer letter ✓ Due diligence
Listing remarks MLS
Welcome to this charming 3bedroom, 1bath home offering 1,093 sq ft of comfortable living space on a generous 6,095 sq ft lot. This wellkept property features a blend of tile and wood flooring, providing both durability and warmth throughout the home. The layout offers an inviting living area, functional kitchen, and three nicely sized bedrooms. Outside, you'll find a 2car carport, plus two storage sheds-perfect for tools, hobbies, or extra storage needs. The fully fenced backyard provides privacy and space for pets, gatherings, or future outdoor projects. A great opportunity for a firsttime buyer looking for a solid, wellmaintained property with room to make it your own.
Key facts
- 2car carport
- Two storage sheds
- 6,098 sq ft lot
Tags
Neighborhood map
What this means for you Summary
Snapshot
- This is a 2-bed/1.0-bath single-family listed at $130k.
Deal economics
- At list price, monthly cash flow is $4 ($47/yr) — positive.
- The deal already cash-flows at list — no discount required.
- To meet the 1% rule (rent ≥ 1% of price), the offer needs to be $126k (2.8% below list).
- Recommended offer: $126k (3.0% below list) — sets the bar for market timing.
- Cap rate 6.3% vs local median 3.8% in San Antonio — top-decile yield for the area; either an underpriced asset or a hidden risk that comps aren't pricing in. Stress-test before assuming the spread holds.
Location & tenants
- Location reads 80/100 on livability (#31 in TX, #1,616 nationally) — a professional / high-income tenant draw. Strengths: amenities A+, commute A+, cost of living A+; Watch: schools C-, crime F.
- San Antonio ISD (urban): math 12% / reading 22% proficiency, ranked #805 of 826 in TX (top 98%) — low school quality limits family demand, transient renter base, plan for 1-2y turnover; 80% free/reduced lunch — lower-income household profile, screen leases tightly.
- Market conditions: Rents rising fast (+7.7%/yr); 164 active listings in the ZIP; 36 comparable units currently listed for rent nearby; rentals at typical pace (median 23d on market — plan ~3-4 weeks tenant-placement turnaround); lower-income renter base — watch delinquency; 8,308 units permitted in Bexar County in 2024 (2,506 in 5+ unit buildings).
- At $1,263/mo this rent would consume 47% of the median local household income ($32k/yr) (locally 2789% of renters already pay >50% of income on rent) — very limited rent-growth headroom before tenants either downsize or default.
Forward outlook
- In year one you build about $14k of equity ($899 loan paydown + $13k appreciation (10.0% local appreciation)).
- Bexar County population projected at +50% by 2050 — long-run rental-demand tailwind backs the buy-and-hold thesis.
- At projected returns (10.0% appreciation + 7.7% rent growth), your $36k cash investment doubles in ~3 years — after that, you're playing with house money.
- By year 3, paydown + projected appreciation supports a ~$35k cash-out refi (75% LTV) — recoverable capital for the next deal without selling this one.
Negotiation context
- It's been on market 32 days — a 3% lower offer ($126k) is reasonable based on typical stale-listing flexibility.
- 2 sale attempts with the ask held roughly flat each time — persistent listings suggest the price (not the market) is what's stuck; bring a comps-based counter.
Risks & watch-outs
- Watch-outs: built in 1940 — expect roof / HVAC / electrical / plumbing capex.
- Climate carrying-cost: major wind risk, 78% chance of damaging wind over 30y; extreme-heat days projected 7→22/yr by 2055 (HVAC capex compounding) — expect insurance premiums to compound above CPI over the hold.
Questions for the listing agent
- It's been on market 32 days. Have you received any prior offers? Is the seller open to a 3% concession, seller financing, or rate buy-down credit?
- Built in 1940 — when were the roof, HVAC, electrical panel, plumbing, and water heater last replaced?
- Is there a deadline driving the sale (1031 exchange, divorce, estate, relocation)? That informs how much negotiation room exists.
- Crime grade is F in this area — have there been break-ins, vandalism, or insurance claims at this property in the last 3 years? What carrier currently insures it and at what premium?
- What's the average days-on-market for RENTAL listings here right now (not sales)? A rising rental-DOM trend means longer vacancies and softer asking-rent achievability than the comps imply.
- What's the recent tenant-quality profile in this submarket — average credit score on applications, eviction rate, late-payment / NSF rate, and stable-employment percentage? A property-management company in the area should have these aggregated.
- How much new for-sale + rental construction is in the pipeline within 1–3 miles? Heavy new supply typically softens prices + rents 12–24 months out; constrained supply supports both.
Investment metrics
- 1% rule
- 0.97% ✗
- Cap rate
- 6.33%
- Cash-on-cash
- 0.13%
- DSCR
- 1.01
- GRM
- 8.6
CMA / ARV
- ARV (median comp)
- $152,443
- List price
- $130,000
- Delta
- -14.72%
- Verdict
- UNDERPRICED
- Comps
- 20 within 1.0 mi
Show comp detail 12 sales within ~0.75 mi
| Address | Dist | Beds/Ba | Sqft | Sold | Price | $/sf | Match |
|---|---|---|---|---|---|---|---|
| 808 Brady Blvd | 0.32mi | 3/1.0 (+1) | 1,048 (-4%) | 4mo | $99,000 | $94 | 70 |
| 122 Osage | 0.33mi | 2/1.0 | 1,001 (-8%) | 3mo | $129,995 | $130 | 68 |
| 135 Lansing Ln | 0.18mi | 3/2.0 (+1) | 1,040 (-5%) | 10mo | $169,700 | $163 | 66 |
| 211 Carmen Pl | 0.14mi | 3/2.0 (+1) | 1,150 (+5%) | 13mo | $173,000 | $150 | 65 |
| 1257 Saltillo St | 0.35mi | 3/2.0 (+1) | 1,090 (-0%) | 16mo | $232,990 | $214 | 60 |
| 643 Mercedes St | 0.42mi | 2/1.0 | 1,152 (+5%) | 15mo | $180,000 | $156 | 59 |
| 2315 21st | 0.69mi | 2/2.0 | 1,060 (-3%) | 5mo | $165,000 | $156 | 55 |
| 1619 Potosi | 0.61mi | 3/1.5 (+1) | 1,127 (+3%) | 12mo | $120,000 | $106 | 50 |
| 1350 Barclay | 0.62mi | 3/1.0 (+1) | 1,120 (+2%) | 14mo | $110,000 | $98 | 50 |
| 3537 S Laredo St | 0.67mi | 3/1.0 (+1) | 987 (-10%) | 4mo | $104,999 | $106 | 44 |
| 1811 Paso Del Sur St | 0.51mi | 3/1.0 (+1) | 989 (-10%) | 17mo | $59,000 | $60 | 41 |
| 2920 Tampico | 0.74mi | 3/1.0 (+1) | 1,200 (+10%) | 8mo | $120,000 | $100 | 38 |
Match score weights: distance 35% · size 25% · config 20% · recency 20%. Top-matched comps best support the ARV.
Projected returns pro-forma
10.0% appreciation · 7.73% rent growth · sell at horizon
- IRR
- 26.2%
- Equity multiple
- 3.13×
- Total profit
- $77,425
- Equity at exit
- $117,114
- IRR
- 24.5%
- Equity multiple
- 7.69×
- Total profit
- $243,405
- Equity at exit
- $252,561
Cash invested: $36,400 (down + closing). Projections, not guarantees.
Landlord ↔ Tenant lean methodology
- Overall (STATE)
- 87 Strongly Landlord-Friendly
- State Texas
- 87 Strongly Landlord-Friendly · R+5
- County
- — inherits STATE
- City
- — inherits STATE
ZIP-level market 78207
- Home prices YoY
- 15.2%
- Rents YoY
- 7.7%
- Active inventory
- 164
- Price-to-rent
- 8.6×
Monthly cashflow live
- Estimated rent
- $1,263 high interval (Pro) →
- Mortgage (P&I)
- −$682
- Tax from tax record
- −$258 /mo · $3,097/yr
- Insurance
- −$54
- HOA
- −$0
- Vacancy / Maint / Mgmt
- −$265
- Net cashflow
- $4
Break-even live
Sensitivity live
| Price | -10% $77 | -5% $41 | +0% $4 | +5% $-33 | +10% $-70 |
|---|---|---|---|---|---|
| Rent | -10% $-96 | -5% $-46 | +0% $4 | +5% $54 | +10% $104 |
| Rate | -1.0pp $69 | -0.5pp $37 | base $4 | +0.5pp $-30 | +1.0pp $-64 |
UW: 25.0% down · 7.5% · 30yr · 1.5% tax · 5.0% vac · 8.0% maint · 8.0% mgmt
Financing live
Cash to close
- Down payment
- $32,500
- Closing costs
- $3,900
- Reserves months
- —
- Total cash needed
- —
Loan-product check · same deal, 3 products live
Conventional
25% down · 7.5% · 30yr
- Down + closing
- —
- Monthly P&I
- —
- Monthly cashflow
- —
- DSCR
- —
- Eligible?
- —
Personal DTI + credit; lowest rate.
DSCR
20% down · 8.5% · 30yr
- Down + closing
- —
- Monthly P&I
- —
- Monthly cashflow
- —
- DSCR
- —
- Eligible?
- —
No personal income docs; deal must DSCR.
Hard money
10% down · 12.0% · 12mo
- Down + closing
- —
- Monthly P&I
- —
- Monthly cashflow
- —
- DSCR
- —
- Eligible?
- —
Short-term bridge; refi at stabilization.
Rent comps 36 comps
| Address | Beds | Baths | Sqft | Rent | $/sqft | DOM | Units | Dist |
|---|---|---|---|---|---|---|---|---|
| 2003 S Zarzamora St San Antonio, TX | 1.0–4.0 | 1.0–2.0 | 1028 | $1,120 | $1.09 | 25d | 1 | 0.25mi |
| 1938 S Zarzamora St Unit 710 San Antonio, TX | 2.0 | 2.0 | 955 | $1,094 | $1.15 | 0d | 1 | 0.28mi |
| 1938 S Zarzamora St Unit 610 San Antonio, TX | 1.0 | 1.0 | 744 | $907 | $1.22 | 0d | 1 | 0.28mi |
| 843 Brady Blvd San Antonio, TX | 3.0 | 2.0 | 864 | $1,650 | $1.91 | 25d | 1 | 0.34mi |
| 1135 Ceralvo St San Antonio, TX | 3.0 | 2.0 | 1164 | $1,450 | $1.25 | 23d | 1 | 0.40mi |
| 1135 Ceralvo St San Antonio, TX | 3.0 | 2.0 | 1164 | $1,450 | $1.25 | 5d | 1 | 0.40mi |
| 319 Noria St San Antonio, TX | 3.0 | 1.0 | 1002 | $1,100 | $1.10 | 25d | 1 | 0.49mi |
| 2311 Potosi St San Antonio, TX | 3.0 | 1.0 | 864 | $1,600 | $1.85 | 45d | 1 | 0.60mi |
| 1823 San Carlos St San Antonio, TX | 3.0 | 2.0 | 1090 | $1,075 | $0.99 | 0d | 1 | 0.69mi |
| 626 Kirk Pl San Antonio, TX | 2.0 | 1.0 | 912 | $1,100 | $1.21 | 21d | 1 | 0.75mi |
| 2812 Vera Cruz San Antonio, TX | 1.0 | 2.0 | 1060 | $1,200 | $1.13 | 5d | 1 | 0.76mi |
| 2721 Colima St San Antonio, TX | 2.0 | 1.0 | 700 | $1,250 | $1.79 | 16d | 1 | 0.85mi |
| 542 Drake Ave San Antonio, TX | 3.0 | 2.0 | 1368 | $1,875 | $1.37 | 45d | 1 | 0.85mi |
| 231 Ceralvo St Unit Na San Antonio, TX | 3.0 | 2.0 | 1160 | $1,695 | $1.46 | 45d | 1 | 0.88mi |
| 333 Frio City Rd Unit 1 San Antonio, TX | 2.0 | 1.0 | 1350 | $1,350 | $1.00 | 12d | 1 | 0.89mi |
| 2406 S Laredo St San Antonio, TX | 3.0 | 1.0 | 944 | $1,200 | $1.27 | 16d | 1 | 0.91mi |
| 450 Taft Blvd San Antonio, TX | 3.0 | 1.0 | 883 | $1,295 | $1.47 | 45d | 1 | 0.93mi |
| 3103 Neptune St San Antonio, TX | 3.0 | 2.0 | 1008 | $1,350 | $1.34 | 45d | 1 | 0.97mi |
| 329 Taft Blvd San Antonio, TX | 2.0 | 2.0 | 862 | $2,200 | $2.55 | 0d | 1 | 1.03mi |
| 2114 Jupiter St San Antonio, TX | 3.0 | 3.0 | 1233 | $1,457 | $1.18 | 23d | 1 | 1.08mi |
| 410 N Park Blvd San Antonio, TX | 3.0 | 2.0 | 1326 | $1,650 | $1.24 | 45d | 1 | 1.08mi |
| 214 Aztec St San Antonio, TX | 3.0 | 2.0 | 973 | $1,275 | $1.31 | 16d | 1 | 1.16mi |
| 463 Linares St San Antonio, TX | 3.0 | 1.0 | 1220 | $1,400 | $1.15 | 25d | 1 | 1.19mi |
| 242 Drake Ave Unit 242 San Antonio, TX | 3.0 | 2.0 | 1472 | $1,700 | $1.15 | 45d | 1 | 1.20mi |
| 310 Finton Unit A San Antonio, TX | 1.0 | 1.0 | 960 | $850 | $0.89 | 45d | 1 | 1.28mi |
| 1901 S San Marcos Unit 710 San Antonio, TX | 2.0 | 2.0 | 985 | $1,139 | $1.16 | 0d | 1 | 1.33mi |
| 1901 S San Marcos Unit 610 San Antonio, TX | 1.0 | 1.0 | 750 | $954 | $1.27 | 0d | 1 | 1.33mi |
| 515 Humble Ave San Antonio, TX | 1.0 | 1.0 | 700 | $810 | $1.16 | 45d | 1 | 1.35mi |
| 150 Hearne San Antonio, TX | 2.0 | 1.0 | 1044 | $1,400 | $1.34 | 25d | 1 | 1.36mi |
| 602 Chihuahua St San Antonio, TX | 2.0 | 1.0 | 783 | $1,150 | $1.47 | 45d | 1 | 1.37mi |
| 614 Chihuahua St San Antonio, TX | 3.0 | 2.0 | 1082 | $1,400 | $1.29 | 45d | 1 | 1.39mi |
| 2425 Monterey St San Antonio, TX | 3.0 | 2.0 | 1416 | $1,900 | $1.34 | 0d | 1 | 1.41mi |
| 509 S Trinity St San Antonio, TX | 3.0 | 1.0 | 921 | $1,300 | $1.41 | 5d | 1 | 1.42mi |
| 2120 Monterey St Unit 102 San Antonio, TX | 2.0 | 2.0 | 1220 | $1,450 | $1.19 | 12d | 1 | 1.45mi |
| 2120 Monterey St Unit 102 San Antonio, TX | 2.0 | 2.0 | 1220 | $1,490 | $1.22 | 45d | 1 | 1.45mi |
| 815 Ripford St San Antonio, TX | 2.0 | 1.0 | 728 | $1,300 | $1.79 | 5d | 1 | 1.49mi |
Listing history 6 events
-
2026-05-16historical Active Option 685-char remark
Show marketing remark (685 chars)
Welcome to this charming 3bedroom, 1bath home offering 1,093 sq ft of comfortable living space on a generous 6,095 sq ft lot. This wellkept property features a blend of tile and wood flooring, providing both durability and warmth throughout the home. The layout offers an inviting living area, functional kitchen, and three nicely sized bedrooms. Outside, you'll find a 2car carport, plus two storage sheds-perfect for tools, hobbies, or extra storage needs. The fully fenced backyard provides privacy and space for pets, gatherings, or future outdoor projects. A great opportunity for a firsttime buyer looking for a solid, wellmaintained property with room to make it your own.
-
2026-04-20$130,000 New 685-char remark
Show marketing remark (685 chars)
Welcome to this charming 3bedroom, 1bath home offering 1,093 sq ft of comfortable living space on a generous 6,095 sq ft lot. This wellkept property features a blend of tile and wood flooring, providing both durability and warmth throughout the home. The layout offers an inviting living area, functional kitchen, and three nicely sized bedrooms. Outside, you'll find a 2car carport, plus two storage sheds-perfect for tools, hobbies, or extra storage needs. The fully fenced backyard provides privacy and space for pets, gatherings, or future outdoor projects. A great opportunity for a firsttime buyer looking for a solid, wellmaintained property with room to make it your own.
-
2026-01-30historical
-
2025-09-19price $150,000
-
2025-06-25price $165,000
-
2025-03-06$175,000 New
ⓘ Source: listings_history table (triggers on properties + properties_extension) + one-shot
backfill from property_details.listing_events for pre-trigger history.
Tax reassessment forecast TX · Resets to sale price
- Current annual tax
- $3,097 · $258/mo
- Projected year-2 tax
- $3,097 · $258/mo
- Expected delta
- $0/yr ($0/mo · 0.0%)
ⓘ Screening estimate from a state-policy table — verify with the county assessor before closing.
Climate risk First Street
- Flood 3/10 Moderate FEMA zone X (unshaded) · 20% chance over 30 yrs
- Wildfire 1/10 Low
- Heat 8/10 Severe 7 d/yr ≥109°F today · 22 d/yr by 30 yrs out
- Wind 7/10 Severe 78% chance of damaging wind over 30 yrs
- Air quality 2/10 Low 1 unhealthy d/yr today · 2 by 30 yrs out
Nearby sold comps map
Loading sold comps map…
Walkable amenities ~0.75 mi
Loading nearby amenities…
Taxation est. · year 1
- Rental income
- $15,158
- − Mortgage interest
- −$7,282
- − Property taxes
- −$3,097
- − Insurance
- −$650
- − Repairs & maintenance
- −$1,213
- − Management
- −$1,213
- − Depreciation
- −$3,782
- Taxable loss
- −$2,078
- Est. tax savings @ 24.0%
- +$499
- After-tax cash flow
- $546/yr
For passive investors: Depreciation is non-cash, so a rental often shows a tax loss while cash-flowing — sheltering income. Rental losses are passive: they offset passive income freely, and up to $25,000/yr can offset ordinary (W-2) income if you actively participate and your MAGI is under $100k (phasing out to $0 by $150k); unused losses carry forward. On sale, claimed depreciation is recaptured at up to 25%, and gains may owe capital-gains tax (a 1031 exchange can defer both). Figures are a year-1 estimate at your 24.0% rate — not tax advice; consult a CPA.
Schools (NCES district)
- District
- San Antonio ISD
- NCES district ID
- 4838730
- Math proficiency
- 12% ▼ -21.00%
- Reading proficiency
- 22% ▼ -7.00%
- Median HH income
- $30,952
- Composite
- 13.57/100
- National rank
- #9512
- State rank
- #805 of 826 in TX
Livability — San Antonio
- Score
- 80/100
- State rank
- #31
- US rank
- #1616
Category grades
Schools grade is shown separately in the Schools card above.
Census & demographics
- Census place
- San Antonio, TX
- County
- Bexar County · 1,990,555 people
- City population
- 1,806,925
- Metro
- San Antonio-New Braunfels, TX
- Population (ZIP)
- 55,474
- Household income
- $32,472
- Rent vs Own
- Severe rent burden
- 2789.0
Population outlook (Bexar County) Hauer SSP2
- Today (2025)
- 2,336,851 people
- By 2030
- 2,560,728 · +9.6%
- By 2040
- 3,020,569 · +29.3%
- By 2050
- 3,493,522 · +49.5%
- By 2075
- 4,668,459 · +99.8%
- By 2100
- 5,533,242 · +136.8%
Race, ethnicity, and origin ACS 2023
- Neighborhood character
- Predominantly Hispanic (88%)
- Race & ethnicity
- Hispanic / Latino 88% Two or more races 41% White 6% Black 5% Native American 2%
- Hispanic origin (detail)
- Mexican 79%
- Foreign-born
- 19% · Canada
- Languages at home
- 39% English-only · Spanish 60%
Political lean MEDSL · Bexar
- 2024 margin
- Lean D (+9.8) · D 54.3% · R 44.6% · Other 1.1%
- 2008→2024 swing
- +4.2pp toward D · 2008: 5.6pp · 2024: 9.8pp
- All cycles
- 2024: D+9.8 2020: D+18.2 2016: D+13.5 2012: D+4.6 2008: D+5.6
Not yet ingested
- Civics
- —
Market trends
- HPI YoY
- ▲ 34.92%
- Current HPI
- 264.7559
- Rent YoY
- ▲ 7.73%
- Metro
- San Antonio-New Braunfels, TX
- State GDP YoY
- ▲ 3.95%
- F500 in state
- 110
Industry mix (Fortune 500 HQ in TX)
| Industry | F500 HQs | Revenue |
|---|---|---|
| Energy | 16 | $1,198B |
|
||
| Technology | 5 | $198B |
|
||
| Engineering / Construction | 4 | $72B |
|
||
| Energy Services | 3 | $60B |
|
||
| Utilities | 3 | $41B |
|
||
| Healthcare | 2 | $330B |
|
||
Price history
-25.7% since first listed6 events — show timeline
- 2026-05-16 Contingent — LERA
- 2026-04-20 Listed $130,000 LERA
- 2026-01-30 Listing Removed — LERA
- 2025-09-19 Price Changed $150,000 LERA
- 2025-06-25 Price Changed $165,000 LERA
- 2025-03-06 Listed $175,000 LERA
Property tax history
+7.3%/yrLatest (2025): $3,097 · +23.7% YoY. Source: county tax records.
Cash-flow waterfall
monthlySold comps — $/sqft
last 12 mo · ≤1 miLoading sold comps…