 Multi-family
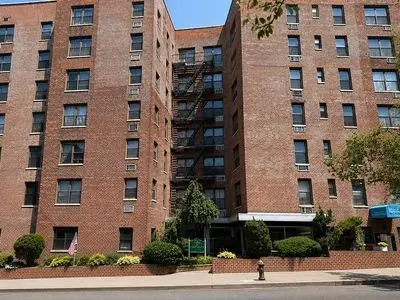
63-95 Austin St · New York, NY
Flood risk 1/10 · Minimal
- FEMA flood zone
- X (unshaded)
- Chance of flooding over 30 yrs
- 0.0%
- Est. flood insurance / yr
- $507 – $1,088
Fire risk 1/10 · Minimal
- Est. fire insurance / yr
- $691 – $1,283
Heat risk 6/10 · Moderate
- Hot days now (above 99°F)
- 7 days/yr
- Hot days in 30 yrs
- 15 days/yr
Wind risk 6/10 · Moderate
- Chance of severe wind over 30 yrs
- 27.0%
Air-quality risk 5/10 · Moderate
- Unhealthy air days now
- 6 days/yr
- Unhealthy air days in 30 yrs
- 8 days/yr
Risk factors via First Street. Map © Google.
Why this score? — see what drove the B grade
The composite is a weighted blend of 9 inputs, each scored 0–100. Each bar is that input's sub-score; the figure is the points it added to the 100-point composite (weight × sub-score).
- Cash flow +30.0/30.0
- 1% rule +10.0/10.0
- DSCR +10.0/10.0
- ARV discount +7.5/15.0
- Schools +5.0/10.0
- Livability +3.8/5.0
- Rent growth +2.9/5.0
- Condition / age +2.2/5.0
- Appreciation +0.0/10.0
$399,000
🖨 Deal sheet (PDF) 📄 Offer letter ✓ Due diligence
Multi-family units
County records classify this as Multi-Family (2-4 Unit). Listing-text estimate: 1 unit. estimate disagrees with records
Listing remarks
The unit has one full bedroom and an alcove area that could potentially be converted into a second bedroom. If you are interested in viewing the apartment during the open house hours, please text the owner at 646-407-2870 to make an appointment in advance, so I can manage the flow of visitors.
Key facts
- Built 1960
- Listed 9 days
Property features AI
Exterior
- Home design: Built in 1960
- Exterior features: Located in the Rego Park neighborhood
Neighborhood map
What this means for you Summary
Snapshot
- This is a 1-bed/1.0-bath multifamily listed at $399k. Condition is rated fair.
Deal economics
- At list price, monthly cash flow is $6k ($73k/yr) — positive.
- The deal already cash-flows at list — no discount required.
- Meets the 1% rule at list price ($11k rent vs $399k).
- Cap rate 24.6% vs local median 2.6% in New York — top-decile yield for the area; either an underpriced asset or a hidden risk that comps aren't pricing in. Stress-test before assuming the spread holds.
Location & tenants
- Location reads 75/100 on livability (#268 in NY, #4,188 nationally) — a middle-class / working-renter tenant base. Strengths: amenities A+, commute A+, health & safety A; Watch: crime F, cost of living F.
- Market conditions: Rents rising (+1.7%/yr); 345 active listings in the ZIP; 40 comparable units currently listed for rent nearby; rentals at typical pace (median 18d on market — plan ~3-4 weeks tenant-placement turnaround); solid renter incomes; 5,302 units permitted in Queens County in 2024 (4,918 in 5+ unit buildings).
- At $11,176/mo this rent would consume 148% of the median local household income ($91k/yr) (locally 3149% of renters already pay >50% of income on rent) — very limited rent-growth headroom before tenants either downsize or default.
Forward outlook
- Local home prices are declining (-3.0%/yr); year-one equity from $3k of loan paydown is wiped out by about $12k of value loss. Plan a longer hold.
- Queens County population projected at +16% by 2050 — long-run rental-demand tailwind backs the buy-and-hold thesis.
- At projected returns (-3.0% appreciation + 1.7% rent growth), your $112k cash investment doubles in ~2 years — after that, you're playing with house money.
Negotiation context
- Only 10 days on market — expect competitive offers; lowballing is unlikely to land.
Risks & watch-outs
- Climate carrying-cost: major wind risk, 27% chance of damaging wind over 30y; extreme-heat days projected 7→15/yr by 2055 (HVAC capex compounding) — expect insurance premiums to compound above CPI over the hold.
Questions for the listing agent
- Have any recent inspections been done? Can we get a copy of the seller's disclosures and any deferred-maintenance estimates?
- Built in 1960 — when were the roof, HVAC, electrical panel, plumbing, and water heater last replaced?
- Is there a deadline driving the sale (1031 exchange, divorce, estate, relocation)? That informs how much negotiation room exists.
- Schools are B-rated — typically a magnet for longer-tenancy family renters. What's the average tenant stay here, and is there a school-zone premium baked into asking?
- Crime grade is F in this area — have there been break-ins, vandalism, or insurance claims at this property in the last 3 years? What carrier currently insures it and at what premium?
- What's the average days-on-market for RENTAL listings here right now (not sales)? A rising rental-DOM trend means longer vacancies and softer asking-rent achievability than the comps imply.
- What's the recent tenant-quality profile in this submarket — average credit score on applications, eviction rate, late-payment / NSF rate, and stable-employment percentage? A property-management company in the area should have these aggregated.
- How much new apartment / multifamily construction is in the pipeline within 1–3 miles? Heavy new supply (>2% of stock underway) typically softens rents 12–24 months out; light construction supports rent growth.
Investment metrics
- 1% rule
- 2.80% ✓
- Cap rate
- 24.55%
- Cash-on-cash
- 65.22%
- DSCR
- 3.90
- GRM
- 3.0
CMA / ARV
No comps found within radius.
Show comp detail 2 sales within ~0.75 mi
| Address | Dist | Beds/Ba | Sqft | Sold | Price | $/sf | Match |
|---|---|---|---|---|---|---|---|
| 60-37 84th St | 0.62mi | 2/— (+1) | — | 12mo | $1,560,000 | — | 43 |
| 84-40 60th Dr | 0.55mi | 2/2.0 (+1) | — | 16mo | $1,320,000 | — | 40 |
Match score weights: distance 35% · size 25% · config 20% · recency 20%. Top-matched comps best support the ARV.
Projected returns pro-forma
-3.0% appreciation · 1.74% rent growth · sell at horizon
- IRR
- 63.0%
- Equity multiple
- 3.76×
- Total profit
- $308,226
- Equity at exit
- $59,492
- IRR
- 67.0%
- Equity multiple
- 7.36×
- Total profit
- $711,045
- Equity at exit
- $34,498
Cash invested: $111,720 (down + closing). Projections, not guarantees.
Landlord ↔ Tenant lean methodology
- Overall (CITY)
- 0 Strongly Tenant-Friendly
- State New York
- 15 Strongly Tenant-Friendly · D+10
- County
- — inherits STATE
- City New York
- 0 Strongly Tenant-Friendly · D+34
ZIP-level market 11374
- Rents YoY
- 1.7%
- Active inventory
- 345
- Price-to-rent
- 11.9×
Monthly cashflow live
- Estimated rent
- $11,176 high interval (Pro) →
- Mortgage (P&I)
- −$2,092
- Tax est. 1.5%
- −$499 /mo · $5,985/yr
- Insurance
- −$166
- HOA
- −$0
- Vacancy / Maint / Mgmt
- −$2,347
- Net cashflow
- $6,072
Break-even live
Sensitivity live
| Price | -10% $6,347 | -5% $6,210 | +0% $6,072 | +5% $5,934 | +10% $5,796 |
|---|---|---|---|---|---|
| Rent | -10% $5,189 | -5% $5,630 | +0% $6,072 | +5% $6,513 | +10% $6,955 |
| Rate | -1.0pp $6,273 | -0.5pp $6,173 | base $6,072 | +0.5pp $5,968 | +1.0pp $5,863 |
4-unit breakdown (identical units grouped — click to expand)
| Units | Beds | Baths | Est. rent |
|---|---|---|---|
| 4× units | 1 | 1 | $11,176 |
| #1 | 1 | 1 | $2,794 |
| #2 | 1 | 1 | $2,794 |
| #3 | 1 | 1 | $2,794 |
| #4 | 1 | 1 | $2,794 |
| Total (4 units) | $11,176 | ||
UW: 25.0% down · 7.5% · 30yr · 1.5% tax · 5.0% vac · 8.0% maint · 8.0% mgmt
Financing live
Cash to close
- Down payment
- $99,750
- Closing costs
- $11,970
- Reserves months
- —
- Total cash needed
- —
Loan-product check · same deal, 3 products live
Conventional
25% down · 7.5% · 30yr
- Down + closing
- —
- Monthly P&I
- —
- Monthly cashflow
- —
- DSCR
- —
- Eligible?
- —
Personal DTI + credit; lowest rate.
DSCR
20% down · 8.5% · 30yr
- Down + closing
- —
- Monthly P&I
- —
- Monthly cashflow
- —
- DSCR
- —
- Eligible?
- —
No personal income docs; deal must DSCR.
Hard money
10% down · 12.0% · 12mo
- Down + closing
- —
- Monthly P&I
- —
- Monthly cashflow
- —
- DSCR
- —
- Eligible?
- —
Short-term bridge; refi at stabilization.
Rent comps 40 comps
| Address | Beds | Baths | Sqft | Rent | $/sqft | DOM | Units | Dist |
|---|---|---|---|---|---|---|---|---|
| 6347 Booth St Unit 3C Rego Park, NY | 1.0 | 1.0 | 700 | $3,400 | $4.86 | 25d | 1 | 0.15mi |
| 6538 Austin St Unit 2G Rego Park, NY | 1.0 | 1.0 | — | $2,550 | — | 15d | 1 | 0.20mi |
| 6541 Booth St Unit 2K Rego Park, NY | — | 1.0 | — | $1,850 | — | 3d | 1 | 0.24mi |
| 97-12 65th Rd Unit 18-E Rego Park, NY | 1.0 | 1.0 | 600 | $3,650 | $6.08 | 0d | 1 | 0.26mi |
| 97-12 65th Rd Unit 4-C Rego Park, NY | 1.0 | 1.0 | 650 | $3,350 | $5.15 | 6d | 1 | 0.26mi |
| 61-55 98th St Unit 9 Rego Park, NY | — | 1.0 | — | $2,100 | — | 25d | 1 | 0.26mi |
| 9725 64th Ave Rego Park, NY | 1.0 | 1.0 | 760 | $1,800 | $2.37 | 19d | 1 | 0.28mi |
| 63-87 Fitchett St Unit 2R Flushing, NY | 2.0 | 1.0 | — | $2,950 | — | 8d | 1 | 0.28mi |
| 97-12 65th Rd Apt 5D Rego Park, NY | 1.0 | 1.0 | 800 | $3,395 | $4.24 | 6d | 1 | 0.29mi |
| 97-12 65th Rd Apt 23D Rego Park, NY | 2.0 | 2.0 | 1400 | $6,750 | $4.82 | 0d | 1 | 0.29mi |
| 9740 64th Ave Unit 3C Rego Park, NY | 2.0 | 2.0 | 22557 | $3,700 | $0.16 | 25d | 1 | 0.30mi |
| 66-01 Burns St Apt 3v Rego Park, NY | 1.0 | 1.0 | 820 | $2,300 | $2.80 | 21d | 1 | 0.32mi |
| 6601 Burns St Rego Park, NY | 1.0 | 1.0 | — | $2,300 | — | 25d | 1 | 0.33mi |
| 9707 63rd Rd Unit 15B Rego Park, NY | 1.0 | 1.0 | 700 | $2,300 | $3.29 | 2d | 1 | 0.34mi |
| 9810 64th Ave Unit 3A Rego Park, NY | 1.0 | 1.0 | 850 | $2,450 | $2.88 | 3d | 1 | 0.34mi |
| 9936 66th Ave Rego Park, NY | 1.0 | 1.0 | — | $2,800 | — | 0d | 1 | 0.34mi |
| 63127 Fitchett St Rego Park, NY | 1.0 | 1.0 | 900 | $2,800 | $3.11 | 2d | 1 | 0.34mi |
| 631-27 Fitchett St Unit 1 Flushing, NY | 2.0 | 1.0 | 1100 | $3,800 | $3.45 | 0d | 1 | 0.34mi |
| 9810 64th Ave Rego Park, NY | 1.0 | 1.0 | 825 | $2,125 | $2.58 | 18d | 2 | 0.35mi |
| 6620 Wetherole St Queens, NY | 2.0 | 2.0 | — | $3,300 | — | 22d | 1 | 0.35mi |
| 6620 Wetherole St Rego Park, NY | 1.0–2.0 | 1.0–2.0 | 700 | $2,400 | $3.43 | 25d | 2 | 0.35mi |
| 9825 64th Rd Unit 8F Rego Park, NY | 2.0 | 1.0 | 850 | $2,400 | $2.82 | 2d | 1 | 0.37mi |
| 6140 Saunders St Rego Park, NY | 1.0 | 1.0 | — | $2,300 | — | 25d | 1 | 0.37mi |
| 9826 64th Ave Unit 6J Rego Park, NY | — | 1.0 | 325 | $1,950 | $6.00 | 8d | 1 | 0.37mi |
| 9876 Queens Blvd Unit 3A Rego Park, NY | 1.0 | 1.0 | 820 | $2,900 | $3.54 | 25d | 1 | 0.38mi |
| 6615 Thornton Pl Rego Park, NY | 1.0 | 1.0 | 700 | $2,672 | $3.82 | 5d | 3 | 0.38mi |
| 9710 62nd Dr Unit 9F Rego Park, NY | 1.0 | 1.0 | 750 | $2,700 | $3.60 | 4d | 1 | 0.39mi |
| 98-10 63rd Rd Rego Park, NY | 1.0 | 1.0 | — | $3,300 | — | 25d | 1 | 0.40mi |
| 9801 67th Ave Rego Park, NY | — | 1.0 | — | $2,595 | — | 25d | 1 | 0.40mi |
| 98-10 63rd Rd Unit 1901 Rego Park, NY | 2.0 | 1.0 | — | $3,727 | — | 25d | 1 | 0.41mi |
| 9740 62nd Dr Rego Park, NY | 1.0 | 1.0 | — | $1,800 | — | 17d | 1 | 0.41mi |
| 9740 62nd Dr Rego Park, NY | 1.0 | 1.0 | — | $2,100 | — | 25d | 1 | 0.41mi |
| 98-81 Queens Blvd Unit 15E Rego Park, NY | 1.0 | 1.0 | 700 | $3,335 | $4.76 | 6d | 1 | 0.42mi |
| 98-81 Queens Blvd Unit 14K Rego Park, NY | 2.0 | 2.0 | 950 | $4,490 | $4.73 | 13d | 1 | 0.42mi |
| 9881 Queens Blvd Rego Park, NY | 1.0 | 1.0 | — | $3,295 | — | 25d | 1 | 0.42mi |
| 66-55 Booth St Unit 6 Rego Park, NY | — | 1.0 | 500 | $2,295 | $4.59 | 25d | 1 | 0.43mi |
| 120 Queens Blvd Flushing, NY | 1.0 | 1.0 | — | $1,800 | — | 19d | 1 | 0.44mi |
| 6336 99th St Unit 5E Rego Park, NY | 2.0 | 2.5 | 1333 | $4,600 | $3.45 | 5d | 1 | 0.45mi |
| 67-13 Austin St Unit 2A Flushing, NY | 1.0 | 1.0 | 600 | $2,595 | $4.33 | 17d | 1 | 0.47mi |
| 6125 97th St Unit 4D Rego Park, NY | — | 1.0 | 650 | $2,300 | $3.54 | 5d | 1 | 0.47mi |
Listing history 6 events
-
2026-06-18days on market $399,000 Active 10 DOM
-
2026-06-17days on market $399,000 Active 9 DOM
-
2026-06-15days on market $399,000 Active 7 DOM
-
2026-06-13days on market $399,000 Active 5 DOM
-
2026-06-10remarks 294-char remark
-
2026-06-10$399,000 Active 1 DOM
ⓘ Source: listings_history table (triggers on properties + properties_extension) + one-shot
backfill from property_details.listing_events for pre-trigger history.
Climate risk First Street
- Flood 1/10 Low FEMA zone X (unshaded) · 0% chance over 30 yrs
- Wildfire 1/10 Low
- Heat 6/10 Major 7 d/yr ≥99°F today · 15 d/yr by 30 yrs out
- Wind 6/10 Major 27% chance of damaging wind over 30 yrs
- Air quality 5/10 Major 6 unhealthy d/yr today · 8 by 30 yrs out
Nearby sold comps map
Loading sold comps map…
Walkable amenities ~0.75 mi
Loading nearby amenities…
Taxation est. · year 1
- Rental income
- $134,112
- − Mortgage interest
- −$22,350
- − Property taxes
- −$5,985
- − Insurance
- −$1,995
- − Repairs & maintenance
- −$10,729
- − Management
- −$10,729
- − Depreciation
- −$11,607
- Taxable income
- $70,717
- Est. tax owed @ 24.0%
- −$16,972
- After-tax cash flow
- $55,888/yr
For passive investors: Depreciation is non-cash, so a rental often shows a tax loss while cash-flowing — sheltering income. Rental losses are passive: they offset passive income freely, and up to $25,000/yr can offset ordinary (W-2) income if you actively participate and your MAGI is under $100k (phasing out to $0 by $150k); unused losses carry forward. On sale, claimed depreciation is recaptured at up to 25%, and gains may owe capital-gains tax (a 1031 exchange can defer both). Figures are a year-1 estimate at your 24.0% rate — not tax advice; consult a CPA.
Condition & rehab AI · 2 photos
A fair condition apartment with cosmetic updates needed, including exterior painting and landscaping. Potential for increased value with these improvements.
Repairs flagged
- Minor exterior paint — Some discoloration on the brick facade
- Minor landscaping — Bushes appear slightly overgrown
Value-add opportunities
- Both paint exterior — Fresh paint would improve curb appeal and property value
- Both prune bushes — Well-maintained landscaping enhances curb appeal and property value
Renovation cost estimate screening
| Repair item | Severity | Est. cost |
|---|---|---|
| exterior paint · Some discoloration on the brick facade | Minor | $500–3,000 |
| landscaping · Bushes appear slightly overgrown | Minor | $500–3,000 |
| Total estimated repair cost · 2 items | $1,000–6,000 |
Value-add ROI direction
- Both paint exterior — Fresh paint would improve curb appeal and property value ↑
- Both prune bushes — Well-maintained landscaping enhances curb appeal and property value ↑
ⓘ Cost ranges are severity-bucket heuristics (US national rule-of-thumb). Get contractor quotes + a written scope before underwriting a rehab budget.
Schools (NCES district)
No district data.
Livability — New York
- Score
- 75/100
- State rank
- #268
- US rank
- #4188
Category grades
Schools grade is shown separately in the Schools card above.
Census & demographics
- Census place
- New York, NY
- County
- Queens County · 1,914,869 people
- City population
- 7,731,280
- Metro
- New York-Newark-Jersey City, NY-NJ-PA
- Population (ZIP)
- 46,989
- Household income
- $90,631
- Rent vs Own
- Severe rent burden
- 3149.0
Population outlook (Queens County) Hauer SSP2
- Today (2025)
- 2,546,320 people
- By 2030
- 2,643,059 · +3.8%
- By 2040
- 2,815,563 · +10.6%
- By 2050
- 2,944,423 · +15.6%
- By 2075
- 3,123,338 · +22.7%
- By 2100
- 3,098,688 · +21.7%
Race, ethnicity, and origin ACS 2023
- Neighborhood character
- Highly diverse neighborhood (Simpson 0.72)
- Race & ethnicity
- White 38% Asian 29% Hispanic / Latino 22% Two or more races 13% Black 4%
- Hispanic origin (detail)
- Mexican 1% Puerto Rican 3% Dominican 3%
- Common ancestry
- Scotch-Irish 6% Romanian 2% Subsaharan African 1%
- Foreign-born
- 54% · Canada, China, Jamaica
- Languages at home
- 28% English-only · Spanish 18% Russian/Polish/Slavic 15% Chinese 13%
Political lean MEDSL · Queens
- 2024 margin
- Strong D (+24.6) · D 62.3% · R 37.7%
- 2008→2024 swing
- -26.2pp toward R · 2008: 50.8pp · 2024: 24.6pp
- All cycles
- 2024: D+24.6 2020: D+45.2 2016: D+53.4 2012: D+58.5 2008: D+50.8
Not yet ingested
- Civics
- —
Market trends
- HPI YoY
- ▼ -163.20%
- Current HPI
- 207.1869
- Rent YoY
- ▲ 1.74%
- Metro
- New York-Newark-Jersey City, NY-NJ-PA
- State GDP YoY
- ▲ 2.60%
- F500 in state
- 92
Industry mix (Fortune 500 HQ in NY)
| Industry | F500 HQs | Revenue |
|---|---|---|
| Financial Services | 10 | $950B |
|
||
| Consumer Goods | 9 | $162B |
|
||
| Insurance | 4 | $225B |
|
||
| Telecommunications | 2 | $144B |
|
||
| Pharmaceuticals | 2 | $112B |
|
||
| Media / Entertainment | 2 | $69B |
|
||
Price history
1 event — show timeline
- 2026-06-09 Listed $399,000 FSBO.com
Cash-flow waterfall
monthlySold comps — $/sqft
last 12 mo · ≤1 miLoading sold comps…