 Multi-family
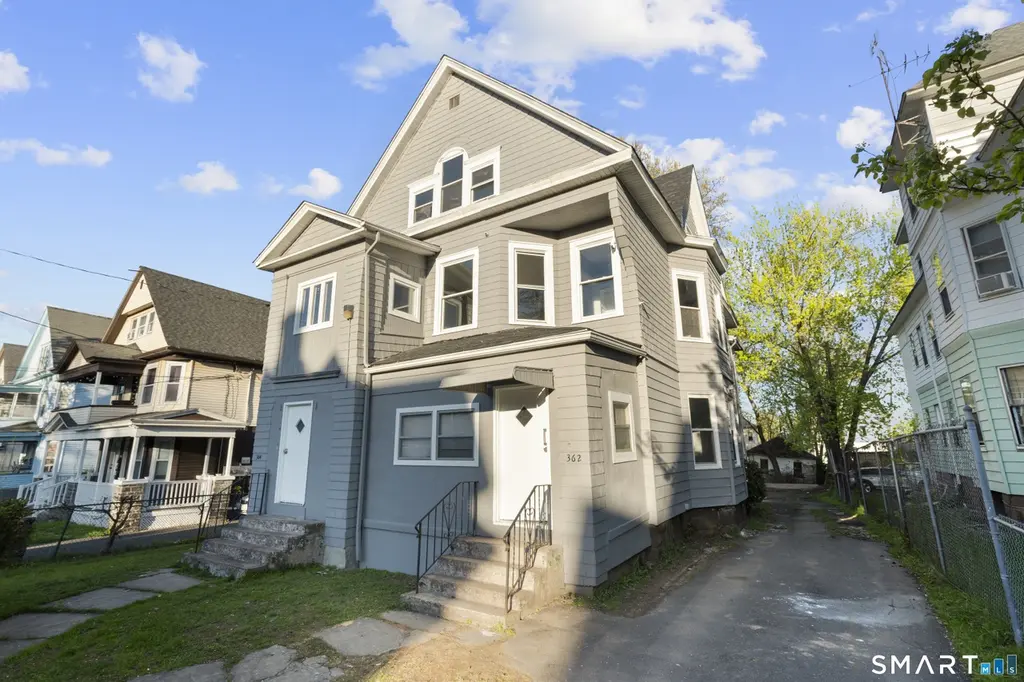
362 Sigourney St · Hartford, CT
Flood risk 1/10 · Minimal
- FEMA flood zone
- X (unshaded)
- Chance of flooding over 30 yrs
- 0.0%
- Est. flood insurance / yr
- $473 – $860
Fire risk 1/10 · Minimal
- Est. fire insurance / yr
- $829 – $1,539
Heat risk 5/10 · Moderate
- Hot days now (above 97°F)
- 7 days/yr
- Hot days in 30 yrs
- 16 days/yr
Wind risk 6/10 · Moderate
- Chance of severe wind over 30 yrs
- 27.0%
Air-quality risk 3/10 · Minor
- Unhealthy air days now
- 3 days/yr
- Unhealthy air days in 30 yrs
- 4 days/yr
Risk factors via First Street. Map © Google.
Why this score? — see what drove the B+ grade
The composite is a weighted blend of 9 inputs, each scored 0–100. Each bar is that input's sub-score; the figure is the points it added to the 100-point composite (weight × sub-score).
- Cash flow +29.4/30.0
- DSCR +10.0/10.0
- Appreciation +10.0/10.0
- 1% rule +8.2/10.0
- ARV discount +7.5/15.0
- Condition / age +4.0/5.0
- Livability +3.8/5.0
- Rent growth +2.5/5.0
- Schools +1.4/10.0
$519,000
🖨 Deal sheet 📄 Offer letter ✓ Due diligence
Multi-family units
County records classify this as Multi-Family (2-4 Unit). Listing-text estimate: 1 unit. estimate disagrees with records
Listing remarks
Fully renovated three-unit property featuring 3 bedrooms in each unit. Each unit offers updated finishes, modern kitchens and baths, and a clean, move-in-ready layout. The property provides flexibility for a variety of ownership needs. Add a renovated multi-unit property to a portfolio TODAY. With updates already completed and separate spacious units throughout, this property is ready for its next owner. ..
Key facts
- 8,712 sq ft lot
- Built 1914
- Listed 15 days
Property features AI
Exterior
- Utilities: Public water connected; Public sewer connected; Natural gas hot water (40-gallon tank)
- Home design: Multi-family property (3-family)
- Construction: Frame construction; Concrete foundation
- Exterior features: Vinyl siding; Asphalt shingle roof
Interior
- Bedrooms: Nine bedrooms
- Bathrooms: Three full bathrooms
- Heating & cooling: Hot air heating; Natural gas heat
- Interior features: Two fireplaces; Full, unfinished basement; Attic with pull-down stairs; 15 total rooms
Neighborhood map
What this means for you Summary
Snapshot
- This is a 9-bed/3.0-bath multifamily listed at $519k. Condition is rated good.
Deal economics
- At list price, monthly cash flow is $2k ($22k/yr) — positive.
- The deal already cash-flows at list — no discount required.
- Meets the 1% rule at list price ($7k rent vs $519k).
- Recommended offer: $511k (1.5% below list) — sets the bar for market timing.
Location & tenants
- Location reads 76/100 on livability (#58 in CT, #3,553 nationally) — a middle-class / working-renter tenant base. Strengths: amenities A+, commute A+, health & safety A+; Watch: schools D-, crime F, employment F.
- Hartford School District (urban): math 13% / reading 21% proficiency, ranked #150 of 153 in CT (top 98%) — low school quality limits family demand, transient renter base, plan for 1-2y turnover; 84% free/reduced lunch — lower-income household profile, screen leases tightly.
- Market conditions: 47 active listings in the ZIP; lower-income renter base — watch delinquency; 1,867 units permitted in Capitol Planning Region in 2024 (1,399 in 5+ unit buildings).
- At $6,872/mo this rent would consume 185% of the median local household income ($44k/yr) (locally 1466% of renters already pay >50% of income on rent) — very limited rent-growth headroom before tenants either downsize or default.
Forward outlook
- In year one you build about $55k of equity ($4k loan paydown + $52k appreciation (10.0% local appreciation)).
- At projected returns (10.0% appreciation + 3.0% rent growth), your $145k cash investment doubles in ~2 years — after that, you're playing with house money.
- By year 2, paydown + projected appreciation supports a ~$89k cash-out refi (75% LTV) — recoverable capital for the next deal without selling this one.
Negotiation context
- It's been on market 15 days — a 2% lower offer ($511k) is reasonable based on typical stale-listing flexibility.
Risks & watch-outs
- Watch-outs: built in 1914 — expect roof / HVAC / electrical / plumbing capex.
- Climate carrying-cost: major wind risk, 27% chance of damaging wind over 30y; extreme-heat days projected 7→16/yr by 2055 (HVAC capex compounding) — expect insurance premiums to compound above CPI over the hold.
Questions for the listing agent
- Built in 1914 — when were the roof, HVAC, electrical panel, plumbing, and water heater last replaced?
- Is there a deadline driving the sale (1031 exchange, divorce, estate, relocation)? That informs how much negotiation room exists.
- Schools are D-rated, which usually means shorter tenancies and higher turnover. Who's the typical renter profile here, and what's been the actual vacancy rate?
- Crime grade is F in this area — have there been break-ins, vandalism, or insurance claims at this property in the last 3 years? What carrier currently insures it and at what premium?
- What's the average days-on-market for RENTAL listings here right now (not sales)? A rising rental-DOM trend means longer vacancies and softer asking-rent achievability than the comps imply.
- What's the recent tenant-quality profile in this submarket — average credit score on applications, eviction rate, late-payment / NSF rate, and stable-employment percentage? A property-management company in the area should have these aggregated.
- How much new apartment / multifamily construction is in the pipeline within 1–3 miles? Heavy new supply (>2% of stock underway) typically softens rents 12–24 months out; light construction supports rent growth.
Investment metrics
- 1% rule
- 1.32% ✓
- Cap rate
- 10.55%
- Cash-on-cash
- 15.21%
- DSCR
- 1.68
- GRM
- 6.3
CMA / ARV
No comps found within radius.
Projected returns pro-forma
10.0% appreciation · 3.0% rent growth · sell at horizon
- IRR
- 35.5%
- Equity multiple
- 3.75×
- Total profit
- $400,095
- Equity at exit
- $467,556
- IRR
- 30.6%
- Equity multiple
- 8.47×
- Total profit
- $1,086,152
- Equity at exit
- $1,008,303
Cash invested: $145,320 (down + closing). Projections, not guarantees.
Landlord ↔ Tenant lean methodology
- Overall (STATE)
- 27 Tenant-Leaning
- State Connecticut
- 27 Tenant-Leaning · D+7
- County
- — inherits STATE
- City
- — inherits STATE
ZIP-level market 06112
- Home prices YoY
- 4.9%
- Active inventory
- 47
- Price-to-rent
- 18.9×
Monthly cashflow live
- Estimated rent
- $6,872 high interval (Pro) →
- Mortgage (P&I)
- −$2,722
- Tax est. 1.5%
- −$649 /mo · $7,785/yr
- Insurance
- −$216
- HOA
- −$0
- Vacancy / Maint / Mgmt
- −$1,443
- Net cashflow
- $1,842
Break-even live
3-unit breakdown (identical units grouped — click to expand)
| Units | Beds | Baths | Est. rent |
|---|---|---|---|
| 3× units | 3 | 1 | $6,873 |
| #1 | 3 | 1 | $2,291 |
| #2 | 3 | 1 | $2,291 |
| #3 | 3 | 1 | $2,291 |
| Total (3 units) | $6,872 | ||
UW: 25.0% down · 7.5% · 30yr · 1.5% tax · 5.0% vac · 8.0% maint · 8.0% mgmt
Financing live
Cash to close
- Down payment
- $129,750
- Closing costs
- $15,570
- Reserves months
- —
- Total cash needed
- —
Loan-product check · same deal, 3 products live
Conventional
25% down · 7.5% · 30yr
- Down + closing
- —
- Monthly P&I
- —
- Monthly cashflow
- —
- DSCR
- —
- Eligible?
- —
Personal DTI + credit; lowest rate.
DSCR
20% down · 8.5% · 30yr
- Down + closing
- —
- Monthly P&I
- —
- Monthly cashflow
- —
- DSCR
- —
- Eligible?
- —
No personal income docs; deal must DSCR.
Hard money
10% down · 12.0% · 12mo
- Down + closing
- —
- Monthly P&I
- —
- Monthly cashflow
- —
- DSCR
- —
- Eligible?
- —
Short-term bridge; refi at stabilization.
Listing history 4 events
-
2026-05-13status Under Contract 409-char remark
-
2026-05-03price $519,000 409-char remark
-
2026-04-30price $495,000 409-char remark
-
2026-04-28$475,000 Active 409-char remark
ⓘ Source: listings_history table (triggers on properties + properties_extension) + one-shot
backfill from property_details.listing_events for pre-trigger history.
Climate risk First Street
- Flood 1/10 Low FEMA zone X (unshaded) · 0% chance over 30 yrs
- Wildfire 1/10 Low
- Heat 5/10 Major 7 d/yr ≥97°F today · 16 d/yr by 30 yrs out
- Wind 6/10 Major 27% chance of damaging wind over 30 yrs
- Air quality 3/10 Moderate 3 unhealthy d/yr today · 4 by 30 yrs out
Nearby sold comps map
Loading sold comps map…
Walkable amenities ~0.75 mi
Loading nearby amenities…
Taxation est. · year 1
- Rental income
- $82,464
- − Mortgage interest
- −$29,072
- − Property taxes
- −$7,785
- − Insurance
- −$2,595
- − Repairs & maintenance
- −$6,597
- − Management
- −$6,597
- − Depreciation
- −$15,098
- Taxable income
- $14,720
- Est. tax owed @ 24.0%
- −$3,533
- After-tax cash flow
- $18,574/yr
For passive investors: Depreciation is non-cash, so a rental often shows a tax loss while cash-flowing — sheltering income. Rental losses are passive: they offset passive income freely, and up to $25,000/yr can offset ordinary (W-2) income if you actively participate and your MAGI is under $100k (phasing out to $0 by $150k); unused losses carry forward. On sale, claimed depreciation is recaptured at up to 25%, and gains may owe capital-gains tax (a 1031 exchange can defer both). Figures are a year-1 estimate at your 24.0% rate — not tax advice; consult a CPA.
Condition & rehab AI · 12 photos
This fully renovated three-unit property is move-in ready with updated finishes and modern kitchens and baths. It offers flexibility for various ownership needs and is ready for its next owner.
Value-add opportunities
- Both Paint exterior — Fresh paint enhances curb appeal and value
- Both Replace front door — A new door can improve security and aesthetics
- Both Install smart home devices — Enhances convenience and marketability
Renovation cost estimate screening
Value-add ROI direction
- Both Paint exterior — Fresh paint enhances curb appeal and value ↑
- Both Replace front door — A new door can improve security and aesthetics ↑
- Both Install smart home devices — Enhances convenience and marketability ↑
ⓘ Cost ranges are severity-bucket heuristics (US national rule-of-thumb). Get contractor quotes + a written scope before underwriting a rehab budget.
Schools (NCES district)
- District
- Hartford School District
- NCES district ID
- 0901920
- Math proficiency
- 13% ▼ -5.00%
- Reading proficiency
- 21% ▼ -6.00%
- Median HH income
- $30,521
- Composite
- 13.54/100
- National rank
- #9514
- State rank
- #150 of 153 in CT
Livability — Hartford
- Score
- 76/100
- State rank
- #58
- US rank
- #3553
Category grades
Schools grade is shown separately in the Schools card above.
Census & demographics
- Census place
- Hartford, CT
- County
- Hartford County · 754,208 people
- City population
- 121,162
- Metro
- Hartford-East Hartford-Middletown, CT
- Population (ZIP)
- 22,333
- Household income
- $44,460
- Rent vs Own
- Severe rent burden
- 1466.0
Population outlook (Capitol County) Hauer SSP2
- By 2040
- 1,063,519
Race, ethnicity, and origin ACS 2023
- Neighborhood character
- Predominantly Black (68%)
- Race & ethnicity
- Black 68% Hispanic / Latino 19% White 9% Two or more races 6%
- Hispanic origin (detail)
- Puerto Rican 15% Dominican 1%
- Common ancestry
- Hispanic 2%
- Foreign-born
- 26% · Canada
- Languages at home
- 81% English-only · Spanish 14% French/Haitian/Cajun 2% Other Indo-European 1%
Political lean MEDSL · Capitol
- 2024 margin
- Strong D (+21.9) · D 60.1% · R 38.2% · Other 1.7%
- All cycles
- 2024: D+21.9
Not yet ingested
- Civics
- —
Market trends
- HPI YoY
- ▲ 14.58%
- Current HPI
- 310.7763
- Rent YoY
- —
- Metro
- Hartford-East Hartford-Middletown, CT
- State GDP YoY
- ▲ 1.06%
- F500 in state
- 38
Industry mix (Fortune 500 HQ in CT)
| Industry | F500 HQs | Revenue |
|---|---|---|
| Industrial Machinery | 4 | $38B |
|
||
| Insurance | 3 | $71B |
|
||
| Financial Services | 2 | $25B |
|
||
| Transportation / Logistics | 2 | $18B |
|
||
| Healthcare | 1 | $247B |
|
||
| Telecommunications | 1 | $55B |
|
||
Price history
+9.3% since first listed4 events — show timeline
- 2026-05-13 Pending — Smart MLS
- 2026-05-03 Price Changed $519,000 Smart MLS
- 2026-04-30 Price Changed $495,000 Smart MLS
- 2026-04-28 Listed $475,000 Smart MLS
Cash-flow waterfall
monthlySold comps — $/sqft
last 12 mo · ≤1 miLoading sold comps…