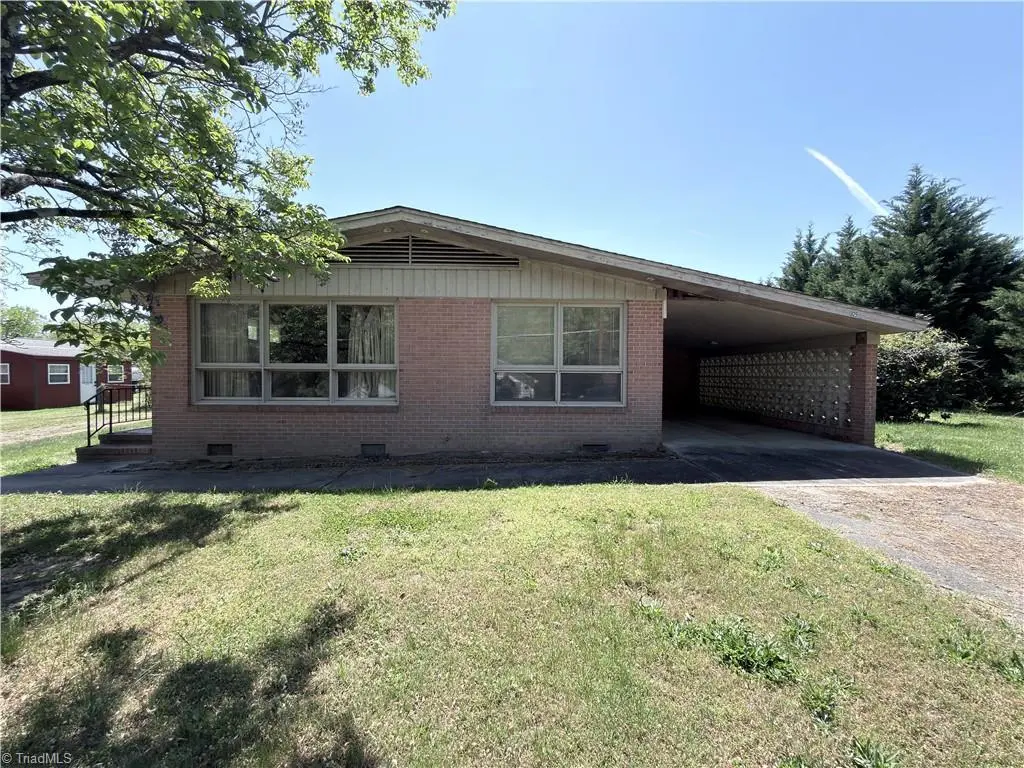
325 Bluemont Rd · Toast, NC
Flood risk 1/10 · Minimal
- FEMA flood zone
- X (unshaded)
- Chance of flooding over 30 yrs
- 0.0%
- Est. flood insurance / yr
- $507 – $1,088
Fire risk 3/10 · Minor
- Est. fire insurance / yr
- $906 – $1,684
Heat risk 5/10 · Moderate
- Hot days now (above 100°F)
- 7 days/yr
- Hot days in 30 yrs
- 19 days/yr
Wind risk 2/10 · Minimal
- Chance of severe wind over 30 yrs
- 1.0%
Air-quality risk 1/10 · Minimal
- Unhealthy air days now
- 0 days/yr
- Unhealthy air days in 30 yrs
- 0 days/yr
Risk factors via First Street. Map © Google.
Why this score? — see what drove the C+ grade
The composite is a weighted blend of 9 inputs, each scored 0–100. Each bar is that input's sub-score; the figure is the points it added to the 100-point composite (weight × sub-score).
- Cash flow +21.8/30.0
- ARV discount +15.0/15.0
- DSCR +7.0/10.0
- 1% rule +4.6/10.0
- Schools +4.3/10.0
- Livability +3.1/5.0
- Rent growth +2.5/5.0
- Condition / age +2.5/5.0
- Appreciation +0.0/10.0
$135,000
🖨 Deal sheet (PDF) 📄 Offer letter ✓ Due diligence
Listing remarks
Opportunity awaits with this 2-bedroom, 1.5-bath fixer-upper full of potential! Conveniently located close to grocery stores, dining, and everyday essentials, this property is perfect for investors, renovators, or buyers eager to put their personal touch on a home. The interior offers a functional layout with a spacious living area, two comfortably sized bedrooms, and a half bath for added convenience. An attached covered carport provides easy, sheltered access to the home, while a separate workshop offers excellent space for projects and storage. This property is a great opportunity to build equity and create something truly special. Being sold as-is—bring your vision and make it you
Key facts
- Separate workshop
- 0.5 acre lot
- Garage
Tags
Property features AI
Finance
- Other: Property includes one fireplace with a gas log located in the den
- HOA & community: No homeowners association
Exterior
- Parking: Attached carport; Gravel parking; One garage/carport space
- Utilities: Private water source; Private sewer; Electric water heater
- Home design: Residential stick/site-built house; One story; Built in 1960; Existing structure
- Construction: Brick construction; Crawl space foundation; Shingle roof information not provided
- Exterior features: Cleared lot; Storage structure on the property; Publicly maintained road access
Interior
- Kitchen: Electric water heater
- Bedrooms: Bedrooms located on the main level
- Flooring: Carpet; Tile
- Bathrooms: One full bathroom; One half bathroom
- Heating & cooling: Baseboard heating; Propane (Propane gas fuel); No central cooling
- Interior features: Primary bedroom located on the main level; Attic access only
- Laundry & utility: Electric water heater
Neighborhood map
What this means for you Summary
Snapshot
- This is a 2-bed/1.5-bath single-family listed at $135k.
Deal economics
- At list price, monthly cash flow is $211 ($3k/yr) — positive.
- The deal already cash-flows at list — no discount required.
- To meet the 1% rule (rent ≥ 1% of price), the offer needs to be $130k (3.7% below list).
- Recommended offer: $130k (3.7% below list) — sets the bar for 1% rule.
Location & tenants
- Location reads 61/100 on livability (#485 in NC) — a middle-class / working-renter tenant base. Strengths: cost of living A+, crime A-; Watch: amenities F, commute F, employment F.
- Surry County Schools (rural): math 52% / reading 52% proficiency, ranked #60 of 178 in NC (top 34%) — acceptable for families but not a draw, mixed tenant base, ~2y average lease.
- Zoned schools: Franklin Elementary (math 54% / reading 50%, grade C-, #354 of 1,410 statewide, top 28%, 456 students, 75% FRL); Meadowview Magnet Middle (math 48% / reading 49%, grade C-, #127 of 475 statewide, top 28%, 349 students, 74% FRL); North Surry High (math 57% / reading 48%, grade C-, #287 of 535 statewide, top 54%, 843 students, 62% FRL) — zoned schools average 71% FRL vs 55% district-wide (15 pts higher); higher-poverty schools than district average — tighter screening recommended.
- Market conditions: 215 active listings in the ZIP; 2 comparable units currently listed for rent nearby; 243 units permitted in Surry County in 2024 (0 in 5+ unit buildings).
- This rent runs 34% of the median local income ($46k/yr) — at the standard rent-burdened threshold; future hikes will face affordability resistance.
Forward outlook
- Local home prices are declining (-3.0%/yr); year-one equity from $933 of loan paydown is wiped out by about $4k of value loss. Plan a longer hold.
- Surry County population projected at -22% by 2050 — secular population decline; favor cash flow + early exit over multi-decade hold.
Negotiation context
- Only 9 days on market — expect competitive offers; lowballing is unlikely to land.
Risks & watch-outs
- Climate carrying-cost: extreme-heat days projected 7→19/yr by 2055 (HVAC capex compounding) — expect insurance premiums to compound above CPI over the hold.
Questions for the listing agent
- Built in 1960 — when were the roof, HVAC, electrical panel, plumbing, and water heater last replaced?
- Is there a deadline driving the sale (1031 exchange, divorce, estate, relocation)? That informs how much negotiation room exists.
- Schools are F-rated, which usually means shorter tenancies and higher turnover. Who's the typical renter profile here, and what's been the actual vacancy rate?
- What's the average days-on-market for RENTAL listings here right now (not sales)? A rising rental-DOM trend means longer vacancies and softer asking-rent achievability than the comps imply.
- What's the recent tenant-quality profile in this submarket — average credit score on applications, eviction rate, late-payment / NSF rate, and stable-employment percentage? A property-management company in the area should have these aggregated.
- How much new for-sale + rental construction is in the pipeline within 1–3 miles? Heavy new supply typically softens prices + rents 12–24 months out; constrained supply supports both.
Investment metrics
- 1% rule
- 0.96% ✗
- Cap rate
- 8.17%
- Cash-on-cash
- 6.70%
- DSCR
- 1.30
- GRM
- 8.7
CMA / ARV
- ARV (on-the-fly)
- $206,976
- Comps found
- 10
Show comp detail 10 sales within ~0.75 mi
| Address | Dist | Beds/Ba | Sqft | Sold | Price | $/sf | Match |
|---|---|---|---|---|---|---|---|
| 325 Bluemont Rd | 0.00mi | 2/1.5 | 1,156 (-2%) | 0mo | $125,000 | $108 | 97 |
| 122 Rain Tree Trl | 0.23mi | 3/1.0 (+1) | 1,150 (-2%) | 12mo | $215,000 | $187 | 68 |
| 132 Belair Dr | 0.46mi | 3/1.0 (+1) | 1,196 (+2%) | 11mo | $200,000 | $167 | 60 |
| 116 Dogwood Dr | 0.52mi | 3/1.0 (+1) | 1,140 (-3%) | 8mo | $212,000 | $186 | 56 |
| 180 Maple Dr | 0.36mi | 2/2.0 | 1,259 (+7%) | 18mo | $175,000 | $139 | 54 |
| 446 Durham St | 0.67mi | 2/1.0 | 1,134 (-4%) | 11mo | $164,000 | $145 | 52 |
| 262 Summit Dr | 0.63mi | 2/1.5 | 1,200 (+2%) | 24mo | $132,500 | $110 | 48 |
| 104 Parrish Ln | 0.42mi | 2/1.0 | 1,050 (-11%) | 20mo | $185,000 | $176 | 44 |
| 808 Factory St | 0.65mi | 3/2.5 (+1) | 1,100 (-6%) | 18mo | $268,000 | $244 | 35 |
| 160 Belair Dr | 0.52mi | 2/2.0 | 1,342 (+14%) | 24mo | $249,900 | $186 | 30 |
Match score weights: distance 35% · size 25% · config 20% · recency 20%. Top-matched comps best support the ARV.
Projected returns pro-forma
-3.0% appreciation · 3.0% rent growth · sell at horizon
- IRR
- -6.0%
- Equity multiple
- 0.78×
- Total profit
- $-8,489
- Equity at exit
- $20,129
- IRR
- 3.5%
- Equity multiple
- 1.26×
- Total profit
- $9,701
- Equity at exit
- $11,672
Cash invested: $37,800 (down + closing). Projections, not guarantees.
Landlord ↔ Tenant lean methodology
- Overall (STATE)
- 85 Strongly Landlord-Friendly
- State North Carolina
- 85 Strongly Landlord-Friendly · R+3
- County
- — inherits STATE
- City
- — inherits STATE
ZIP-level market 27030
- Active inventory
- 215
- Price-to-rent
- 8.7×
Monthly cashflow live
- Estimated rent
- $1,300 medium interval (Pro) →
- Mortgage (P&I)
- −$708
- Tax from tax record
- −$52 /mo · $620/yr
- Insurance
- −$56
- HOA
- −$0
- Vacancy / Maint / Mgmt
- −$273
- Net cashflow
- $211
Break-even live
Sensitivity live
| Price | -10% $287 | -5% $249 | +0% $211 | +5% $173 | +10% $135 |
|---|---|---|---|---|---|
| Rent | -10% $108 | -5% $160 | +0% $211 | +5% $262 | +10% $314 |
| Rate | -1.0pp $279 | -0.5pp $245 | base $211 | +0.5pp $176 | +1.0pp $140 |
UW: 25.0% down · 7.5% · 30yr · 1.5% tax · 5.0% vac · 8.0% maint · 8.0% mgmt
Financing live
Cash to close
- Down payment
- $33,750
- Closing costs
- $4,050
- Reserves months
- —
- Total cash needed
- —
Loan-product check · same deal, 3 products live
Conventional
25% down · 7.5% · 30yr
- Down + closing
- —
- Monthly P&I
- —
- Monthly cashflow
- —
- DSCR
- —
- Eligible?
- —
Personal DTI + credit; lowest rate.
DSCR
20% down · 8.5% · 30yr
- Down + closing
- —
- Monthly P&I
- —
- Monthly cashflow
- —
- DSCR
- —
- Eligible?
- —
No personal income docs; deal must DSCR.
Hard money
10% down · 12.0% · 12mo
- Down + closing
- —
- Monthly P&I
- —
- Monthly cashflow
- —
- DSCR
- —
- Eligible?
- —
Short-term bridge; refi at stabilization.
Rent comps 2 comps
| Address | Beds | Baths | Sqft | Rent | $/sqft | DOM | Units | Dist |
|---|---|---|---|---|---|---|---|---|
| 335 Willow St Mount Airy, NC | 1.0–2.0 | 1.0–2.0 | 815 | $1,641 | $2.01 | 45d | 9 | 1.11mi |
| 148 Churchill Ln Mt Airy, NC | 2.0 | 1.0 | 960 | $1,150 | $1.20 | 45d | 1 | 1.35mi |
Listing history 2 events
-
2026-05-01status Pending
-
2026-04-22$135,000 Active
ⓘ Source: listings_history table (triggers on properties + properties_extension) + one-shot
backfill from property_details.listing_events for pre-trigger history.
Tax reassessment forecast NC · Resets to sale price
- Current annual tax
- $620 · $52/mo
- Projected year-2 tax
- $1,107 · $92/mo
- Expected delta
- +$487/yr (+$41/mo · 78.6%)
ⓘ Screening estimate from a state-policy table — verify with the county assessor before closing.
Climate risk First Street
- Flood 1/10 Low FEMA zone X (unshaded) · 0% chance over 30 yrs
- Wildfire 3/10 Moderate
- Heat 5/10 Major 7 d/yr ≥100°F today · 19 d/yr by 30 yrs out
- Wind 2/10 Low 100% chance of damaging wind over 30 yrs
- Air quality 1/10 Low 0 unhealthy d/yr today · 0 by 30 yrs out
Nearby sold comps map
Loading sold comps map…
Walkable amenities ~0.75 mi
Loading nearby amenities…
Taxation est. · year 1
- Rental income
- $15,598
- − Mortgage interest
- −$7,562
- − Property taxes
- −$620
- − Insurance
- −$675
- − Repairs & maintenance
- −$1,248
- − Management
- −$1,248
- − Depreciation
- −$3,927
- Taxable income
- $318
- Est. tax owed @ 24.0%
- −$76
- After-tax cash flow
- $2,456/yr
For passive investors: Depreciation is non-cash, so a rental often shows a tax loss while cash-flowing — sheltering income. Rental losses are passive: they offset passive income freely, and up to $25,000/yr can offset ordinary (W-2) income if you actively participate and your MAGI is under $100k (phasing out to $0 by $150k); unused losses carry forward. On sale, claimed depreciation is recaptured at up to 25%, and gains may owe capital-gains tax (a 1031 exchange can defer both). Figures are a year-1 estimate at your 24.0% rate — not tax advice; consult a CPA.
Schools (NCES district)
- District
- Surry County Schools
- NCES district ID
- 3704410
- Math proficiency
- 52% ▲ 4.00%
- Reading proficiency
- 52% ▲ 2.00%
- Median HH income
- $37,488
- Composite
- 43.26/100
- National rank
- #3054
- State rank
- #60 of 178 in NC
Livability — Toast
- Score
- 61/100
- State rank
- #485
- US rank
- #17799
Category grades
Schools grade is shown separately in the Schools card above.
Census & demographics
- Census place
- Toast, NC
- County
- Surry County · 36,241 people
- City population
- 36,350
- Metro
- Mount Airy, NC
- Population (ZIP)
- 36,241
- Household income
- $46,377
- Rent vs Own
- Severe rent burden
- 939.0
Population outlook (Surry County) Hauer SSP2
- Today (2025)
- 69,473 people
- By 2030
- 66,964 · -3.6%
- By 2040
- 60,967 · -12.2%
- By 2050
- 54,102 · -22.1%
- By 2075
- 38,806 · -44.1%
- By 2100
- 24,711 · -64.4%
Race, ethnicity, and origin ACS 2023
- Neighborhood character
- Predominantly White (83%)
- Race & ethnicity
- White 83% Hispanic / Latino 9% Two or more races 5% Black 5%
- Hispanic origin (detail)
- Mexican 7%
- Common ancestry
- Serbian 2% Slovak 2% Italian 1%
- Foreign-born
- 4% · Canada
- Languages at home
- 92% English-only · Spanish 6% Other Asian/Pacific 1%
Political lean MEDSL · Surry
- 2024 margin
- Solid R (+53.3) · D 23.0% · R 76.3%
- 2008→2024 swing
- -25.4pp toward R · 2008: -28.0pp · 2024: -53.3pp
- All cycles
- 2024: R+53.3 2020: R+51.4 2016: R+50.7 2012: R+36.9 2008: R+28.0
Not yet ingested
- Civics
- —
Market trends
- HPI YoY
- ▼ -132.64%
- Current HPI
- 177.1549
- Rent YoY
- —
- Metro
- Mount Airy, NC
- State GDP YoY
- ▲ 3.28%
- F500 in state
- 26
Industry mix (Fortune 500 HQ in NC)
| Industry | F500 HQs | Revenue |
|---|---|---|
| Financial Services | 2 | $213B |
|
||
| Retail | 2 | $95B |
|
||
| Industrial Conglomerate | 1 | $38B |
|
||
| Metals / Steel | 1 | $35B |
|
||
| Utilities | 1 | $30B |
|
||
| Industrial Machinery | 1 | $19B |
|
||
Price history
2 events — show timeline
- 2026-05-01 Pending — Triad MLS
- 2026-04-22 Listed $135,000 Triad MLS
Property tax history
+2.1%/yrLatest (2025): $620 · +13.3% YoY. Source: county tax records.
Cash-flow waterfall
monthlySold comps — $/sqft
last 12 mo · ≤1 miLoading sold comps…