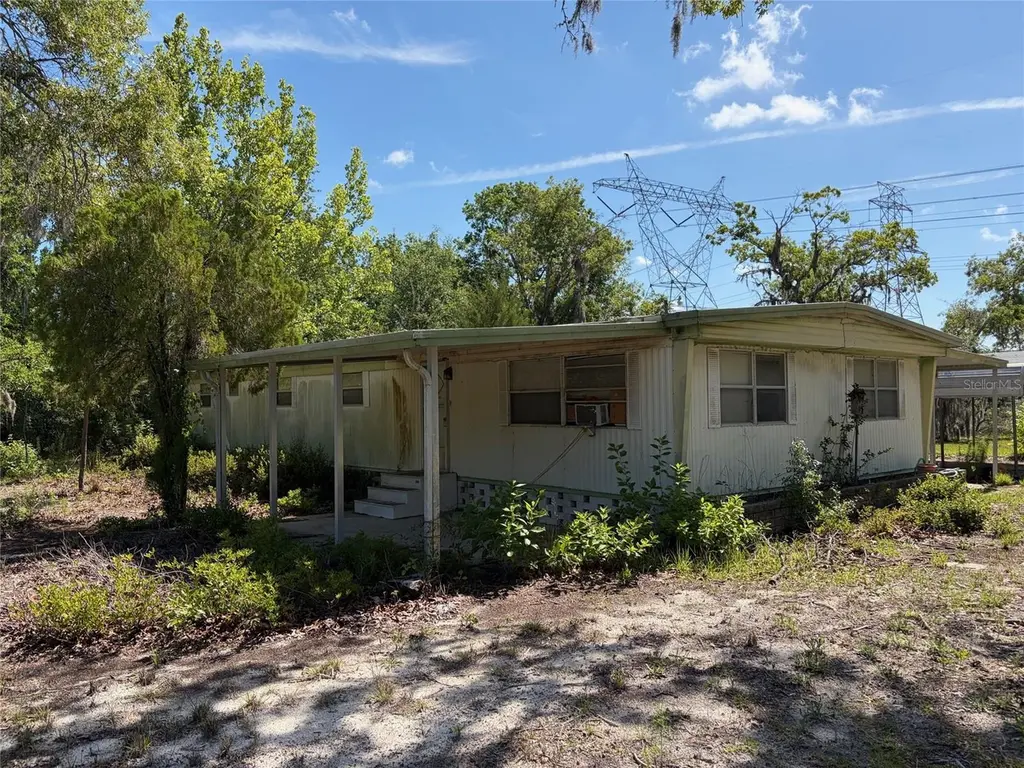
18054 Manteno Dr · Shady Hills, FL
Flood risk 1/10 · Minimal
- FEMA flood zone
- X (unshaded)
- Chance of flooding over 30 yrs
- 0.0%
- Est. flood insurance / yr
- $507 – $1,088
Fire risk 4/10 · Minor
- Est. fire insurance / yr
- $947 – $1,759
Heat risk 10/10 · Severe
- Hot days now (above 108°F)
- 6 days/yr
- Hot days in 30 yrs
- 20 days/yr
Wind risk 10/10 · Severe
- Chance of severe wind over 30 yrs
- 99.0%
Air-quality risk 2/10 · Minimal
- Unhealthy air days now
- 1 days/yr
- Unhealthy air days in 30 yrs
- 3 days/yr
Risk factors via First Street. Map © Google.
Why this score? — see what drove the B grade
The composite is a weighted blend of 9 inputs, each scored 0–100. Each bar is that input's sub-score; the figure is the points it added to the 100-point composite (weight × sub-score).
- Cash flow +30.0/30.0
- 1% rule +10.0/10.0
- DSCR +10.0/10.0
- ARV discount +7.5/15.0
- Schools +4.3/10.0
- Livability +3.5/5.0
- Rent growth +2.5/5.0
- Condition / age +2.5/5.0
- Appreciation +0.0/10.0
$130,000
🖨 Deal sheet 📄 Offer letter ✓ Due diligence
Listing remarks
“Investor special with endless potential — and a healthy dose of imagination required! Situated on 1.17 private acres, this 3 bedroom, 2 bath mobile home offers a huge living room, two detached garages with overhead doors, a metal pole carport, and an oversized screened area (screening currently auditioning for retirement). Two Large Sheds with Electric. The mobile home needs major repairs including flooring, roof, and A/C. Property will convey as-is, where-is, with remaining trash and debris staying behind per owner. For the right buyer, this could be a rewarding flip, rental project, or future homesite. Bring your tools, your dumpster, and your vision!” Location Locatio
Key facts
- 1.14 acre lot
- 2 parking spots
- Built 1973
Property features AI
Finance
- Other: Property type: Residential mobile home; Property subtype: Mobile Home (double wide); Zoning: AR; Lot size about 1.14 acres (1 to less than 2 acres)
- HOA & community: No association
Exterior
- Parking: Carport with 2 spaces
- Utilities: Well water; Septic tank; Cable available; Electricity connected; Fire hydrant nearby
- Home design: Residential mobile home (double wide); One story; East-facing
- Construction: Metal siding; Shingle roof; Crawlspace foundation
- Exterior features: Private mailbox; Storage; Chain link and other fencing; Paved road access
Interior
- Kitchen: No built-in appliances listed
- Bedrooms: 3 bedrooms
- Flooring: Carpet; Laminate
- Bathrooms: 2 full bathrooms
- Heating & cooling: Central heating; Wall/window air conditioning units
- Interior features: Ceiling fans; Eat-in kitchen; Walk-in closets
- Laundry & utility: Laundry room; Outdoor laundry access
Neighborhood map
What this means for you Summary
Snapshot
- This is a 3-bed/2.0-bath manufactured listed at $130k.
Deal economics
- At list price, monthly cash flow is $955 ($11k/yr) — positive.
- The deal already cash-flows at list — no discount required.
- Meets the 1% rule at list price ($2k rent vs $130k).
- Cap rate 15.1% vs local median 3.5% in Shady Hills — top-decile yield for the area; either an underpriced asset or a hidden risk that comps aren't pricing in. Stress-test before assuming the spread holds.
Location & tenants
- Location reads 69/100 on livability (#467 in FL) — a middle-class / working-renter tenant base. Strengths: cost of living A+, housing A+; Watch: employment C-, health & safety C-, commute D+.
- Pasco (suburban): math 50% / reading 52% proficiency, ranked #32 of 73 in FL (top 44%) — acceptable for families but not a draw, mixed tenant base, ~2y average lease.
- Zoned schools: Shady Hills Elementary School (math 48% / reading 45%, grade D-, #1,223 of 2,144 statewide, top 57%, 471 students, 77% FRL); Hudson High School (math 45% / reading 40%, grade F, #264 of 667 statewide, top 41%, 1,387 students, 66% FRL) — zoned schools average 71% FRL vs 48% district-wide (23 pts higher); higher-poverty schools than district average — tighter screening recommended.
- Market conditions: 252 active listings in the ZIP; 6,765 units permitted in Pasco County in 2024 (1,250 in 5+ unit buildings).
Forward outlook
- Local home prices are declining (-3.0%/yr); year-one equity from $899 of loan paydown is wiped out by about $4k of value loss. Plan a longer hold.
- Pasco County population projected at +29% by 2050 — long-run rental-demand tailwind backs the buy-and-hold thesis.
- At projected returns (-3.0% appreciation + 3.0% rent growth), your $36k cash investment doubles in ~4 years — after that, you're playing with house money.
Negotiation context
- Only 1 days on market — expect competitive offers; lowballing is unlikely to land.
- Current owner paid $40k; list at $130k implies a 228% gain — meaningful room to come down on a strong offer.
Risks & watch-outs
- Climate carrying-cost: severe wind risk, 99% chance of damaging wind over 30y; extreme-heat days projected 6→20/yr by 2055 (HVAC capex compounding) — expect insurance premiums to compound above CPI over the hold.
Questions for the listing agent
- Built in 1973 — when were the roof, HVAC, electrical panel, plumbing, and water heater last replaced?
- Is there a deadline driving the sale (1031 exchange, divorce, estate, relocation)? That informs how much negotiation room exists.
- Schools are F-rated, which usually means shorter tenancies and higher turnover. Who's the typical renter profile here, and what's been the actual vacancy rate?
- What's the average days-on-market for RENTAL listings here right now (not sales)? A rising rental-DOM trend means longer vacancies and softer asking-rent achievability than the comps imply.
- What's the recent tenant-quality profile in this submarket — average credit score on applications, eviction rate, late-payment / NSF rate, and stable-employment percentage? A property-management company in the area should have these aggregated.
- How much new for-sale + rental construction is in the pipeline within 1–3 miles? Heavy new supply typically softens prices + rents 12–24 months out; constrained supply supports both.
Investment metrics
- 1% rule
- 1.69% ✓
- Cap rate
- 15.11%
- Cash-on-cash
- 31.48%
- DSCR
- 2.40
- GRM
- 4.9
CMA / ARV
- ARV (on-the-fly)
- $333,792
- Comps found
- 2
Show comp detail 2 sales within ~0.75 mi
| Address | Dist | Beds/Ba | Sqft | Sold | Price | $/sf | Match |
|---|---|---|---|---|---|---|---|
| 17741 Nicks Dr | 0.58mi | 3/2.0 | 1,404 (-4%) | 16mo | $320,000 | $228 | 53 |
| 18031 Applejack Ct | 0.72mi | 3/2.0 | 1,560 (+7%) | 11mo | $285,000 | $183 | 47 |
Match score weights: distance 35% · size 25% · config 20% · recency 20%. Top-matched comps best support the ARV.
Projected returns pro-forma
-3.0% appreciation · 3.0% rent growth · sell at horizon
- IRR
- 26.3%
- Equity multiple
- 2.09×
- Total profit
- $39,708
- Equity at exit
- $19,383
- IRR
- 34.0%
- Equity multiple
- 4.10×
- Total profit
- $112,716
- Equity at exit
- $11,240
Cash invested: $36,400 (down + closing). Projections, not guarantees.
Landlord ↔ Tenant lean methodology
- Overall (STATE)
- 87 Strongly Landlord-Friendly
- State Florida
- 87 Strongly Landlord-Friendly · R+3
- County
- — inherits STATE
- City
- — inherits STATE
ZIP-level market 34610
- Home prices YoY
- -13.8%
- Active inventory
- 252
- Price-to-rent
- 4.9×
Monthly cashflow live
- Estimated rent
- $2,192 medium interval (Pro) →
- Mortgage (P&I)
- −$682
- Tax from tax record
- −$41 /mo · $492/yr
- Insurance
- −$54
- HOA
- −$0
- Vacancy / Maint / Mgmt
- −$460
- Net cashflow
- $955
Break-even live
UW: 25.0% down · 7.5% · 30yr · 1.5% tax · 5.0% vac · 8.0% maint · 8.0% mgmt
Financing live
Cash to close
- Down payment
- $32,500
- Closing costs
- $3,900
- Reserves months
- —
- Total cash needed
- —
Loan-product check · same deal, 3 products live
Conventional
25% down · 7.5% · 30yr
- Down + closing
- —
- Monthly P&I
- —
- Monthly cashflow
- —
- DSCR
- —
- Eligible?
- —
Personal DTI + credit; lowest rate.
DSCR
20% down · 8.5% · 30yr
- Down + closing
- —
- Monthly P&I
- —
- Monthly cashflow
- —
- DSCR
- —
- Eligible?
- —
No personal income docs; deal must DSCR.
Hard money
10% down · 12.0% · 12mo
- Down + closing
- —
- Monthly P&I
- —
- Monthly cashflow
- —
- DSCR
- —
- Eligible?
- —
Short-term bridge; refi at stabilization.
Listing history 3 events
-
2026-05-21status Pending
-
2026-05-21$130,000 Active
-
1993-12-13soldstatus $39,600
ⓘ Source: listings_history table (triggers on properties + properties_extension) + one-shot
backfill from property_details.listing_events for pre-trigger history.
Tax reassessment forecast FL · Resets to sale price
- Current annual tax
- $492 · $41/mo
- Projected year-2 tax
- $1,079 · $90/mo
- Expected delta
- +$587/yr (+$49/mo · 119.3%)
ⓘ Screening estimate from a state-policy table — verify with the county assessor before closing.
Climate risk First Street
- Flood 1/10 Low FEMA zone X (unshaded) · 0% chance over 30 yrs
- Wildfire 4/10 Moderate
- Heat 10/10 Extreme 6 d/yr ≥108°F today · 20 d/yr by 30 yrs out
- Wind 10/10 Extreme 99% chance of damaging wind over 30 yrs
- Air quality 2/10 Low 1 unhealthy d/yr today · 3 by 30 yrs out
Nearby sold comps map
Loading sold comps map…
Walkable amenities ~0.75 mi
Loading nearby amenities…
Taxation est. · year 1
- Rental income
- $26,305
- − Mortgage interest
- −$7,282
- − Property taxes
- −$492
- − Insurance
- −$650
- − Repairs & maintenance
- −$2,104
- − Management
- −$2,104
- − Depreciation
- −$3,782
- Taxable income
- $9,890
- Est. tax owed @ 24.0%
- −$2,374
- After-tax cash flow
- $9,084/yr
For passive investors: Depreciation is non-cash, so a rental often shows a tax loss while cash-flowing — sheltering income. Rental losses are passive: they offset passive income freely, and up to $25,000/yr can offset ordinary (W-2) income if you actively participate and your MAGI is under $100k (phasing out to $0 by $150k); unused losses carry forward. On sale, claimed depreciation is recaptured at up to 25%, and gains may owe capital-gains tax (a 1031 exchange can defer both). Figures are a year-1 estimate at your 24.0% rate — not tax advice; consult a CPA.
Schools (NCES district)
- District
- Pasco
- NCES district ID
- 1201530
- Math proficiency
- 50% ▼ -10.00%
- Reading proficiency
- 52% ▼ -5.00%
- Median HH income
- $45,039
- Composite
- 43.14/100
- National rank
- #3074
- State rank
- #32 of 73 in FL
Livability — Shady Hills
- Score
- 69/100
- State rank
- #467
- US rank
- #8437
Category grades
Schools grade is shown separately in the Schools card above.
Census & demographics
- Census place
- Shady Hills, FL
- Population (ZIP)
- 16,544
Population outlook (Pasco County) Hauer SSP2
- Today (2025)
- 570,045 people
- By 2030
- 605,844 · +6.3%
- By 2040
- 674,806 · +18.4%
- By 2050
- 736,022 · +29.1%
- By 2075
- 862,900 · +51.4%
- By 2100
- 906,364 · +59.0%
Race, ethnicity, and origin ACS 2023
- Neighborhood character
- Predominantly White (76%)
- Race & ethnicity
- White 76% Hispanic / Latino 17% Two or more races 12% Asian 2% Black 2%
- Hispanic origin (detail)
- Mexican 2% Puerto Rican 4% Cuban 3%
- Common ancestry
- Romanian 3% Serbian 2% Slovak 2%
- Foreign-born
- 11% · Canada, Jamaica, Vietnam
- Languages at home
- 85% English-only · Spanish 12% Other Indo-European 1% Vietnamese 1%
Political lean MEDSL · Pasco
- 2024 margin
- Strong R (+25.2) · D 36.9% · R 62.1% · Other 1.0%
- 2008→2024 swing
- -21.6pp toward R · 2008: -3.6pp · 2024: -25.2pp
- All cycles
- 2024: R+25.2 2020: R+20.1 2016: R+21.6 2012: R+6.7 2008: R+3.6
Not yet ingested
- Civics
- —
Market trends
- HPI YoY
- ▼ -55.13%
- Current HPI
- 342.8714
- Rent YoY
- —
- Metro
- —
- State GDP YoY
- ▲ 3.28%
- F500 in state
- 36
Industry mix (Fortune 500 HQ in FL)
| Industry | F500 HQs | Revenue |
|---|---|---|
| Industrial Technology | 2 | $29B |
|
||
| Insurance | 2 | $17B |
|
||
| Retail | 1 | $60B |
|
||
| Technology Distribution | 1 | $58B |
|
||
| Homebuilding | 1 | $35B |
|
||
| Technology Manufacturing | 1 | $35B |
|
||
Price history
+228.3% since first listed3 events — show timeline
- 2026-05-21 Pending — Stellar MLS as Distributed by MLS Grid
- 2026-05-21 Listed $130,000 Stellar MLS as Distributed by MLS Grid
- 1993-12-13 Sold (Public Records) $39,600 Public Records
Property tax history
+3.9%/yrLatest (2025): $492 · +5.9% YoY. Source: county tax records.
Cash-flow waterfall
monthlySold comps — $/sqft
last 12 mo · ≤1 miLoading sold comps…