864 Upper Montague Rd · Bowie, TX
Flood risk 1/10 · Minimal
- FEMA flood zone
- X (unshaded)
- Chance of flooding over 30 yrs
- 0.0%
- Est. flood insurance / yr
- $507 – $1,088
Fire risk 7/10 · Major
- Est. fire insurance / yr
- $1,222 – $2,270
Heat risk 6/10 · Moderate
- Hot days now (above 108°F)
- 7 days/yr
- Hot days in 30 yrs
- 20 days/yr
Wind risk 4/10 · Minor
- Chance of severe wind over 30 yrs
- 14.0%
Air-quality risk 1/10 · Minimal
- Unhealthy air days now
- 0 days/yr
- Unhealthy air days in 30 yrs
- 0 days/yr
Risk factors via First Street. Map © Google.
Why this score? — see what drove the D+ grade
The composite is a weighted blend of 9 inputs, each scored 0–100. Each bar is that input's sub-score; the figure is the points it added to the 100-point composite (weight × sub-score).
- Cash flow +19.9/30.0
- ARV discount +7.5/15.0
- DSCR +6.3/10.0
- 1% rule +4.2/10.0
- Schools +3.2/10.0
- Livability +3.2/5.0
- Rent growth +2.5/5.0
- Condition / age +2.5/5.0
- Appreciation +0.0/10.0
$95,000
🖨 Deal sheet 📄 Offer letter ✓ Due diligence
Listing remarks
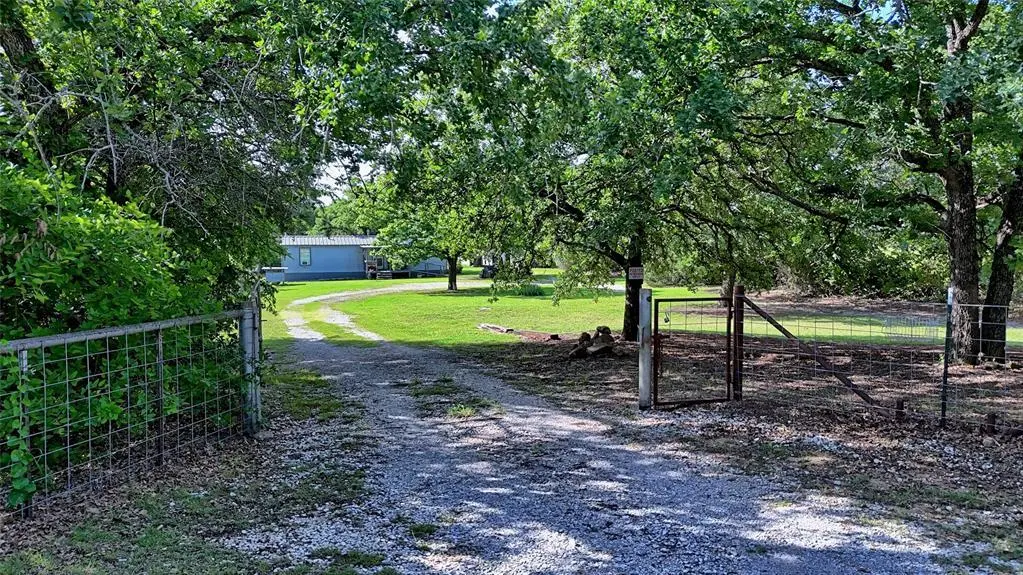
Enjoy the perfect blend of country living and everyday convenience with this charming 2-1 mobile, situated on one-acre of land, located just outside of town on a paved county road. Surrounded by mature trees and lush green space, the nicely maintained grounds feature a gated entrance, storage building; cross-fencing provides a small livestock pen, and former chicken coops could be easily made ready for use. There are plenty of suitable areas for gardening. Larger neighboring tracts and a tree-lined boundary create a private, secluded setting. The property has an improved well, refurbished septic system, and a durable metal roof in good condition. Conveniently located near schools and shoppi
Key facts
- Cross-fencing
- Gated entrance
- Small livestock pen
Tags
Property features AI
Finance
- Other: Aerial photo and survey available; Personal items excluded; refrigerator and range convey, other appliances/furniture may be negotiable; no minerals convey
- Financial info: Listing is For Sale (cash or conventional financing accepted)
- HOA & community: No association
Exterior
- Parking: Driveway; Gravel parking
- Utilities: Asphalt access; Co-op electric; Septic system; Well water
- Home design: Single-family residence; One story; Accessible approach with ramp; Attached
- Construction: Metal roof; Metal siding; Pillar/post/pier foundation; Built in 1991
- Exterior features: Covered porch(es); Covered patio/porch; Gray water system; Stable/barn; Barbed wire and pipe fencing; Cleared, grassed, and partially wooded vegetation; Large backyard with grass; Pasture
Interior
- Kitchen: Gas range; Refrigerator; Water filter
- Bedrooms: 2 bedrooms (primary bedroom on main level)
- Flooring: Carpet; Laminate
- Bathrooms: 1 full bathroom
- Heating & cooling: Space heater; Window unit(s)
- Interior features: Eat-in kitchen; Window coverings
- Laundry & utility: Full-size washer/dryer area; Electric water heater
Neighborhood map
What this means for you Summary
Snapshot
- This is a 2-bed/1.0-bath manufactured listed at $95k.
Deal economics
- At list price, monthly cash flow is $114 ($1k/yr) — positive.
- The deal already cash-flows at list — no discount required.
- To meet the 1% rule (rent ≥ 1% of price), the offer needs to be $88k (7.9% below list).
- Recommended offer: $88k (7.9% below list) — sets the bar for 1% rule.
- Cap rate 7.7% vs local median 3.1% in Bowie — top-decile yield for the area; either an underpriced asset or a hidden risk that comps aren't pricing in. Stress-test before assuming the spread holds.
Location & tenants
- Location reads 64/100 on livability (#796 in TX) — a middle-class / working-renter tenant base. Strengths: cost of living A+, housing A+; Watch: health & safety C-, amenities F, commute F.
- Bowie ISD (town): math 34% / reading 41% proficiency, ranked #469 of 826 in TX (top 57%) — families likely to look elsewhere, expect single-tenant / working-renter base with shorter leases.
- Zoned schools: Bowie El (422 students, 65% FRL) — zoned schools average 65% FRL vs 42% district-wide (24 pts higher); higher-poverty schools than district average — tighter screening recommended.
- Market conditions: 238 active listings in the ZIP; 1 comparable units currently listed for rent nearby; 23 units permitted in Montague County in 2024 (0 in 5+ unit buildings).
Forward outlook
- Local home prices are declining (-3.0%/yr); year-one equity from $657 of loan paydown is wiped out by about $3k of value loss. Plan a longer hold.
- Montague County population projected at -15% by 2050 — secular population decline; favor cash flow + early exit over multi-decade hold.
Negotiation context
- Only 8 days on market — expect competitive offers; lowballing is unlikely to land.
Risks & watch-outs
- Climate carrying-cost: major wildfire risk; extreme-heat days projected 7→20/yr by 2055 (HVAC capex compounding) — expect insurance premiums to compound above CPI over the hold.
Questions for the listing agent
- Is there a deadline driving the sale (1031 exchange, divorce, estate, relocation)? That informs how much negotiation room exists.
- Schools are D-rated, which usually means shorter tenancies and higher turnover. Who's the typical renter profile here, and what's been the actual vacancy rate?
- The area grade is low — what's the realistic commute time and amenity access for the typical tenant pool here? Any planned neighborhood developments (good or bad) we should know about?
- What's the average days-on-market for RENTAL listings here right now (not sales)? A rising rental-DOM trend means longer vacancies and softer asking-rent achievability than the comps imply.
- What's the recent tenant-quality profile in this submarket — average credit score on applications, eviction rate, late-payment / NSF rate, and stable-employment percentage? A property-management company in the area should have these aggregated.
- How much new for-sale + rental construction is in the pipeline within 1–3 miles? Heavy new supply typically softens prices + rents 12–24 months out; constrained supply supports both.
Investment metrics
- 1% rule
- 0.92% ✗
- Cap rate
- 7.74%
- Cash-on-cash
- 5.15%
- DSCR
- 1.23
- GRM
- 9.0
CMA / ARV
No comps found within radius.
Projected returns pro-forma
-3.0% appreciation · 3.0% rent growth · sell at horizon
- IRR
- -8.3%
- Equity multiple
- 0.69×
- Total profit
- $-8,156
- Equity at exit
- $14,165
- IRR
- 1.1%
- Equity multiple
- 1.08×
- Total profit
- $2,119
- Equity at exit
- $8,214
Cash invested: $26,600 (down + closing). Projections, not guarantees.
Landlord ↔ Tenant lean methodology
- Overall (STATE)
- 87 Strongly Landlord-Friendly
- State Texas
- 87 Strongly Landlord-Friendly · R+5
- County
- — inherits STATE
- City
- — inherits STATE
ZIP-level market 76230
- Home prices YoY
- -27.1%
- Active inventory
- 238
- Price-to-rent
- 9.0×
Monthly cashflow live
- Estimated rent
- $875 medium interval (Pro) →
- Mortgage (P&I)
- −$498
- Tax from tax record
- −$39 /mo · $471/yr
- Insurance
- −$40
- HOA
- −$0
- Vacancy / Maint / Mgmt
- −$184
- Net cashflow
- $114
Break-even live
UW: 25.0% down · 7.5% · 30yr · 1.5% tax · 5.0% vac · 8.0% maint · 8.0% mgmt
Financing live
Cash to close
- Down payment
- $23,750
- Closing costs
- $2,850
- Reserves months
- —
- Total cash needed
- —
Loan-product check · same deal, 3 products live
Conventional
25% down · 7.5% · 30yr
- Down + closing
- —
- Monthly P&I
- —
- Monthly cashflow
- —
- DSCR
- —
- Eligible?
- —
Personal DTI + credit; lowest rate.
DSCR
20% down · 8.5% · 30yr
- Down + closing
- —
- Monthly P&I
- —
- Monthly cashflow
- —
- DSCR
- —
- Eligible?
- —
No personal income docs; deal must DSCR.
Hard money
10% down · 12.0% · 12mo
- Down + closing
- —
- Monthly P&I
- —
- Monthly cashflow
- —
- DSCR
- —
- Eligible?
- —
Short-term bridge; refi at stabilization.
Rent comps 1 comps
| Address | Beds | Baths | Sqft | Rent | $/sqft | DOM | Units | Dist |
|---|---|---|---|---|---|---|---|---|
| 309 E Nelson St Unit B Bowie, TX | 1.0 | 1.0 | 680 | $875 | $1.29 | 1d | 1 | 1.38mi |
Listing history 7 events
-
2026-06-18days on market $95,000 Active 8 DOM
-
2026-06-17days on market $95,000 Active 7 DOM
-
2026-06-16days on market $95,000 Active 6 DOM
-
2026-06-15days on market $95,000 Active 5 DOM
-
2026-06-13days on market $95,000 Active 3 DOM
-
2026-06-12remarks 699-char remark
-
2026-06-12$95,000 Active 2 DOM
ⓘ Source: listings_history table (triggers on properties + properties_extension) + one-shot
backfill from property_details.listing_events for pre-trigger history.
Tax reassessment forecast TX · Resets to sale price
- Current annual tax
- $471 · $39/mo
- Projected year-2 tax
- $1,738 · $145/mo
- Expected delta
- +$1,267/yr (+$106/mo · 268.9%)
ⓘ Screening estimate from a state-policy table — verify with the county assessor before closing.
Climate risk First Street
- Flood 1/10 Low FEMA zone X (unshaded) · 0% chance over 30 yrs
- Wildfire 7/10 Severe
- Heat 6/10 Major 7 d/yr ≥108°F today · 20 d/yr by 30 yrs out
- Wind 4/10 Moderate 14% chance of damaging wind over 30 yrs
- Air quality 1/10 Low 0 unhealthy d/yr today · 0 by 30 yrs out
Nearby sold comps map
Loading sold comps map…
Walkable amenities ~0.75 mi
Loading nearby amenities…
Taxation est. · year 1
- Rental income
- $10,500
- − Mortgage interest
- −$5,321
- − Property taxes
- −$471
- − Insurance
- −$475
- − Repairs & maintenance
- −$840
- − Management
- −$840
- − Depreciation
- −$2,764
- Taxable loss
- −$211
- Est. tax savings @ 24.0%
- +$51
- After-tax cash flow
- $1,421/yr
For passive investors: Depreciation is non-cash, so a rental often shows a tax loss while cash-flowing — sheltering income. Rental losses are passive: they offset passive income freely, and up to $25,000/yr can offset ordinary (W-2) income if you actively participate and your MAGI is under $100k (phasing out to $0 by $150k); unused losses carry forward. On sale, claimed depreciation is recaptured at up to 25%, and gains may owe capital-gains tax (a 1031 exchange can defer both). Figures are a year-1 estimate at your 24.0% rate — not tax advice; consult a CPA.
Schools (NCES district)
- District
- Bowie ISD
- NCES district ID
- 4810990
- Math proficiency
- 34% ▼ -8.00%
- Reading proficiency
- 41% ▼ -2.00%
- Median HH income
- $45,720
- Composite
- 31.99/100
- National rank
- #5836
- State rank
- #469 of 826 in TX
Livability — Bowie
- Score
- 64/100
- State rank
- #796
- US rank
- #14499
Category grades
Schools grade is shown separately in the Schools card above.
Census & demographics
- Population (ZIP)
- 9,885
Population outlook (Montague County) Hauer SSP2
- Today (2025)
- 18,216 people
- By 2030
- 17,603 · -3.4%
- By 2040
- 16,451 · -9.7%
- By 2050
- 15,424 · -15.3%
- By 2075
- 13,365 · -26.6%
- By 2100
- 10,998 · -39.6%
Race, ethnicity, and origin ACS 2023
- Neighborhood character
- Predominantly White (83%)
- Race & ethnicity
- White 83% Hispanic / Latino 12% Two or more races 7%
- Hispanic origin (detail)
- Mexican 12%
- Common ancestry
- Serbian 2% Romanian 2% Slovak 1%
- Foreign-born
- 4% · Canada
- Languages at home
- 89% English-only · Spanish 10% Other Indo-European 1%
Political lean MEDSL · Montague
- 2024 margin
- Solid R (+77.7) · D 10.9% · R 88.5%
- 2008→2024 swing
- -19.2pp toward R · 2008: -58.5pp · 2024: -77.7pp
- All cycles
- 2024: R+77.7 2020: R+76.6 2016: R+77.2 2012: R+70.1 2008: R+58.5
Not yet ingested
- Civics
- —
Market trends
- HPI YoY
- ▼ -75.69%
- Current HPI
- 204.0919
- Rent YoY
- —
- Metro
- —
- State GDP YoY
- ▲ 3.95%
- F500 in state
- 110
Industry mix (Fortune 500 HQ in TX)
| Industry | F500 HQs | Revenue |
|---|---|---|
| Energy | 16 | $1,198B |
|
||
| Technology | 5 | $198B |
|
||
| Engineering / Construction | 4 | $72B |
|
||
| Energy Services | 3 | $60B |
|
||
| Utilities | 3 | $41B |
|
||
| Healthcare | 2 | $330B |
|
||
Price history
3 events — show timeline
- 2026-06-10 Listed $95,000 NTREIS
- 2012-01-31 Sold (Public Records) — Public Records
- 2002-12-11 Sold (Public Records) — Public Records
Property tax history
+9.7%/yrLatest (2025): $471 · +10.0% YoY. Source: county tax records.
Cash-flow waterfall
monthlySold comps — $/sqft
last 12 mo · ≤1 miLoading sold comps…