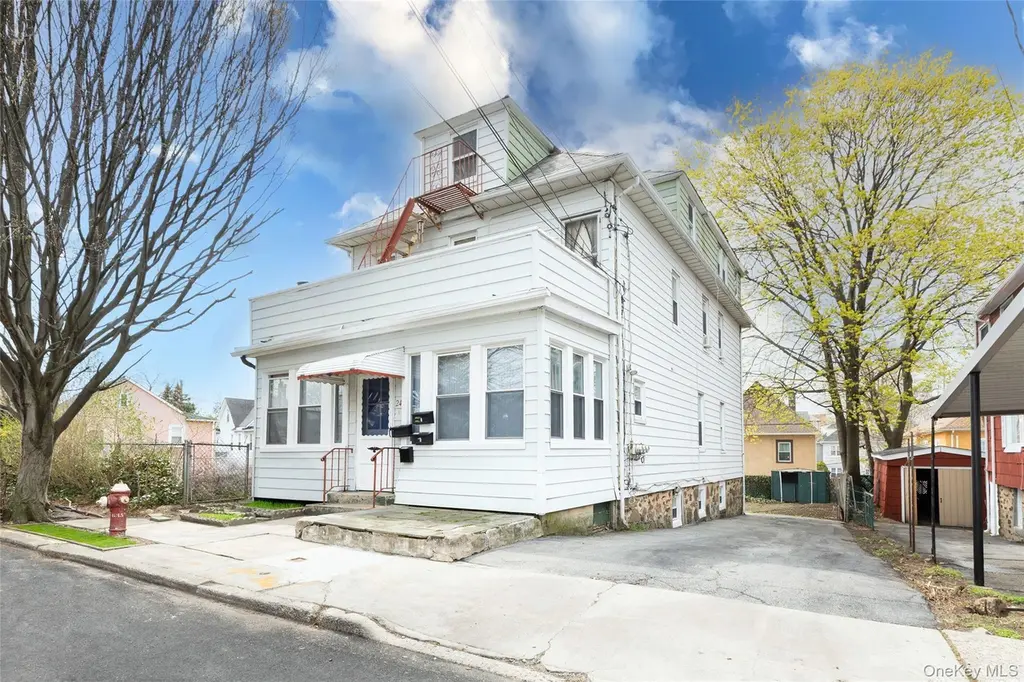
 Triplex
24 Chestnut Pl · Mount Vernon, NY
Flood risk 1/10 · Minimal
- FEMA flood zone
- X (unshaded)
- Chance of flooding over 30 yrs
- 0.0%
- Est. flood insurance / yr
- $507 – $1,088
Fire risk 1/10 · Minimal
- Est. fire insurance / yr
- $691 – $1,283
Heat risk 6/10 · Moderate
- Hot days now (above 98°F)
- 7 days/yr
- Hot days in 30 yrs
- 15 days/yr
Wind risk 6/10 · Moderate
- Chance of severe wind over 30 yrs
- 27.0%
Air-quality risk 5/10 · Moderate
- Unhealthy air days now
- 6 days/yr
- Unhealthy air days in 30 yrs
- 8 days/yr
Risk factors via First Street. Map © Google.
Why this score? — see what drove the C- grade
The composite is a weighted blend of 9 inputs, each scored 0–100. Each bar is that input's sub-score; the figure is the points it added to the 100-point composite (weight × sub-score).
- Cash flow +19.6/30.0
- ARV discount +7.5/15.0
- DSCR +6.2/10.0
- 1% rule +5.4/10.0
- Schools +3.7/10.0
- Livability +3.6/5.0
- Rent growth +2.5/5.0
- Condition / age +2.5/5.0
- Appreciation +0.0/10.0
$935,000
🖨 Deal sheet 📄 Offer letter ✓ Due diligence
Multi-family units
County records classify this as Multi-Family (2-4 Unit). Listing-text estimate: 3 units. confirmed
Listing remarks MLS
Beautiful Legal 3 Family house on a dead end block with a finished basement. Many opportunities for new owner to live rent free or investors looking for a great investment opportunity. This home is fully detached with 8 Bedrooms and 3 baths and a finished basement. The 1St floor has 3 bedrooms , second floor 3 bedrooms and the third floor 2 bedrooms. Property is located on a dead end street, near public transportation, Metro North train, Hutchinson Parkway, Interstate 95, Major stores and supermarkets. Call today to schedule a private showing (at least 24 hour notice needed). . Sold "AS IS" and please do not disturb tenants when viewing.
Key facts
- 4,792 sq ft lot
- Built 1908
- Listed 59 days
Property features AI
Exterior
- Parking: Driveway; No carport
- Utilities: Public sewer; Electricity connected; Natural gas connected
- Home design: Triplex
- Exterior features: Vinyl siding; Not waterfront
Interior
- Bedrooms: Two 3-bedroom units, one 2-bedroom unit, and one 1-bedroom unit
- Bathrooms: Four full bathrooms
- Heating & cooling: Oil heating; No central air conditioning
- Interior features: First-floor bedroom; First-floor full bathroom
Neighborhood map
What this means for you Summary
Snapshot
- This is a 3 × 3-bed/1.3-bath units multifamily listed at $935k.
Deal economics
- At list price, monthly cash flow is $1k ($13k/yr) — positive. Per door: $358/mo.
- The deal already cash-flows at list — no discount required.
- Meets the 1% rule at list price ($10k rent vs $935k).
- Recommended offer: $907k (3.0% below list) — sets the bar for market timing.
- Cap rate 7.7% vs local median 5.3% in Mount Vernon — top-decile yield for the area; either an underpriced asset or a hidden risk that comps aren't pricing in. Stress-test before assuming the spread holds.
Location & tenants
- Location reads 71/100 on livability (#397 in NY) — a middle-class / working-renter tenant base. Strengths: commute A+, health & safety A, employment B; Watch: crime D-, cost of living F.
- Mount Vernon School District (suburban): math 35% / reading 50% proficiency, ranked #485 of 590 in NY (top 82%) — families likely to look elsewhere, expect single-tenant / working-renter base with shorter leases; 62% free/reduced lunch — lower-income household profile, screen leases tightly.
- Zoned schools: Mount Vernon High School (math 54% / reading 75%, grade B-, #776 of 1,100 statewide, top 73%, 1,094 students, 76% FRL).
- Zoned-school proficiency averages 64% at this address vs 42% district-wide (+22 pts) — the actual schools serving this property are materially stronger than the Mount Vernon School District average implies; a family-tenant draw the district grade alone would hide.
- Market conditions: 47 active listings in the ZIP; 954 units permitted in Westchester County in 2024 (649 in 5+ unit buildings).
Forward outlook
- Local home prices are declining (-3.0%/yr); year-one equity from $6k of loan paydown is wiped out by about $28k of value loss. Plan a longer hold.
- Westchester County population projected at +10% by 2050 — modest demand growth; plan on rents tracking national, not racing it.
Negotiation context
- It's been on market 59 days — a 3% lower offer ($907k) is reasonable based on typical stale-listing flexibility.
- 6 sale attempts since 28y ago; this cycle's ask is 31067% above the opening price — seller raised mid-cycle; expect resistance to lowballs.
Risks & watch-outs
- Watch-outs: built in 1908 — expect roof / HVAC / electrical / plumbing capex.
- Climate carrying-cost: major wind risk, 27% chance of damaging wind over 30y; extreme-heat days projected 7→15/yr by 2055 (HVAC capex compounding) — expect insurance premiums to compound above CPI over the hold.
Questions for the listing agent
- It's been on market 59 days. Have you received any prior offers? Is the seller open to a 3% concession, seller financing, or rate buy-down credit?
- Can we see the unit-by-unit rent roll, current vacancy, and any below-market leases? What's the average tenancy length?
- What capital expenditures (roof, boiler, parking lot, exteriors) have been made in the last 5 years, and what's planned in the next 2?
- Built in 1908 — when were the roof, HVAC, electrical panel, plumbing, and water heater last replaced?
- Is there a deadline driving the sale (1031 exchange, divorce, estate, relocation)? That informs how much negotiation room exists.
- Crime grade is D in this area — have there been break-ins, vandalism, or insurance claims at this property in the last 3 years? What carrier currently insures it and at what premium?
- What's the average days-on-market for RENTAL listings here right now (not sales)? A rising rental-DOM trend means longer vacancies and softer asking-rent achievability than the comps imply.
- What's the recent tenant-quality profile in this submarket — average credit score on applications, eviction rate, late-payment / NSF rate, and stable-employment percentage? A property-management company in the area should have these aggregated.
- How much new apartment / multifamily construction is in the pipeline within 1–3 miles? Heavy new supply (>2% of stock underway) typically softens rents 12–24 months out; light construction supports rent growth.
Investment metrics
- 1% rule
- 1.04% ✓
- Cap rate
- 7.67%
- Cash-on-cash
- 4.93%
- DSCR
- 1.22
- GRM
- 8.0
CMA / ARV
No comps found within radius.
Show comp detail 12 sales within ~0.75 mi
| Address | Dist | Beds/Ba | Sqft | Sold | Price | $/sf | Match |
|---|---|---|---|---|---|---|---|
| 12 Martens Pl | 0.25mi | 8/3.0 (-1) | — | 0mo | $825,000 | — | 67 |
| 47 N Columbus Ave | 0.35mi | 8/3.0 (-1) | 3,480 | 9mo | $910,000 | $261 | 55 |
| 176 Elm Ave | 0.33mi | 8/2.0 (-1) | 3,850 | 7mo | $675,000 | $175 | 54 |
| 421 S Columbus Ave | 0.36mi | 10/2.0 (+1) | — | 5mo | $950,000 | — | 53 |
| 214 E Prospect Ave | 0.48mi | 10/5.0 (+1) | — | 3mo | $960,000 | — | 53 |
| 563 E 3rd St | 0.42mi | 9/6.0 | 3,366 | 8mo | $1,000,000 | $297 | 53 |
| 53 Adams St | 0.34mi | 9/3.0 | 3,485 | 20mo | $775,000 | $222 | 52 |
| 227 S 3rd Ave | 0.57mi | 8/3.0 (-1) | — | 2mo | $700,000 | — | 51 |
| 53 Rich Ave | 0.56mi | 9/6.0 | — | 4mo | $1,275,000 | — | 50 |
| 304 S 1st Ave | 0.51mi | 9/3.0 | 2,614 | 13mo | $770,000 | $295 | 49 |
| 215 S 1st Ave | 0.46mi | 8/2.0 (-1) | — | 7mo | $800,000 | — | 48 |
| 356 S 3rd Ave | 0.65mi | 8/5.0 (-1) | — | 14mo | $999,999 | — | 36 |
Match score weights: distance 35% · size 25% · config 20% · recency 20%. Top-matched comps best support the ARV.
Projected returns pro-forma
-3.0% appreciation · 3.0% rent growth · sell at horizon
- IRR
- -8.6%
- Equity multiple
- 0.68×
- Total profit
- $-82,773
- Equity at exit
- $139,412
- IRR
- 0.9%
- Equity multiple
- 1.07×
- Total profit
- $17,146
- Equity at exit
- $80,842
Cash invested: $261,800 (down + closing). Projections, not guarantees.
Landlord ↔ Tenant lean methodology
- Overall (STATE)
- 15 Strongly Tenant-Friendly
- State New York
- 15 Strongly Tenant-Friendly · D+10
- County
- — inherits STATE
- City
- — inherits STATE
ZIP-level market 10553
- Active inventory
- 47
- Price-to-rent
- 23.9×
Monthly cashflow live
- Estimated rent
- $9,766 high interval (Pro) →
- Mortgage (P&I)
- −$4,903
- Tax from tax record
- −$1,347 /mo · $16,165/yr
- Insurance
- −$390
- HOA
- −$0
- Vacancy / Maint / Mgmt
- −$2,051
- Net cashflow
- $1,075
Break-even live
3-unit breakdown (identical units grouped — click to expand)
| Units | Beds | Baths | Est. rent |
|---|---|---|---|
| 3× units | 3 | 1.3 | $9,765 |
| #1 | 3 | 1.3 | $3,255 |
| #2 | 3 | 1.3 | $3,255 |
| #3 | 3 | 1.3 | $3,255 |
| Total (3 units) | $9,766 | ||
UW: 25.0% down · 7.5% · 30yr · 1.5% tax · 5.0% vac · 8.0% maint · 8.0% mgmt
Financing live
Cash to close
- Down payment
- $233,750
- Closing costs
- $28,050
- Reserves months
- —
- Total cash needed
- —
Loan-product check · same deal, 3 products live
Conventional
25% down · 7.5% · 30yr
- Down + closing
- —
- Monthly P&I
- —
- Monthly cashflow
- —
- DSCR
- —
- Eligible?
- —
Personal DTI + credit; lowest rate.
DSCR
20% down · 8.5% · 30yr
- Down + closing
- —
- Monthly P&I
- —
- Monthly cashflow
- —
- DSCR
- —
- Eligible?
- —
No personal income docs; deal must DSCR.
Hard money
10% down · 12.0% · 12mo
- Down + closing
- —
- Monthly P&I
- —
- Monthly cashflow
- —
- DSCR
- —
- Eligible?
- —
Short-term bridge; refi at stabilization.
Listing history 32 events
-
2026-06-18days on market $935,000 Active 59 DOM
-
2026-06-17days on market $935,000 Active 58 DOM
-
2026-06-16days on market $935,000 Active 57 DOM
-
2026-06-15days on market $935,000 Active 56 DOM
-
2026-06-13days on market $935,000 Active 54 DOM
-
2026-06-09days on market $935,000 Active 50 DOM
-
2026-06-08days on market $935,000 Active 49 DOM
-
2026-06-07days on market $935,000 Active 48 DOM
-
2026-06-04days on market $935,000 Active 45 DOM
-
2026-06-03days on market $935,000 Active 44 DOM
-
2026-06-02days on market $935,000 Active 43 DOM
-
2026-06-01days on market $935,000 Active 42 DOM
-
2026-05-31days on market $935,000 Active 41 DOM
-
2026-05-13price $935,000
-
2026-04-20status Active
-
2026-04-19historical $950,000
-
2026-01-31historical $2,500
-
2025-10-24price $2,500
-
2025-09-20price $2,700
-
2025-09-05$3,000
-
2025-07-25soldstatus $870,000
-
2025-06-11soldstatus $870,000 Closed 659-char remark
Show marketing remark (659 chars)
Beautiful Legal 3 Family house on a dead end block with a finished basement. Many opportunities for new owner to live rent free or investors looking for a great investment opportunity. This home is fully detached with 8 Bedrooms and 3 baths and a finished basement. The 1St floor has 3 bedrooms , second floor 3 bedrooms and the third floor 2 bedrooms. Property is located on a dead end street, near public transportation, Metro North train, Hutchinson Parkway, Interstate 95, Major stores and supermarkets. Call today to schedule a private showing (at least 24 hour notice needed). . Sold "AS IS" and please do not disturb tenants when viewing.
-
2025-04-07status Pending 659-char remark
Show marketing remark (659 chars)
Beautiful Legal 3 Family house on a dead end block with a finished basement. Many opportunities for new owner to live rent free or investors looking for a great investment opportunity. This home is fully detached with 8 Bedrooms and 3 baths and a finished basement. The 1St floor has 3 bedrooms , second floor 3 bedrooms and the third floor 2 bedrooms. Property is located on a dead end street, near public transportation, Metro North train, Hutchinson Parkway, Interstate 95, Major stores and supermarkets. Call today to schedule a private showing (at least 24 hour notice needed). . Sold "AS IS" and please do not disturb tenants when viewing.
-
2025-03-17$850,000 Active 659-char remark
Show marketing remark (659 chars)
Beautiful Legal 3 Family house on a dead end block with a finished basement. Many opportunities for new owner to live rent free or investors looking for a great investment opportunity. This home is fully detached with 8 Bedrooms and 3 baths and a finished basement. The 1St floor has 3 bedrooms , second floor 3 bedrooms and the third floor 2 bedrooms. Property is located on a dead end street, near public transportation, Metro North train, Hutchinson Parkway, Interstate 95, Major stores and supermarkets. Call today to schedule a private showing (at least 24 hour notice needed). . Sold "AS IS" and please do not disturb tenants when viewing.
-
2024-12-01historical
-
2024-10-11price $860,000
-
2024-09-29$880,000 Active
-
2017-12-20soldstatus $410,000
-
2017-12-09soldstatus $410,000 Sold
-
2017-09-25historical Pending
-
2017-08-19$400,000 Active
-
1998-01-31
ⓘ Source: listings_history table (triggers on properties + properties_extension) + one-shot
backfill from property_details.listing_events for pre-trigger history.
Tax reassessment forecast NY · Partial reset (capped growth)
- Current annual tax
- $16,165 · $1,347/mo
- Projected year-2 tax
- $16,165 · $1,347/mo
- Expected delta
- $0/yr ($0/mo · 0.0%)
ⓘ Screening estimate from a state-policy table — verify with the county assessor before closing.
Climate risk First Street
- Flood 1/10 Low FEMA zone X (unshaded) · 0% chance over 30 yrs
- Wildfire 1/10 Low
- Heat 6/10 Major 7 d/yr ≥98°F today · 15 d/yr by 30 yrs out
- Wind 6/10 Major 27% chance of damaging wind over 30 yrs
- Air quality 5/10 Major 6 unhealthy d/yr today · 8 by 30 yrs out
Nearby sold comps map
Loading sold comps map…
Walkable amenities ~0.75 mi
Loading nearby amenities…
Taxation est. · year 1
- Rental income
- $117,192
- − Mortgage interest
- −$52,375
- − Property taxes
- −$16,165
- − Insurance
- −$4,675
- − Repairs & maintenance
- −$9,375
- − Management
- −$9,375
- − Depreciation
- −$27,200
- Taxable loss
- −$1,974
- Est. tax savings @ 24.0%
- +$474
- After-tax cash flow
- $13,376/yr
For passive investors: Depreciation is non-cash, so a rental often shows a tax loss while cash-flowing — sheltering income. Rental losses are passive: they offset passive income freely, and up to $25,000/yr can offset ordinary (W-2) income if you actively participate and your MAGI is under $100k (phasing out to $0 by $150k); unused losses carry forward. On sale, claimed depreciation is recaptured at up to 25%, and gains may owe capital-gains tax (a 1031 exchange can defer both). Figures are a year-1 estimate at your 24.0% rate — not tax advice; consult a CPA.
Schools (NCES district)
- District
- Mount Vernon School District
- NCES district ID
- 3620100
- Math proficiency
- 35% ▼ -3.00%
- Reading proficiency
- 50% ▲ 6.00%
- Median HH income
- $50,890
- Composite
- 36.59/100
- National rank
- #4631
- State rank
- #485 of 590 in NY
Livability — Mount Vernon
- Score
- 71/100
- State rank
- #397
- US rank
- #6876
Category grades
Schools grade is shown separately in the Schools card above.
Census & demographics
- Census place
- Mount Vernon, NY
- City population
- 61,313
- Population (ZIP)
- 10,815
Population outlook (Westchester County) Hauer SSP2
- Today (2025)
- 1,028,035 people
- By 2030
- 1,051,636 · +2.3%
- By 2040
- 1,098,520 · +6.9%
- By 2050
- 1,136,044 · +10.5%
- By 2075
- 1,196,925 · +16.4%
- By 2100
- 1,175,147 · +14.3%
Race, ethnicity, and origin ACS 2023
- Neighborhood character
- Predominantly Black (67%)
- Race & ethnicity
- Black 67% Hispanic / Latino 15% White 12% Two or more races 8%
- Hispanic origin (detail)
- Puerto Rican 6% Dominican 3%
- Common ancestry
- Russian 7% Lithuanian 1% Romanian 1%
- Foreign-born
- 35% · Canada, Jamaica, Mexico
- Languages at home
- 76% English-only · Spanish 11% Other Indo-European 6% German/W. Germanic 1%
Political lean MEDSL · Westchester
- 2024 margin
- Strong D (+26.3) · D 63.1% · R 36.9%
- 2008→2024 swing
- -1.3pp toward R · 2008: 27.6pp · 2024: 26.3pp
- All cycles
- 2024: D+26.3 2020: D+36.3 2016: D+32.8 2012: D+22.2 2008: D+27.6
Not yet ingested
- Civics
- —
Market trends
- HPI YoY
- ▼ -114.74%
- Current HPI
- 206.233
- Rent YoY
- —
- Metro
- —
- State GDP YoY
- ▲ 2.60%
- F500 in state
- 92
Industry mix (Fortune 500 HQ in NY)
| Industry | F500 HQs | Revenue |
|---|---|---|
| Financial Services | 10 | $950B |
|
||
| Consumer Goods | 9 | $162B |
|
||
| Insurance | 4 | $225B |
|
||
| Telecommunications | 2 | $144B |
|
||
| Pharmaceuticals | 2 | $112B |
|
||
| Media / Entertainment | 2 | $69B |
|
||
Price history
+133.8% since first listed19 events — show timeline
- 2026-05-13 Price Changed $935,000 OneKey® MLS as Distributed by MLS Grid
- 2026-04-20 Relisted — OneKey® MLS as Distributed by MLS Grid
- 2026-04-19 Coming Soon $950,000 OneKey® MLS as Distributed by MLS Grid
- 2026-01-31 Rental Removed $2,500 RENTEC
- 2025-10-24 Price Changed $2,500 RENTEC
- 2025-09-20 Price Changed $2,700 RENTEC
- 2025-09-05 Listed for Rent $3,000 RENTEC
- 2025-07-25 Sold (Public Records) $870,000 Public Records
- 2025-06-11 Sold (MLS) $870,000 OneKey® MLS as Distributed by MLS Grid
- 2025-04-07 Pending — OneKey® MLS as Distributed by MLS Grid
- 2025-03-17 Listed $850,000 OneKey® MLS as Distributed by MLS Grid
- 2024-12-01 Listing Removed — OneKey® MLS as Distributed by MLS Grid
- 2024-10-11 Price Changed $860,000 OneKey® MLS as Distributed by MLS Grid
- 2024-09-29 Listed $880,000 OneKey® MLS as Distributed by MLS Grid
- 2017-12-20 Sold (Public Records) $410,000 Public Records
- 2017-12-09 Sold (MLS) $410,000 OneKey® MLS as Distributed by MLS Grid
- 2017-09-25 Contingent — OneKey® MLS as Distributed by MLS Grid
- 2017-08-19 Listed $400,000 OneKey® MLS as Distributed by MLS Grid
- 1998-01-31 Listed — HGMLS
Property tax history
+5.2%/yrLatest (2025): $16,165 · +12.4% YoY. Source: county tax records.
Cash-flow waterfall
monthlySold comps — $/sqft
last 12 mo · ≤1 miLoading sold comps…