 🏗️ New Construction
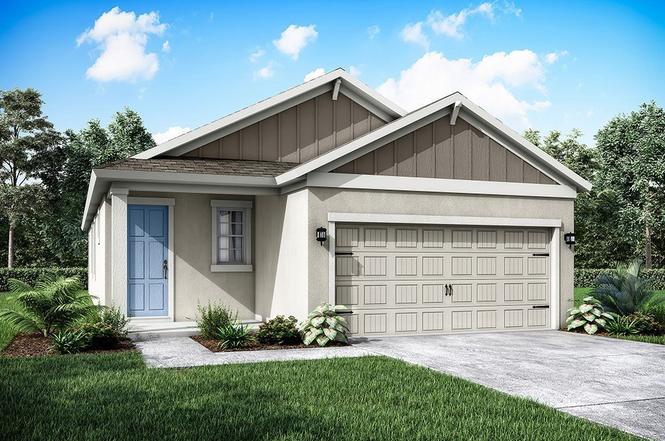
Flora Plan · North Fort Myers, FL
Flood risk No data
- FEMA flood zone
- —
- Chance of flooding over 30 yrs
- —
- Est. flood insurance / yr
- —
Fire risk No data
- Est. fire insurance / yr
- —
Heat risk No data
- Hot days now (above threshold)
- —
- Hot days in 30 yrs
- —
Wind risk No data
- Chance of severe wind over 30 yrs
- —
Air-quality risk No data
- Unhealthy air days now
- —
- Unhealthy air days in 30 yrs
- —
Risk factors via First Street. Map © Google.
Why this score? — see what drove the D grade
The composite is a weighted blend of 9 inputs, each scored 0–100. Each bar is that input's sub-score; the figure is the points it added to the 100-point composite (weight × sub-score).
- Cash flow +12.9/30.0
- ARV discount +7.5/15.0
- Schools +4.6/10.0
- DSCR +3.9/10.0
- 1% rule +3.7/10.0
- Livability +3.7/5.0
- Rent growth +3.5/5.0
- Condition / age +2.5/5.0
- Appreciation +2.4/10.0
$319,990
🖨 Deal sheet (PDF) 📄 Offer letter ✓ Due diligence
Listing remarks
Introducing the Flora, a 3 bedroom, 2 bathroom, 2-car garage home plan with 1,488 sq. . ft. of living space. This single-family home has a welcoming front porch, family room, large owner's suite, and open kitchen with a dining cafe. The family room overlooks the covered lanai. Homebuyers have options to add a triple sliding glass door and an extended lanai - perfect for relaxed Florida entertaining. The spacious owner's bedroom includes a large walk-in closet, and an ensuite bathroom with a glass-enclosed shower, and private commode. There's an option to add a second sink. A laundry room and 2-car garage complete this home. Entertaining is a BreezeThoughtful design decisions in the kitchen
Key facts
- Laundry room
- Covered lanai
- Large walk-in closet
Tags
Property features AI
Finance
- Financial info: List price: $319,990
Exterior
- Home design: Single-family home (Flora plan); Address: 16089 Mulrion Blvd, Punta Gorda, FL 33982
- Construction: Living area approximately 1,488; Built as part of 2025–2026 new construction inventory
- Exterior features: Located in Babcock Ranch community
Interior
- Bedrooms: 3 bedrooms
- Bathrooms: 2 full bathrooms
- Interior features: Plan named Flora; New construction plan
Neighborhood map
What this means for you Summary
Snapshot
- This is a 3-bed/2.0-bath single-family listed at $320k.
Deal economics
- At list price, monthly cash flow is $-21 ($-250/yr) — negative.
- To cash-flow at today's rent, offer at most $306k (4.2% below list).
- To meet the 1% rule (rent ≥ 1% of price), the offer needs to be $268k (16.2% below list).
- Recommended offer: $268k (16.2% below list) — sets the bar for 1% rule.
- Cap rate 6.2% vs local median 3.6% in North Fort Myers — top-decile yield for the area; either an underpriced asset or a hidden risk that comps aren't pricing in. Stress-test before assuming the spread holds.
Location & tenants
- Location reads 74/100 on livability (#269 in FL, #4,409 nationally) — a middle-class / working-renter tenant base. Strengths: cost of living A+, housing A+, health & safety A+; Watch: employment C-, amenities F, commute F.
- Charlotte (suburban): math 54% / reading 54% proficiency, ranked #22 of 73 in FL (top 30%) — acceptable for families but not a draw, mixed tenant base, ~2y average lease.
- Zoned schools: East Elementary School (math 67% / reading 68%, grade B+, #435 of 2,144 statewide, top 21%, 761 students, 52% FRL); Punta Gorda Middle School (math 54% / reading 52%, grade C+, #209 of 571 statewide, top 37%, 1,120 students, 41% FRL); Charlotte High School (math 44% / reading 46%, grade D-, #228 of 667 statewide, top 35%, 1,994 students, 41% FRL).
- Market conditions: Rents rising fast (+4.1%/yr); 1044 active listings in the ZIP; 40 comparable units currently listed for rent nearby; rentals at typical pace (median 23d on market — plan ~3-4 weeks tenant-placement turnaround); 4,585 units permitted in Charlotte County in 2024 (703 in 5+ unit buildings).
- This rent runs 44% of the median local income ($72k/yr) — at the standard rent-burdened threshold; future hikes will face affordability resistance.
Forward outlook
- Local home prices are declining (-3.0%/yr); year-one equity from $2k of loan paydown is wiped out by about $9k of value loss. Plan a longer hold.
- Charlotte County population projected at +24% by 2050 — long-run rental-demand tailwind backs the buy-and-hold thesis.
Negotiation context
- It's been on market 335 days — a 12% lower offer ($282k) is reasonable based on typical stale-listing flexibility.
Questions for the listing agent
- What do current leases actually rent for vs. the listed asking? Can we see a recent rent roll and the last 12 months of T-12 income?
- It's been on market 335 days. Have you received any prior offers? Is the seller open to a 16% concession, seller financing, or rate buy-down credit?
- Why hasn't it sold? Are there any deal-killer items the seller is aware of (foundation, flood, title, zoning, code violations)?
- Is there a deadline driving the sale (1031 exchange, divorce, estate, relocation)? That informs how much negotiation room exists.
- The area grade is low — what's the realistic commute time and amenity access for the typical tenant pool here? Any planned neighborhood developments (good or bad) we should know about?
- What's the average days-on-market for RENTAL listings here right now (not sales)? A rising rental-DOM trend means longer vacancies and softer asking-rent achievability than the comps imply.
- What's the recent tenant-quality profile in this submarket — average credit score on applications, eviction rate, late-payment / NSF rate, and stable-employment percentage? A property-management company in the area should have these aggregated.
- How much new for-sale + rental construction is in the pipeline within 1–3 miles? Heavy new supply typically softens prices + rents 12–24 months out; constrained supply supports both.
Investment metrics
- 1% rule
- 0.87% ✗
- Cap rate
- 6.21%
- Cash-on-cash
- -0.29%
- DSCR
- 0.99
- GRM
- 9.6
CMA / ARV
- ARV (on-the-fly)
- $309,504
- Comps found
- 3
Show comp detail 3 sales within ~0.75 mi
| Address | Dist | Beds/Ba | Sqft | Sold | Price | $/sf | Match |
|---|---|---|---|---|---|---|---|
| 17728 Silverspur Dr | 0.20mi | 2/2.0 (-1) | 1,653 (+11%) | 1mo | $450,000 | $272 | 66 |
| 17596 Wayside Bnd | 0.57mi | 2/2.0 (-1) | 1,564 (+5%) | 13mo | $325,000 | $208 | 49 |
| 16392 Willowgreen Rd #811 | 0.61mi | 3/2.0 | 1,710 (+15%) | 1mo | $337,500 | $197 | 46 |
Match score weights: distance 35% · size 25% · config 20% · recency 20%. Top-matched comps best support the ARV.
Projected returns pro-forma
-3.0% appreciation · 4.13% rent growth · sell at horizon
- IRR
- -15.5%
- Equity multiple
- 0.44×
- Total profit
- $-48,356
- Equity at exit
- $46,148
- IRR
- -5.2%
- Equity multiple
- 0.65×
- Total profit
- $-30,706
- Equity at exit
- $26,760
Cash invested: $86,661 (down + closing). Projections, not guarantees.
Landlord ↔ Tenant lean methodology
- Overall (STATE)
- 87 Strongly Landlord-Friendly
- State Florida
- 87 Strongly Landlord-Friendly · R+3
- County
- — inherits STATE
- City
- — inherits STATE
ZIP-level market 33982
- Home prices YoY
- -1.2%
- Rents YoY
- 4.1%
- Active inventory
- 1044
- Price-to-rent
- 9.9×
Monthly cashflow live
- Estimated rent
- $2,681 medium interval (Pro) →
- Mortgage (P&I)
- −$1,623
- Tax est. 1.5%
- −$387 /mo · $4,643/yr
- Insurance
- −$129
- HOA
- −$0
- Vacancy / Maint / Mgmt
- −$563
- Net cashflow
- $-21
Break-even live
Sensitivity live
| Price | -10% $193 | -5% $86 | +0% $-21 | +5% $-128 | +10% $-235 |
|---|---|---|---|---|---|
| Rent | -10% $-233 | -5% $-127 | +0% $-21 | +5% $85 | +10% $191 |
| Rate | -1.0pp $135 | -0.5pp $58 | base $-21 | +0.5pp $-101 | +1.0pp $-183 |
UW: 25.0% down · 7.5% · 30yr · 1.5% tax · 5.0% vac · 8.0% maint · 8.0% mgmt
Financing live
Cash to close
- Down payment
- $77,376
- Closing costs
- $9,285
- Reserves months
- —
- Total cash needed
- —
Loan-product check · same deal, 3 products live
Conventional
25% down · 7.5% · 30yr
- Down + closing
- —
- Monthly P&I
- —
- Monthly cashflow
- —
- DSCR
- —
- Eligible?
- —
Personal DTI + credit; lowest rate.
DSCR
20% down · 8.5% · 30yr
- Down + closing
- —
- Monthly P&I
- —
- Monthly cashflow
- —
- DSCR
- —
- Eligible?
- —
No personal income docs; deal must DSCR.
Hard money
10% down · 12.0% · 12mo
- Down + closing
- —
- Monthly P&I
- —
- Monthly cashflow
- —
- DSCR
- —
- Eligible?
- —
Short-term bridge; refi at stabilization.
Rent comps 40 comps
| Address | Beds | Baths | Sqft | Rent | $/sqft | DOM | Units | Dist |
|---|---|---|---|---|---|---|---|---|
| 16572 Kingwood Ln #3611 Punta Gorda, FL | 3.0 | 2.0 | 1749 | $4,500 | $2.57 | 23d | 1 | 0.35mi |
| 43038 Parkside Ct Punta Gorda, FL | 3.0 | 2.0 | 1677 | $2,500 | $1.49 | 23d | 1 | 0.37mi |
| 17174 Curry Preserve Dr Punta Gorda, FL | 3.0 | 1.0–2.0 | 1036 | $2,354 | $2.27 | 23d | 58 | 0.56mi |
| 42218 Edgewater Dr Punta Gorda, FL | 2.0 | 2.0 | 1662 | $2,595 | $1.56 | 23d | 1 | 0.71mi |
| 43153 Wild Indigo Rd Punta Gorda, FL | 3.0–5.0 | 2.0–2.5 | 1919 | $2,100 | $1.09 | 23d | 25 | 0.81mi |
| 43060 Greenway Blvd #713 Punta Gorda, FL | 2.0 | 2.0 | 1150 | $5,400 | $4.70 | 23d | 1 | 0.94mi |
| 43060 Greenway Blvd #742 Punta Gorda, FL | 2.0 | 2.0 | 1154 | $6,000 | $5.20 | 23d | 1 | 0.94mi |
| 43060 Greenway Blvd #731 Punta Gorda, FL | 2.0 | 2.0 | 1301 | $6,500 | $5.00 | 23d | 1 | 0.94mi |
| 43050 Greenway Blvd Punta Gorda, FL | 2.0–3.0 | 2.0 | 1235 | $6,000 | $4.86 | 15d | 2 | 0.96mi |
| 43693 Tree Top Trl Punta Gorda, FL | 3.0 | 3.0 | 1850 | $11,000 | $5.95 | 23d | 1 | 0.98mi |
| 43040 Greenway Blvd #532 Punta Gorda, FL | 2.0 | 2.0 | 1170 | $6,000 | $5.13 | 23d | 1 | 1.00mi |
| 43030 Greenway Blvd Punta Gorda, FL | 2.0 | 2.0 | 1184 | $5,500 | $4.65 | 15d | 2 | 1.02mi |
| 43020 Greenway Blvd Punta Gorda, FL | 2.0–3.0 | 2.0 | 1243 | $6,500 | $5.23 | 15d | 7 | 1.04mi |
| 43981 Boardwalk Loop #2222 Punta Gorda, FL | 2.0 | 2.0 | 1154 | $4,900 | $4.25 | 23d | 1 | 1.04mi |
| 43981 Boardwalk Loop #2232 Punta Gorda, FL | 2.0 | 2.0 | 1154 | $5,000 | $4.33 | 23d | 1 | 1.04mi |
| 43010 Greenway Blvd Punta Gorda, FL | 2.0 | 2.0 | 1145 | $6,300 | $5.50 | 23d | 2 | 1.04mi |
| 43000 Greenway Blvd Punta Gorda, FL | 2.0 | 2.0 | 1159 | $4,050 | $3.49 | 15d | 4 | 1.04mi |
| 43051 Greenway Blvd #822 Punta Gorda, FL | 2.0 | 2.0 | 1355 | $7,500 | $5.54 | 23d | 1 | 1.05mi |
| 43645 Sparrow Dr Punta Gorda, FL | 2.0 | 2.0 | 1503 | $6,500 | $4.32 | 15d | 1 | 1.07mi |
| 43041 Greenway Blvd Punta Gorda, FL | 2.0–3.0 | 2.0 | 1569 | $7,500 | $4.78 | 23d | 3 | 1.08mi |
| 43997 Boardwalk Loop #1843 Punta Gorda, FL | 2.0 | 2.0 | 1120 | $1,599 | $1.43 | 23d | 1 | 1.09mi |
| 43997 Boardwalk Loop #1821 Punta Gorda, FL | 3.0 | 2.0 | 1301 | $6,500 | $5.00 | 23d | 1 | 1.09mi |
| 43997 Boardwalk Loop #1827 Punta Gorda, FL | 2.0 | 2.0 | 1154 | $5,400 | $4.68 | 23d | 1 | 1.09mi |
| 43997 Boardwalk Loop #1832 Punta Gorda, FL | 2.0 | 2.0 | 1154 | $5,500 | $4.77 | 23d | 1 | 1.09mi |
| 43031 Greenway Blvd #1014 Punta Gorda, FL | 2.0 | 2.0 | 1366 | $6,000 | $4.39 | 23d | 1 | 1.10mi |
| 43021 Greenway Blvd #1115 Punta Gorda, FL | 2.0 | 2.0 | 1355 | $2,600 | $1.92 | 23d | 1 | 1.11mi |
| 15980 Grassland Ln Punta Gorda, FL | 2.0 | 2.0 | 1467 | $6,625 | $4.51 | 23d | 2 | 1.11mi |
| 15970 Grassland Ln Punta Gorda, FL | 2.0 | 2.0 | 1476 | $6,250 | $4.23 | 23d | 2 | 1.11mi |
| 43011 Greenway Blvd #1225 Punta Gorda, FL | 2.0 | 2.0 | 1355 | $6,000 | $4.43 | 23d | 1 | 1.11mi |
| 43996 Boardwalk Loop #1422 Punta Gorda, FL | 2.0 | 2.0 | 1355 | $5,500 | $4.06 | 23d | 1 | 1.13mi |
| 43993 Boardwalk Loop #1913 Punta Gorda, FL | 2.0 | 2.0 | 1154 | $6,000 | $5.20 | 23d | 1 | 1.15mi |
| 43993 Boardwalk Loop #1941 Punta Gorda, FL | 2.0 | 2.0 | 1198 | $4,500 | $3.76 | 23d | 1 | 1.15mi |
| 42380 Cascade Dr Punta Gorda, FL | 3.0 | 2.0 | 1662 | $2,600 | $1.56 | 23d | 1 | 1.15mi |
| 42425 Cascade Dr Punta Gorda, FL | 3.0 | 2.0 | 1850 | $3,000 | $1.62 | 23d | 1 | 1.19mi |
| 43989 Boardwalk Loop #2041 Punta Gorda, FL | 2.0 | 2.0 | 1154 | $1,850 | $1.60 | 23d | 1 | 1.20mi |
| 43989 Boardwalk Loop #2042 Punta Gorda, FL | 2.0 | 2.0 | 1120 | $5,000 | $4.46 | 23d | 1 | 1.20mi |
| 43989 Boardwalk Loop #2028 Punta Gorda, FL | 3.0 | 2.0 | 1301 | $5,500 | $4.23 | 23d | 1 | 1.20mi |
| 43989 Boardwalk Loop #2024 Punta Gorda, FL | 2.0 | 2.0 | 1120 | $5,400 | $4.82 | 23d | 1 | 1.20mi |
| 43989 Boardwalk Loop #2032 Punta Gorda, FL | 2.0 | 2.0 | 1154 | $6,000 | $5.20 | 23d | 1 | 1.20mi |
| 43977 Boardwalk Loop #2315 Punta Gorda, FL | 2.0 | 2.0 | 1120 | $4,500 | $4.02 | 23d | 1 | 1.22mi |
Listing history 15 events
-
2026-06-22days on market $319,990 Active 335 DOM
-
2026-06-18days on market $319,990 Active 332 DOM
-
2026-06-17days on market $319,990 Active 331 DOM
-
2026-06-16days on market $319,990 Active 330 DOM
-
2026-06-15days on market $319,990 Active 329 DOM
-
2026-06-14days on market $319,990 Active 327 DOM
-
2026-06-13days on market $319,990 Active 326 DOM
-
2026-06-10days on market $319,990 Active 324 DOM
-
2026-06-09days on market $319,990 Active 323 DOM
-
2026-06-08days on market $319,990 Active 322 DOM
-
2026-06-05days on market $319,990 Active 318 DOM
-
2026-06-02days on market $319,990 Active 316 DOM
-
2026-06-01days on market $319,990 Active 315 DOM
-
2026-05-31days on market $319,990 Active 314 DOM
-
2026-05-30days on market $319,990 Active 313 DOM
ⓘ Source: listings_history table (triggers on properties + properties_extension) + one-shot
backfill from property_details.listing_events for pre-trigger history.
Nearby sold comps map
Loading sold comps map…
Walkable amenities ~0.75 mi
Loading nearby amenities…
Taxation est. · year 1
- Rental income
- $32,174
- − Mortgage interest
- −$17,337
- − Property taxes
- −$4,643
- − Insurance
- −$1,548
- − Repairs & maintenance
- −$2,574
- − Management
- −$2,574
- − Depreciation
- −$9,004
- Taxable loss
- −$5,505
- Est. tax savings @ 24.0%
- +$1,321
- After-tax cash flow
- $1,071/yr
For passive investors: Depreciation is non-cash, so a rental often shows a tax loss while cash-flowing — sheltering income. Rental losses are passive: they offset passive income freely, and up to $25,000/yr can offset ordinary (W-2) income if you actively participate and your MAGI is under $100k (phasing out to $0 by $150k); unused losses carry forward. On sale, claimed depreciation is recaptured at up to 25%, and gains may owe capital-gains tax (a 1031 exchange can defer both). Figures are a year-1 estimate at your 24.0% rate — not tax advice; consult a CPA.
Schools (NCES district)
- District
- Charlotte
- NCES district ID
- 1200240
- Math proficiency
- 54% ▼ -6.00%
- Reading proficiency
- 54% ▼ -1.00%
- Median HH income
- $44,864
- Composite
- 45.62/100
- National rank
- #2586
- State rank
- #22 of 73 in FL
Livability — North Fort Myers
- Score
- 74/100
- State rank
- #269
- US rank
- #4409
Category grades
Schools grade is shown separately in the Schools card above.
Census & demographics
- County
- Charlotte County · 196,994 people
- City population
- 57,035
- Metro
- Punta Gorda, FL
- Population (ZIP)
- 13,006
- Household income
- $72,443
- Rent vs Own
- Severe rent burden
- 43.0
Population outlook (Charlotte County) Hauer SSP2
- Today (2025)
- 198,646 people
- By 2030
- 210,507 · +6.0%
- By 2040
- 230,857 · +16.2%
- By 2050
- 247,148 · +24.4%
- By 2075
- 281,777 · +41.8%
- By 2100
- 293,609 · +47.8%
Race, ethnicity, and origin ACS 2023
- Neighborhood character
- Predominantly White (81%)
- Race & ethnicity
- White 81% Two or more races 8% Hispanic / Latino 7% Black 7%
- Hispanic origin (detail)
- Puerto Rican 2% Cuban 3%
- Common ancestry
- Lithuanian 3% Iranian 3% Slovak 3%
- Foreign-born
- 6% · Canada, Jamaica
- Languages at home
- 93% English-only · Spanish 5% German/W. Germanic 1% Arabic 1%
Political lean MEDSL · Charlotte
- 2024 margin
- Solid R (+34.0) · D 32.7% · R 66.7%
- 2008→2024 swing
- -26.7pp toward R · 2008: -7.2pp · 2024: -34.0pp
- All cycles
- 2024: R+34.0 2020: R+26.6 2016: R+27.8 2012: R+14.3 2008: R+7.2
Not yet ingested
- Civics
- —
Market trends
- HPI YoY
- ▼ -5.25%
- Current HPI
- 448.5895
- Rent YoY
- ▲ 4.13%
- Metro
- Punta Gorda, FL
- State GDP YoY
- ▲ 3.28%
- F500 in state
- 36
Industry mix (Fortune 500 HQ in FL)
| Industry | F500 HQs | Revenue |
|---|---|---|
| Industrial Technology | 2 | $29B |
|
||
| Insurance | 2 | $17B |
|
||
| Retail | 1 | $60B |
|
||
| Technology Distribution | 1 | $58B |
|
||
| Homebuilding | 1 | $35B |
|
||
| Technology Manufacturing | 1 | $35B |
|
||
Cash-flow waterfall
monthlySold comps — $/sqft
last 12 mo · ≤1 miLoading sold comps…